Impact Factor ISSN: 1837-9664

 Global reach, higher impact
J Cancer 2017; 8(11):2124-2131. doi:10.7150/jca.18818 This issue Cite
Research Paper
Depletion of CTCF in Breast Cancer Cells Selectively Induces Cancer Cell Death via p53
Ji-Yeon Lee†, Muhammad Mustafa†#, Clara Yuri Kim, Myoung Hee Kim ![]()
Department of Anatomy, Embryology Laboratory, and Brain Korea 21 PLUS Project for Medical Science, Yonsei University College of Medicine, Seoul 03722, Korea
†These authors contributed equally to this work.
#Current address: Department of Biological Sciences, Forman Christian College (A Chartered University), Ferozepur Road, Lahore 54600, Pakistan.
Received 2016-12-19; Accepted 2017-5-22; Published 2017-7-5
Abstract
CCCTC-binding factor (CTCF), a ubiquitous 11-zinc finger multifunctional protein, has distinct molecular functions, such as transcriptional activation, repression, and chromatin barrier activity, in a locus-specific manner. Elevated CTCF levels in breast cancer cells are known to contribute to tumorigenesis; however, the underlying mechanism remains elusive. We investigated the effect of CTCF expression on breast cancer cell survival and elucidated its mechanism. CTCF depletion in MCF-7 cells led to a decreased cell growth and proliferation, surpassing the growth of normal cells under co-culture system of MCF-7-GFP and MCF10A. Here we propose that the phenotypes observed in CTCF-depleted MCF-7 cancer cells, such as reduced cell proliferation, increased apoptosis, and cell cycle arrest, are closely linked with the activation of p53. The consensus CTCF-binding site, located approximately 800 bp upstream of the first exon of TP53, was marked by H3K27me3, but not by the active mark H3K4me3, although CTCF is expressed. Knockdown of CTCF conversely led to the recruitment of H3K4me3 instead of H3K27me3, accompanying with the higher enrichment of PolII in the proximal promoter region of TP53. With the activation of p53, increased p21 and Bax expressions were observed in CTCF knockdown MCF-7 cells. Elucidating functional roles of CTCF and regulation mechanisms may help to guide CTCF and/or its related molecules as a therapeutic target to prevent cancer cell growth.
Keywords: CTCF, p53, breast cancer
Introduction
CCCTC-binding factor (CTCF) is a widely expressed 11-zinc finger multifunctional protein that is involved in different aspects of gene regulation including promoter activation or repression, chromatin insulation, and genomic imprinting [1]. The suggestive role of CTCF in cancer tumorigenesis was from the discovery of CTCF as a transcriptional repressor of the chicken c-myc gene [2, 3], and the subsequent identification of the regulatory role of the mammalian c-myc oncogene [4]. Elucidation of CTCF functions in the regulation of a wide range of genes involved in apoptosis, growth, proliferation, and differentiation has further aroused the interest in the involvement of CTCF in tumorigenesis [5-7]. Based on the current knowledge of CTCF somatic mutations in different cancers as well as the growth inhibitory effect of CTCF in cancer cells and xenograft models, CTCF has been postulated as a candidate tumor suppressor gene [8-10]. Through powerful genomic platforms and sequence data integration [11, 12], CTCF has recently been identified as one of the genes that harbor driver mutations in breast cancer. Paradoxically, however, CTCF levels were found to be elevated rather than reduced in many breast cancer cell lines as well as in breast tumors [13]. Overexpression of CTCF has been thought to confer a selective survival advantage to cancer cells by protecting these cells from apoptosis through the epigenetic regulation of Bax expression [13, 14]. Nevertheless, the exact mechanism of CTCF and involved factors still need to be elucidated.
Here, we investigated the effect of CTCF on breast cancer cell survival and elucidated its mechanism in MCF-7 cells. In addition, as a convenient way to compare the CTCF knockdown effect between breast cancer cells and normal cells, a co-culture system was established by generating GFP-expressing MCF-7 cells and co-culturing them with normal epithelial MCF10A cells. We showed that CTCF depletion had a differential effect on breast cancer cell and normal cell growth. The decreased cell proliferation and increased apoptosis observed in CTCF knockdown breast cancer cells were correlated with the activation of p53 and its downstream signaling.
Methods
Cell lines and cell culture
Breast cancer cell lines MCF-7 and normal breast epithelial cell line MCF10A were cultured as described previously [15]. In order to distinguish cancer cells (MCF-7) from normal cells (MCF10A) in a co-culture system, GFP-expressing stable MCF-7 cell lines were generated by transfection of the GFP expression vector pEGFP-N1 (Clontech, Mountain View, CA, USA) using Lipofectamine 2000TM (Invitrogen, Carlsbad, CA, USA) and selection with G418. CTCF mRNA expression levels were analyzed for three homogenous stable cell lines (MCF-7-GFP-H1, -H2, and -H3) as well as a hetero pool. The MCF-7-GFP-H3 cell line was used for co-culture with MCF10A.
Overexpression and knockdown of CTCF
Full length CTCF cDNA was cloned into the pcDNA3 vector (pcDNA3-CTCF). Breast cancer cell lines were transfected with either control pcDNA3 or pcDNA3-CTCF using Attractene (Qiagen, Hilden, Germany) according to the manufacturer's protocol. For CTCF depletion, shRNA oligonucleotides targeting two different positions on CTCF mRNA (shCTCF-1; 5'-GCGGAAAGTGAACCCATGATA-3', shCTCF-2; 5'-CCTCCTGAGGAATCACCTTAA-3') were designed, synthesized (Cosmo Genetech, Seoul, Korea), and cloned into the pLKO.1-puro vector. Packaging plasmid (pCMV-dR8.91) and envelop plasmid (pVSV-G) were co-transfected with control (pLKO.1), NS shRNA containing vector (pLKO1-NS), or shCTCF containing vector (pLKO1-shCTCF1 or pLKO1-shCTCF2) using Lipofectamine 2000TM (Invitrogen) in HEK-293T cells. MCF-7 cells were transduced with lentiviral particles. Selection was performed using puromycin (1.5 µg/mL), and CTCF knockdown was confirmed by RT-PCR. The experimental timeline for CTCF knockdown cells is presented in Figure S1.
Cell proliferation, cell cycle analysis and apoptosis
Cell proliferation was measured by 3-(4,5-dimethylthiazol-2-yl)-2,5-diphenyltetrazolium bromide (MTT) assay. For cell cycle analysis, MCF-7 cells were harvested and fixed in ice-cold 70% ethanol. The fixed cells were collected by centrifugation, stained with a mixture of RNase and PI for 45 min at 37 °C, and analyzed by fluorescence-activated cell sorter (FACS). The EzWay Annexin V-FITC Apoptosis Detection Kit (Koma Biotech, Seoul, Korea) was used to detect apoptosis.
RNA isolation and RT-PCR
Total RNA was isolated from the cultured cells using TRIzol reagent (Invitrogen) according to the manufacturer's instruction. cDNA was generated using ImProm-IITM Reverse Transcriptase (Promega, Madison, WI, USA). PCR was performed in replicates using G Taq polymerase (Cosmo Genentech, Seoul, Korea). The PCR primers used in this study are listed in Table S1. ImageJ software was used for quantification.
Dual luciferase assay
Genomic DNA fragments from the TP53 locus were amplified using pfu polymerase (Solgent, Daejeon, Korea) and cloned into the pGL3-basic vector (Promega) using KpnI and HindIII sites to generate pGL3-TP53. Restriction enzyme sites were incorporated via forward and reverse primers (Table S1). MCF-7 cells were co-transfected with the Renilla luciferase vector (pRL Renilla luciferase control) and either the control pGL3-basic vector or the pGL3-TP53 construct using Attractene (Qiagen) according to the manufacturer's protocol. Promoter activity was measured using the Dual-Luciferase Reporter Assay System (Promega) after 72 h of transfection and normalized using the Renilla luciferase signal. To analyze the effect of CTCF on promoter activity, MCF-7 cells were co-transfected with the Renilla luciferase vector and pGL3-TP53 vector with either control pcDNA3 or pcDNA3-CTCF, and promoter activities were measured as previously described. A minimum of four independent biological replicates were examined to obtain reliable results.
Chromatin immunoprecipitation (ChIP) analysis
Chromatin was prepared from MCF-7 cells by fixing the cells in 37% formaldehyde for 15 min, followed by quenching with glycine (2.5 M) for 10 min. Sonication of cross-linked genomic DNA was performed using Sonics Vibra CellTM to obtain 500~1,000 bp DNA fragments. ChIP was performed using antibodies against CTCF (#3418; Cell Signaling), PolII (sc-56767; Santa Cruz Biotechnology, CA, USA), H3K4me3 (#1012; Abcam, Cambridge, UK), H3K27me3 (ab6002; Abcam), and IgG (Santa Cruz, sc-2027). Immunoprecipitated DNA was purified and used for PCR. The primers amplifying site A and B (Figure 3A) are shown in the Table S1. A minimum of three independent biological replicates were used for quantitation.
Immunocytochemistry
Cells grown on coverslips were fixed in 4% PFA. Antibodies against CTCF, p53 (sc-126; Santa Cruz,), ITGB4 (ab133682; Abcam) and the corresponding secondary antibodies (anti-rabbit IgG Alexa Flour 594 and anti-goat IgG Alexa Flour 488; Invitrogen) were used for detection. Cells were counter stained with DAPI (Invitrogen) and analyzed using a Zeiss LSM700 confocal microscope.
Autophagy detection by Lysotracker
Lysotracker DND-26 (#8783, Cell Signaling Technology, Inc., Danvers, MA, USA) was diluted 1:10000 directly into cell culture media to make 100 nM final concentration. Live cells were stained with LysoTracker Green DND-26 and Hoechst 34580 for lysosomes and nucleus, respectively, and were analyzed using fluorescent microscopy immediately after treatment without fixation.
Statistical analysis
For all the experiments, a minimum of three independent biological replicates were analyzed for quantitation. Data are expressed as the mean value with standard error. Statistical differences were determined by Student's t-test. A p value of < 0.05 was considered statistically significant.
Results
Depletion of CTCF negatively affects the survival of breast cancer cells
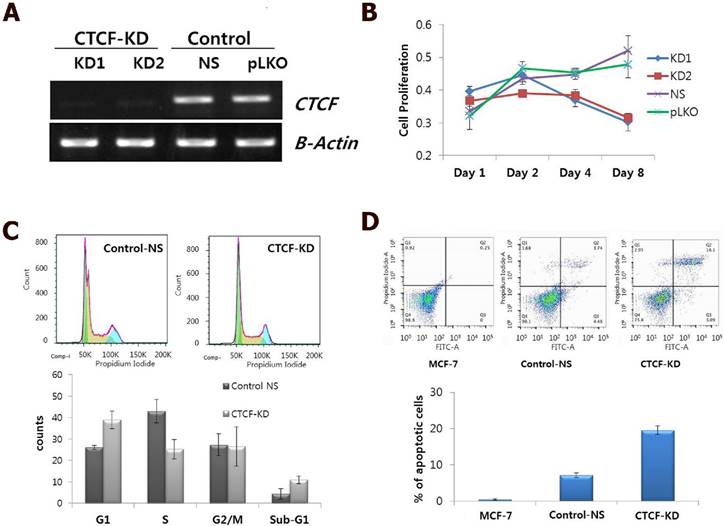
CTCF is ubiquitously expressed, however, its expression levels are variable in different breast cancer cell lines [13]. As CTCF is known to contribute to cancer cell survival through regulation of the proapoptotic gene Bax [13, 14], we first examined the effect of CTCF depletion on cellular processes such as cell proliferation, cell cycle distribution, and apoptosis. shRNA-mediated CTCF knockdown with two different target sequences (KD1 and KD2) successfully reduced CTCF expression level with similar efficiency (Figure 1A). A time course experiment with CTCF knockdown showed that MCF-7 cell proliferation was gradually decreased over a period of time (Figure 1B). Cell cycle analysis using FACS on day 2 after infection with lentivirus containing shRNA against CTCF or non-specific (NS) shRNA revealed that CTCF-depleted MCF-7 cells showed the increased G1 and decreased S phase populations compared with those of control cells (Figure 1C). In addition, an increased number of apoptotic cells were observed in CTCF-depleted cells by Annexin V and PI staining (Figure 1D).
Effect of CTCF knockdown on cell proliferation, cell cycle and apoptosis in MCF-7 cells. (A) mRNA expression of CTCF in CTCF knockdown (KD1 and KD2) and control (non-specific [NS] and empty vector [pLKO]) cells. (B) Cell proliferation was monitored by MTT assay in a time course experiment of MCF-7 cells for the CTCF knockdown (KD1 and KD2) and control (non-specific [NS] and empty vector [pLKO]) group. Y-axis represents the mean value with standard error of the relative proliferation rate. (C) FACS analysis of cell cycle by PI staining. Cell cycle distribution of control non-specific (Control-NS) and CTCF knockdown (CTCF-KD) MCF-7 cells. The distributions of cell populations in each cell cycle phase are presented as bar graphs (lower panel). Data are expressed as the mean value with standard error. (D) FACS analysis of apoptosis by Annexin V and PI staining for Control-NS and CTCF-KD MCF-7 cells as well as parent MCF-7 cells. The '% of apoptotic cells' shown in a bar graph is the sum of 'early apoptotic' (bottom right) and 'apoptotic' (top right) cell population in the scatter plot. Data are expressed as the mean value with standard error from three experimental replicates.
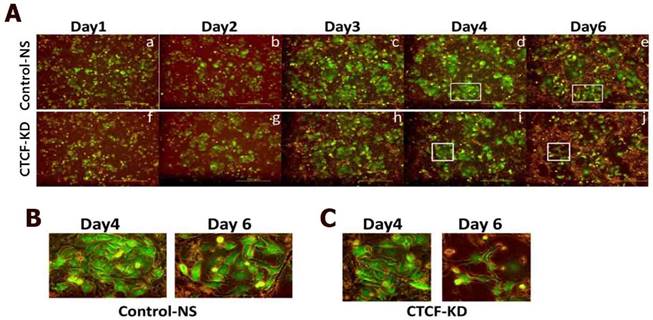
Since CTCF knockdown in normal MCF10A breast epithelial cells did not affect cell proliferation rate in a same time period (Figure S2), we supposed a higher dependency of cancer cells than normal breast epithelial cells on CTCF for survival. In order to confirm the negative effects of CTCF depletion on the survival of breast cancer cells, we developed a co-culture system in which green GFP-expressing MCF-7 cancer cells and normal MCF10A cells grew together (MCF-7-GFP and MCF10A, Figure S3) and observed the effect of CTCF knockdown on the two cell types. Control MCF-7-GFP and MCF10A cells infected with NS shRNA viral particles aggregated to form individual cell colonies with identical cells after day 4; thus, we were able to distinguish bright green MCF-7-GFP colonies from non-green MCF10A colonies (Figure 2A, upper row, and 2B). However, MCF-7-GFP cells failed to maintain their colonies when CTCF was depleted, which led to the overwhelming growth of normal MCF10A cells on the remaining empty surface (Figure 2A, lower row, and 2C). Possibly for the same reason, we were not able to obtain stable cell lines that express CTCF shRNA (data not shown). These observations confirm that long-term depletion of CTCF negatively affects cancer cell (not normal cell) survival and colony formation.
Growth of co-cultured MCF-7 and MCF10A cells under CTCF-depleted conditions. Fluorescence microscopy of MCF-7-GFP and MCF10A cells for the control-NS and CTCF-KD group. Cell growth was monitored at day 1, 2, 3, 4, and 6. (B-C) Zoomed-in images of the square boxes shown in (A).
CTCF directly binds to the upstream region of TP53 and negatively regulates its expression through epigenetic modification
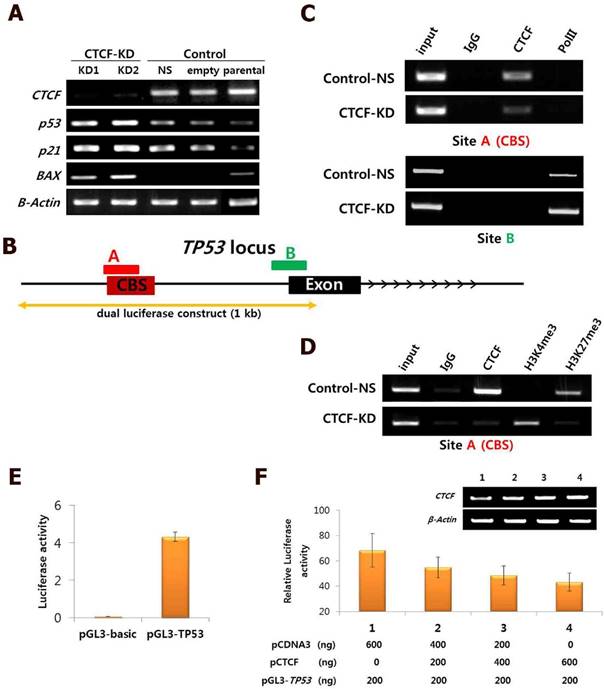
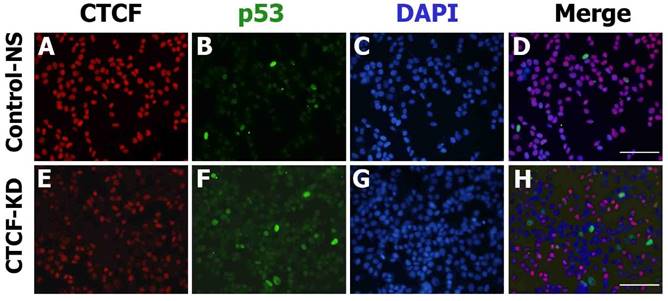
The consistent results achieved suggest that CTCF depletion activates the p53 signaling cascade and induces breast cancer cell death via apoptosis and cell cycle arrest. To determine whether the effects of CTCF on cancer cell survival are through the p53 pathway, we examined the mRNA levels of p53 and its downstream cascade members, p21 and Bax. Following CTCF knockdown, p53, p21, and Bax were upregulated (Figure 3A). By using data from ENCODE, we loaded the CTCF ChIP-seq data from MCF-7 (GSM822305) into a track in the UCSC genome browser and identified a high enrichment of CTCF on the promoter region approximately 800 bp upstream of the TP53 transcription start site where a consensus CTCF-binding site (CBS) was detected (Figure 3B, Figure S4). The second highest peak in the proximal upstream region of the first exon did not contain a CBS. ChIP assay with CTCF antibody demonstrated that CTCF was predominantly bound to the CBS-containing site A rather than site B (Figure 3C, upper panel). The enrichment of CTCF on site A was reduced in CTCF knockdown cells (CTCF-KD). On the other hand, site B was bound with RNA polymerase II (PolII) and its enrichment was higher when CTCF was depleted (Figure 3C, lower panel). Therefore, we suggest that CTCF directly binds to the upstream region of TP53 (site A) and negatively regulates its expression, probably by preventing the binding of PolII with the TSS site. ChIP experiments with histone antibodies showed that the repressive mark H3K27me3 was enriched in control cells whereas the active mark H3K4me3 was enriched in CTCF-depleted cells (Figure 3D), which were consistent with p53 expression status. Luciferase reporter analysis demonstrated the promoter activity of a genomic fragment (-810 to +188 bp) of the TP53 locus, which gradually decreased as the amount of CTCF increased (Figure 3E and F). Immunocytochemistry analysis with CTCF and p53 clearly showed reduction of CTCF and increased p53 expression in CTCF knockdown cells (Figure 4).
Negative regulation of CTCF on p53 expression. (A) mRNA expression of CTCF, p53, p21, and Bax in CTCF knockdown (KD1 and KD2) and control (non-specific [NS] and empty vector [pLKO]) cells. (B) Schematic view of the TP53 gene locus with a CTCF-binding site (CBS). 'A' and 'B' represent amplified regions for ChIP-PCR. See Figure S4 for details. (C) ChIP-PCR analysis for CTCF and PolII binding on site A and B in Control-NS and CTCF-KD MCF-7 cells. (D) ChIP-PCR results for H3K4me3 and H3K27me3 on site A in Control-NS and CTCF-KD cells. (E-F) Analysis of TP53 promoter activity by the luciferase reported plasmid pGL3-TP53 (E) and CTCF dose-dependent inhibition of TP53 promoter activity in MCF-7 cells (F). Data are expressed as the mean value with standard error from four experimental replicates. The TP53 genomic region cloned into the pGL3 vector is presented in (B).
CTCF and p53 protein expression in MCF-7 cells. Fluorescence microscopy images show the expression of p53 (green) and CTCF (red) in control non-specific (Control-NS; A-D) and CTCF knockdown (CTCF-KD; E-H) cells. D and H are merged images of the green, red, and DAPI (blue) channel. Scale bar: 200 µm.
CTCF influences autophagy in MCF-7 cells
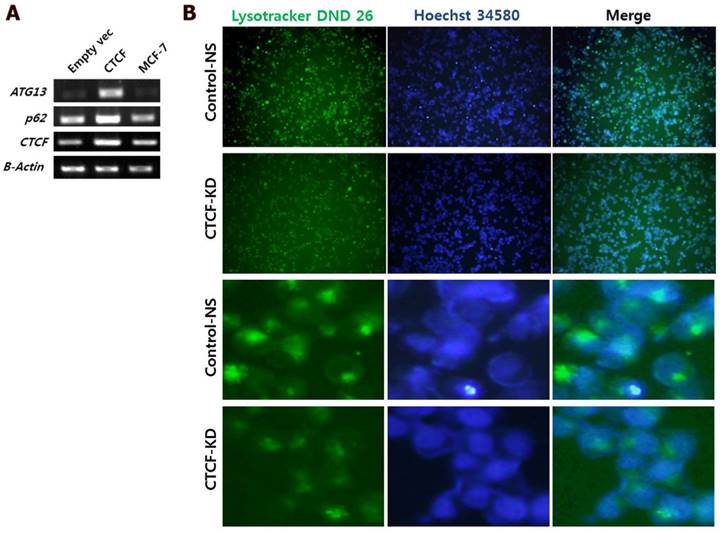
To analyze the effect of CTCF on autophagy, mRNA levels of two important autophagy markers p62 (SQSTM1) and ATG13 were measured in control and CTCF-overexpressing (pCTCF) MCF-7 cells. When CTCF was overexpressed, the expression levels of p62 and ATG13 were increased (Figure 5A) implying that the autophagy is activated by CTCF. Inversely, when CTCF was knockdown, reduced intensities in Lysotracker staining (see Materials and Methosd) was detected (Figure 5B), suggesting the reduced activity of lysosomes upon the reduction of CTCF in MCF-7 cells.
Analysis of autophagy. (A) mRNA levels of autophagy markers, p62 and ATG13, in control (empty vec), CTCF overexpressing (CTCF), and untreated MCF-7 cells. (B) Fluorescent microscopy images of MCF-7 control non-specific (Control-NS) and CTCF-knockdown (CTCF-KD) cells stained with LysoTracker Green DND-26 and Hoechst 34580 for lysosomes and nucleus, respectively.
Discussion
In this study, we provided experimental evidence to demonstrate the contribution of CTCF to the survival of MCF-7 breast cancer cells. CTCF acts as a transcriptional repressor of p53 by binding to its upstream region and creating a local chromatin environment generally associated with transcriptional suppression. Here, we demonstrated that depletion of CTCF in breast cancer cells induced p53 and its downstream genes, such as p21 and Bax, leading to cell cycle arrest and apoptosis. The effect of CTCF inhibition on breast cancer cell growth does not seem to be limited to MCF-7 cells, since knockdown of CTCF in other ER-positive cell line, T47D, also resulted in the reduction of cell proliferation (Figure S5).
A previous study demonstrating the epigenetic regulation of p53 by CTCF in other transformed cell lines [16] suggested that CTCF assists in maintaining an open configuration of chromatin for p53 transcriptional expression, thus supporting a tumor suppressive role of CTCF. However, the contradictory phenomena observed in the breast cancer cells, that is, high upregulation of CTCF and the resulting survival advantages conferred to breast cancer cells [13] cannot be simply explained by tumor suppressive role of CTCF and its positive function for p53. Recently, Méndez-Catalá et al. reported that knockdown of CTCF led to apoptosis in breast cancer cells and demonstrated the preferential binding of CTCF to the Bax promoter in breast cancer cells by comparison with non-breast cells [14]. However, their results were not associated with CTCF action on p53 and its downstream effect. Our data provide evidence for a direct link between CTCF and p53 in mediating cancer cell survival. Unlike previous observations in other cancer cell types [16], CTCF was predominantly bound in the approximately 800 bp upstream region of TP53 containing a CBS rather than in the proximal promoter region in MCF-7 breast cancer cells. CTCF bound to the TP53 upstream region was released by CTCF depletion, accompanying the enrichment of H3K4me3 instead of H3K27me3. ChIP-seq data deposited in ENCODE are consistent with our data showing a negative correlation between CTCF and H3K4me3 enrichment on the marked CBS (Figure S4). Therefore, depletion of CTCF could play an important role in releasing the p53 gene from its transcriptionally silenced status. The resulting expression of p53 and activation of its signaling cascade would support its tumor suppressive role in inducing cell cycle arrest and apoptosis. Activation of the p53 pathway was demonstrated by monitoring the transcriptional expression levels of p53 downstream genes, such as p21 and Bax, and by examining cellular physiological states. In addition, the decreased cytoplasmic expression of integrin-beta 4 (ITGB4), a known p53 target, was found to be associated with p53 expression in the nucleus of CTCF-depleted MCF-7 cells (Figure S6). The loss of ITGB4 expression and the subsequent disruption of ITGB4-mediated cell adhesion may contribute to apoptotic cell death and growth arrest.
Autophagy and apoptosis are two important cellular processes that maintain organismal and cellular homeostasis. The interplay between these two processes is quite complicated and thus difficult to generalize; nevertheless, autophagy generally blocks the induction of apoptosis [17]. Our results showing CTCF-induced autophagy suggest that high CTCF expression facilitates the progression of breast cancer cells by activating autophagy but also by blocking apoptosis; conversely, knockdown of CTCF suppresses autophagy and induces apoptosis by activating the p53 pathway.
Collectively, we demonstrated that CTCF induces the transcriptional silencing of p53, contributing to breast cancer cell survival and tumorigenesis. These results are noteworthy because they suggest a new method to limit the growth and spread of breast cancer cells by selectively promoting apoptotic cell death via inhibition of CTCF expression.
Supplementary Material
Supplementary figures and tables.
Acknowledgements
This research was supported by the Basic Science Research Program through the National Research Foundation (NRF) funded by the Ministry of Education, Science and Technology (NRF-2014R1A1A2056986, NRF-2016R1D1A1B03930822, and NRF-2016R1A2B2011821).
Competing Interests
We have no potential conflicts of interest to disclose.
References
1. Ong C-T, Corces VG. CTCF: an architectural protein bridging genome topology and function. Nat Rev Genet. 2014;15:234-46
2. Lobanenkov V, Nicolas R, Adler V. et al. A novel sequence-specific DNA binding protein which interacts with three regularly spaced direct repeats of the CCCTC-motif in the 5'-flanking sequence of the chicken c-myc gene. Oncogene. 1990;5:1743-53
3. Klenova EM, Nicolas RH, Paterson HF. et al. CTCF, a conserved nuclear factor required for optimal transcriptional activity of the chicken c-myc gene, is an 11-Zn-finger protein differentially expressed in multiple forms. Mol Cell Biol. 1993;13:7612-24
4. Filippova GN, Fagerlie S, Klenova EM. et al. An exceptionally conserved transcriptional repressor, CTCF, employs different combinations of zinc fingers to bind diverged promoter sequences of avian and mammalian c-myc oncogenes. Mol Cell Biol. 1996;16:2802-13
5. Recillas-Targa F, De La Rosa-Velázquez IA, Soto-Reyes E. et al. Epigenetic boundaries of tumour suppressor gene promoters: the CTCF connection and its role in carcinogenesis. J Cell Mol Med. 2006;10:554-68
6. Rayess H, Wang MB, Srivatsan ES. Cellular senescence and tumor suppressor gene p16. Int J Cancer. 2012;130:1715-25
7. Saldaña-Meyer R, Recillas-Targa F. Transcriptional and epigenetic regulation of the p53 tumor suppressor gene. Epigenetics. 2011;6:1068-77
8. Fiorentino FP, Giordano A. The tumor suppressor role of CTCF. J Cell Physiol. 2012;227:479-92
9. Rasko JE, Klenova EM, Leon J. et al. Cell Growth Inhibition by the Multifunctional Multivalent Zinc-Finger Factor CTCF. Cancer Res. 2001;61:6002-7
10. Tiffen JC, Bailey CG, Marshall AD. et al. The cancer-testis antigen BORIS phenocopies the tumor suppressor CTCF in normal and neoplastic cells. Int J Cancer. 2013;133:1603-13
11. Cancer Genome Atlas N. Comprehensive molecular portraits of human breast tumours. Nature. 2012;490:61-70
12. Nik-Zainal S, Davies H, Staaf J. et al. Landscape of somatic mutations in 560 breast cancer whole-genome sequences. Nature. 2016;534:47-54
13. Docquier F, Farrar D, D'Arcy V. et al. Heightened Expression of CTCF in Breast Cancer Cells Is Associated with Resistance to Apoptosis. Cancer Res. 2005;65:5112-22
14. Méndez-Catalá CF, Gretton S, Vostrov A. et al. A Novel Mechanism for CTCF in the Epigenetic Regulation of Bax in Breast Cancer Cells. Neoplasia. 2013;15:898-912
15. Lee J-Y, Hur H, Yun HJ. et al. HOXB5 Promotes the Proliferation and Invasion of Breast Cancer Cells. Int J Biol Sci. 2015;11:701-11
16. Soto-Reyes E, Recillas-Targa F. Epigenetic regulation of the human p53 gene promoter by the CTCF transcription factor in transformed cell lines. Oncogene. 2010;29:2217-27
17. Marino G, Niso-Santano M, Baehrecke EH. et al. Self-consumption: the interplay of autophagy and apoptosis. Nat Rev Mo. Cell Biol. 2014;15:81-94
Author contact
![]() Corresponding author: E-mail: mhkim1ac; Tel: +82-2-2228-1647, Fax: +82-2-365-0700
Corresponding author: E-mail: mhkim1ac; Tel: +82-2-2228-1647, Fax: +82-2-365-0700