Impact Factor ISSN: 1837-9664

 Global reach, higher impact
J Cancer 2017; 8(5):704-715. doi:10.7150/jca.18027 This issue Cite
Research Paper
Monitoring of Blood Vessel Density Using Contrast-Enhanced High Frequency Ultrasound May Facilitate Early Diagnosis of Lymph Node Metastasis
Takuma Sato1,4, Tomoaki Takemura1, Tomoki Ouchi1, Shiro Mori1,2, Maya Sakamoto3, Yoichi Arai4, Tetsuya Kodama1 ![]()
1. Graduate School of Biomedical Engineering, Tohoku University, 4-1 Seiryo-machi, Aoba, Sendai, Miyagi 980-8575, Japan;
2. Department of Oral and Maxillofacial Surgery, Tohoku University Hospital, 1-1 Seiryo-machi, Aoba, Sendai, Miyagi 980-8575, Japan;
3. Department of Oral Diagnosis, Tohoku University Hospital, 1-1 Seiryo-machi, Aoba, Sendai, Miyagi 980-8575, Japan;
4. Department of Urology, Tohoku University Graduate School of Medicine, 1-1 Seiryo-machi, Aoba, Sendai, Miyagi 980-8575, Japan.
Received 2016-10-27; Accepted 2017-1-12; Published 2017-2-25
Abstract
Time-dependent alterations in the ultrasonography characteristics of lymph nodes during early-stage metastasis have not been compared with those of tumor-draining lymph nodes that do not develop tumor; this is partly due to the absence of an appropriate experimental model. In a previous study of lymph nodes with experimental early-stage metastasis, we used contrast-enhanced high-frequency ultrasound to demonstrate that an increase in lymph node blood vessel density preceded any changes in lymph node volume. In the present study, we used an experimental model of lymph node metastasis in which tumor cells metastasized from the subiliac lymph node to the proper axillary lymph node (the tumor-draining lymph node). We utilized contrast-enhanced high-frequency ultrasound to perform a longitudinal analysis of tumor-draining lymph nodes, comparing those at an early-stage of metastasis with those that did not develop detectable metastasis. We found that the normalized blood vessel density of an early-stage metastatic lymph node exhibited a progressive rise, whereas that of a tumor-draining lymph node not containing tumor began to increase later. For both types of lymph nodes, the normalized blood vessel density on the final day of experiments showed a trend towards being higher than that measured in controls. We further found that mice with an initially low value for lymph node blood vessel density subsequently showed a larger increase in the blood vessel density of the metastatic lymph node; this differed significantly from measurements in controls. The present study indicates that a longitudinal analysis of the blood vessel densities of tumor-draining lymph nodes, made using contrast-enhanced high-frequency ultrasound imaging, may be a potentially promising method for detecting early-stage lymph node metastasis in selected patients. Furthermore, our findings suggest that tumor in an upstream lymph node may induce alteration of the vascular structures in draining lymph nodes that do not contain tumor.
Keywords: lymph node metastasis, contrast-enhanced high frequency ultrasound, blood vessel density, early diagnosis
Introduction
The lymphatic system acts as a secondary circulation system, and both its anatomical and physiological characteristics provide an ideal environment for the transport and survival of tumor cells [1]. In fact, the lymphatic system serves as an initial route of tumor cell spread for many carcinomas, including those of the breast, colon, lung and prostate [2]. Lymph node metastasis has a strong impact on the prognosis of many types of cancers [3-6], and its accurate diagnosis is important for decision-making regarding therapeutic strategy [7, 8]. Early detection of lymph node metastasis facilitates the early initiation of treatment and may improve the prognosis of patients with lymph node metastasis, but a reliable method for identifying small tumors in lymph nodes has not been fully established [9].
Grayscale ultrasound (US) imaging is widely used for detecting metastatic lymph nodes [10]. The criteria used for the diagnosis of lymph node metastasis by grayscale US are size, shape (rounded node), calcification, change in echogenicity, cystic necrosis, cortical thickening and loss of the fatty hilum [11-13]. Contrast-enhanced (CE), color and power Doppler US are capable of assessing blood flow in tissues of interest [14], and this can help to distinguish between benign and malignant tumors [15]. It is possible to evaluate the macrovascular blood flow and vascular resistance of individual lymph nodes using power and color Doppler US, and malignant lymph nodes have been shown to exhibit peripheral vascularity or a mixture of hilar and peripheral vascularity [16, 17]. Contrast-enhanced US (CE-US) is capable of monitoring blood flow through a microvascular network [18, 19]. It has been reported that, compared with grayscale US, CE-US and a combination of grayscale US with CE-US improves the accuracy of the diagnosis of lymph node metastasis, and the best known criterion used by CE-US is a heterogeneous pattern of enhancement [20-22]. As far as we are aware, no previous investigations have compared the sonographic features between tumor-draining lymph nodes that develop metastasis (from an upstream lymph node) with those that do not develop tumor. Until now, an appropriate experimental model in which to make this comparison has not been developed, and CE or grayscale US imaging findings of tumor-draining lymph nodes under these two conditions have not been fully described [9].
In a previous study, we established an experimental model of lymph node metastasis using sarcoma cells and MRL/MpJ-lpr/lpr (MRL/lpr) mice, which develop severe autoimmune diseases and exhibit systemic lymph node swelling [23-25]. Sarcoma cells are inoculated into the subiliac lymph node (SiLN), and subsequently all experimental mice develop metastasis to the proper axillary lymph node (PALN, the draining lymph node) via lymphatic vessels [24]. Our research group has used this model to demonstrate that the normalized blood vessel density of an experimental metastatic lymph node (i.e. the PALN), measured by contrast-enhanced high-frequency US (CE-HFUS), exhibited a significant increase before any increment in the lymph node size was detected [9]. The results suggest that detecting an increase in the blood vessel density of a tumor-draining lymph node may be a potentially promising method for identifying lymph node metastasis at an early stage. However, the model described above has certain limitations: first, because all experimental mice develop metastases to the draining lymph nodes, it is not possible to differentiate draining lymph nodes to which tumor cells do not metastasize from the upstream node; and second, the autoimmune diseases that develop in MRL/lpr mice may induce angiogenesis [26]. The growth of lymphatic vessels induced by a tumor (tumor-lymphangiogenesis) is deeply associated with the dissemination of cancer cells through the lymphatic system [27]. This phenomenon is observed in tumor-draining lymph nodes at a premetastatic stage and is thought to be induced by various soluble factors secreted from tumor in upstream lymph nodes [28]. However, it has not been unequivocally established whether alteration of the vascular structure of a tumor-draining lymph node can be induced at a premetastatic stage by tumor in an upstream lymph node.
The model of lymph node metastasis in the present study used mouse mammary cancer cells and MXH10/Mo-lpr/lpr (MXH10/Mo/lpr) mice, which exhibit remarkable lymphadenopathy and develop only mild autoimmune diseases [29, 30]. Tumor cells were inoculated into the SiLN (as with the MRL/lpr mouse model), but only a certain proportion of MXH10/Mo/lpr mice developed metastasis from the SiLN to the PALN (unlike MRL/lpr mice). This MXH10/Mo/lpr mouse model of lymph node metastasis was used to monitor three types of PALN, using CE-HFUS: tumor-positive PALNs (luciferase-labeled breast cancer cells were injected into the SiLN and subsequently metastasized to the PALN); PALNs not containing detectable tumor (tumor cells were inoculated into the SiLN but metastatic spread to the PALN was not demonstrated); and controls. The aims of the present study were to monitor the sizes, morphological characteristics, densities and volumes of blood vessels in these various types of PALN and to investigate the correlation between the initial value for blood vessel density and the subsequent time-dependent changes in these parameters.
Materials and Methods
The Institutional Animal Care and Use Committee of Tohoku University approved the animal experiment protocols.
Cell preparation
FM3A-Luc cells, a C3H/He mouse mammary carcinoma cell line that stably expresses the firefly luciferase gene, were established and cultured as previously described [31].
Animal model
The mouse strain of MHX10/Mo/lpr was generated by intercrossing MRL/lpr and C3H/HeJ-lpr/lpr strains as previously described [30]. The MXH10/Mo/lpr mice were bred under specific pathogen-free conditions.
Lymph node metastasis model
Twenty-six mice (male-to-female ratio of 1:1; 16-18 weeks old) were used in the in vivo experiments, divided into two groups as follows: control (n = 10) and tumor cell inoculation (n = 16). For the tumor cell inoculation group, FM3A-Luc cells were suspended in 20 μL of phosphate-buffered saline (PBS; Sigma-Aldrich, St. Louis, MO, USA) and then mixed with 40 μL of Matrigel (BD Biosciences, Franklin Lakes, NJ, USA); 60 μL of this cell suspension (the number of FM3A-Luc cells in this suspension was 1.5 × 10⁶ cells/mL) was injected into the unilateral SiLN of the experimental mice using a 24-gauge needle (outer diameter 0.55 mm, Terumo, Tokyo, Japan). For the control group, 60 μL of the PBS/Matrigel mixture (without cells) was injected into the unilateral SiLN of each mouse. The day of inoculation was defined as day 1. The injections were carried out with the assistance of US guidance using a high-frequency US (HFUS) imaging system with a 25-MHz center-frequency transducer (Vevo 770; VisualSonics Inc., Toronto, Ontario, Canada). In the present study, the PALN was considered as the experimental tumor-draining lymph node.
Evaluation of lymph node metastasis by luciferase activity monitoring
Measurement of in vivo bioluminescence signal intensity from the PALN of mice in each group was carried out using an IVIS Lumina system (Xenogen Co., Alameda, CA, USA). Mice were deeply anesthetized by inhalation anesthesia using 2% isoflurane (Abbott Japan Co., Ltd., Tokyo, Japan) in oxygen delivered at 1 L/min. On days 7, 14 and 21, luciferase activity was measured as previously described [29]. The bioluminescence signal intensity was quantified in a manually selected region of interest over the PALN of each MHX10/Mo/lpr mouse. Values measured on days 14 and 21 for each group were normalized to those on day 7.
Measurement of time-dependent changes in the grayscale intensity of the PALN
Time-dependent changes in the grayscale intensity of the PALN were investigated. B-mode images were acquired from the center of each PALN using the HFUS imaging system with a 25-MHz center-frequency transducer (RMV710B, axial resolution 70 μm).
Sonazoid (Daiichi Sankyo, Tokyo, Japan), with a median diameter ranging from 2.3-2.9 μm, was used as the microbubbles for imaging and prepared according to the manufacturer's instructions [32, 33]. The PALN of experimental mice in each group was prepared using a coupling gel (Aquasonic 100; Parker Laboratories, Inc., Fairfield, NJ, USA) and then examined by HFUS. Experimental mice were positioned on a heated stage after being anesthetized with 2% isoflurane (Abbott Japan Co., Ltd.) in oxygen, and Sonazoid (100 µL) was administered intravenously to 4 MHX10/Mo/lpr mice. B-mode images were recorded continuously for 9 min. The boundary of each PALN was manually traced in the two-dimensional (2D) images and the grayscale intensity in each frame was calculated using quantification software (VisualSonics Inc.). The pixel intensities between successive 2D images of PALN obtained at pre- and post-administration of Sonazoid were analyzed, and the areas that exceeded a threshold value (set at 300) were highlighted by a green overlay using quantification software (VisualSonics Inc.). The green area on the B-mode image was considered to be the extracted vessel image.
Monitoring of blood vessel density and volume in the PALN
To evaluate longitudinal alterations in blood flow in metastatic lymph nodes, the PALNs of mice in both groups were imaged using the CE-HFUS system on the day before inoculation (day 0) and on days 8, 15 and 22. Consecutive 2D images (slice thickness, 100 μm) throughout the whole PALN were acquired before and after intravenous injection of 100 μL Sonazoid into the caudal vein, for subsequent three-dimensional (3D) reconstruction. The method of acquiring the extracted vessel images from the 2D images was the same as described above. The boundary of each PALN was manually traced in the 2D images and then a 3D image was reconstructed automatically. PALN volume and blood vessel density were calculated by quantification software (VisualSonics Inc.); the blood vessel volume was obtained by multiplying the PALN volume by the blood vessel density. The values were normalized to those obtained on day 0. Throughout the imaging session, each mouse was positioned on a heated stage and anesthetized with 2% isoflurane (Abbott Japan Co., Ltd.) in oxygen. Respiration gating was used to suppress imaging artifacts due to unavoidable respiratory movements.
Histopathological analysis
On day 22, the PALNs were resected and fixed in 10% formaldehyde (Wako Pure Chemical Industries, Ltd., Osaka, Japan), and subsequently dehydrated. The specimens were then embedded in paraffin and cut into 4-μm serial sections. The presence of tumor cells in the PALN was confirmed in hematoxylin and eosin (HE) stained sections, which were then immunostained with anti-CD31 antibody to detect CD31-positive cells, as previously described [29]. The 'hot-spot' method was used to evaluate blood vessel density [34]. A hot-spot was defined as an area rich in CD31-positive vascular structures. Using a microscope, 5 hot-spot fields (each 320 μm × 706 μm in size) were chosen under low magnification (× 40), and the number of CD31-immunostained vascular structures in each field were counted and summated under high magnification (× 200). In the present study, this value was defined as microvessel density.
Statistical analysis
Data are expressed as the mean ± standard error of the mean (SEM). Kruskal-Wallis and Steel-Dwass tests were used for statistical analyses of the normalized luciferase activity measurements. Analysis of variance (ANOVA) and the Tukey-Kramer test were used to compare values between groups in the other experiments. Differences were considered to be significant at P < 0.05. The statistical analyses were carried out using JMP 11 (SAS Institute Inc., Cary, NC, USA).
Results
Lymph node metastasis model
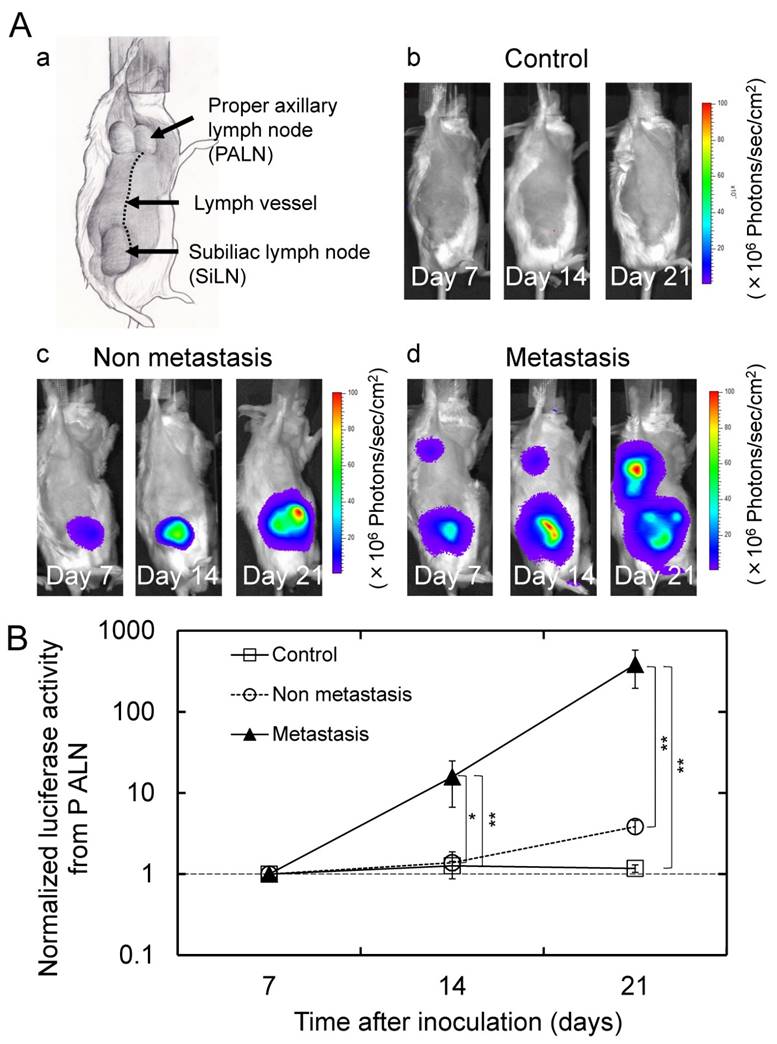
Figure 1Aa illustrates the anatomical characteristics of an MXH10/Mo/lpr mouse (16-18 weeks old). Systemic lymphadenopathy is observed, and the SiLN clearly communicates with the PALN via a lymph vessel. A longitudinal analysis of luciferase activity (days 7, 14 and 21) was carried out. All 16 mice in the tumor cell inoculation group exhibited an increase in the bioluminescence intensity from the SiLN. In this group, 10 mice showed a progressive increase in bioluminescence intensity from the PALN and were defined as the metastasis group (i.e. tumor-positive PALNs), and 6 mice without an increase in bioluminescence intensity from the PALN were considered as the non-metastasis group (i.e. tumor-free PALNs). Representative bioluminescence images from each group are shown in Fig. 1Ab, c, d. The normalized luciferase activity of the PALN in the metastasis group was significantly higher than in the non-metastasis and control groups on days 14 and 21 (Fig. 1B).
Lymph node metastasis model (Aa) Anatomical drawing of an MXH10/Mo/lpr mouse. (Ab, c, d) Representative in vivo bioluminescence images obtained from mice in each group. Mice in the metastasis group demonstrated an increase in the bioluminescence signal intensity from the PALN. (B) Longitudinal analysis of the normalized luciferase activity in the PALN (n = 10 for the control group; n = 6 for the non-metastasis group; and n = 10 for the metastasis group). The values at different time points were normalized to those on day 7. On days 14 and 21, the normalized luciferase activity in the PALN was significantly higher in the metastasis group than in the non-metastasis and control groups. Mean ± SEM values are shown. *P < 0.05; **P < 0.01.
Evaluation of time-dependent changes in the grayscale intensities of the PALN
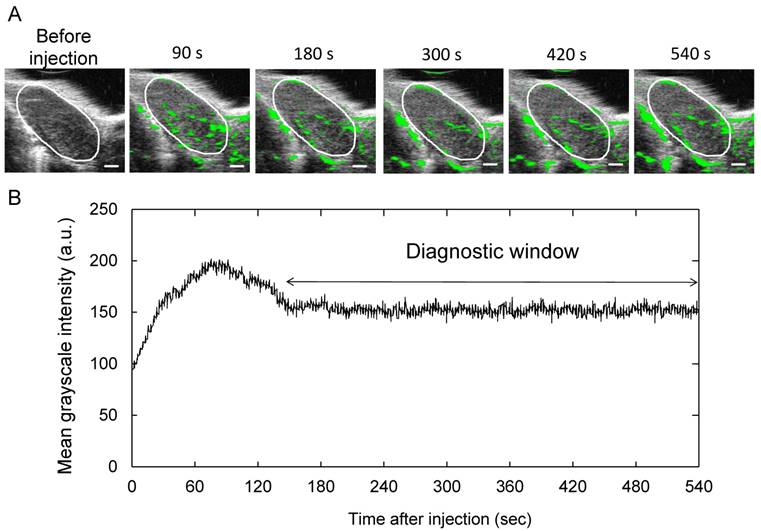
To measure the duration in which Sonazoid was acoustically active in the PALN, we investigated the time-intensity relation of B-mode images after the administration of Sonazoid. Representative images are shown in Fig. 2A; the areas in the PALN highlighted in green did not exhibit any major changes during the entire measurement period. Figure 2B shows the time-intensity relationship in the PALN, illustrating that the mean grayscale intensity of the PALN remained stable from approximately 150 s after injection of Sonazoid to the end of the measurement (n = 4). Therefore, the diagnostic window was determined to be between 150s and 540s.
Acoustically active lifetime of Sonazoid in the PALN (A) Two-dimensional US images of the PALN obtained before and after intravenous injection of Sonazoid. (B) Temporal changes in the grayscale intensity of the PALN (n = 4). The mean grayscale intensity of the PALN increased gradually during the early phase of measurement and then subsequently decreased to a level that remained stable from approximately 150 s after injection of Sonazoid to the end of the measurement period (540 s). Scale bars represent 1 mm.
Monitoring of blood vessel density in the PALN
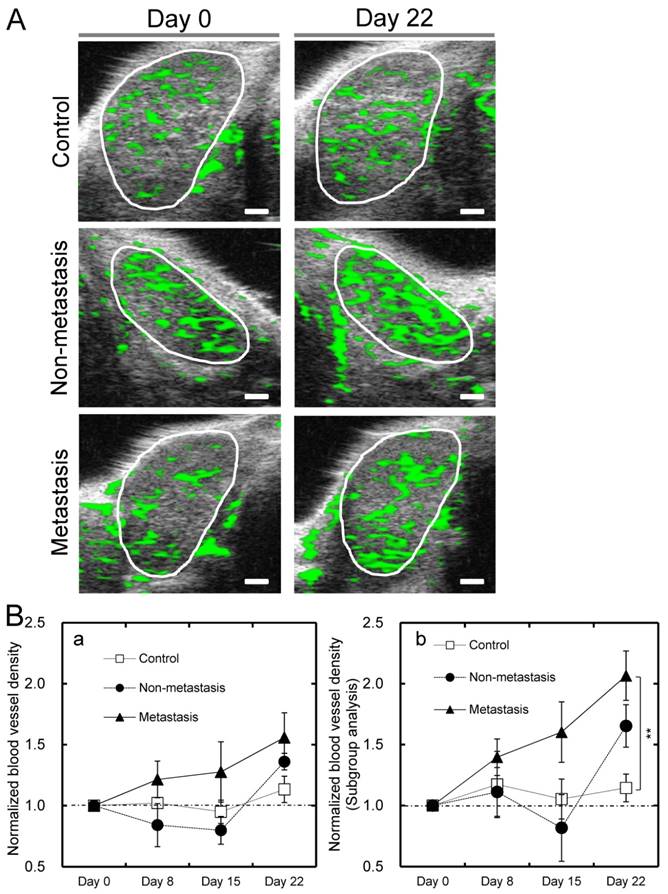
To investigate time-dependent changes in blood vessel density within the PALN in each group, a longitudinal analysis was carried out using 3D CE-HFUS imaging. Representative B-mode images of the PALN in each group are shown in Fig. 3A. In all 3 groups there were no obvious differences in the morphological features or distribution of the green overlay within the PALN (vessel extraction image) between images obtained on day 0 and those acquired on day 22. Mean values for the blood vessel density of the PALN on day 22 were 40.9% in the metastasis group (n = 10), 44.8% in the non-metastasis group (n = 6) and 37.3% in the control group (n = 10). The normalized blood vessel density of the PALN in the control group showed little or no change for the entire study period. In contrast, the corresponding value in the metastasis group exhibited a progressive rise and showed a trend towards being higher than that of the non-metastasis and control groups on days 8, 15 and 22 (Fig. 3Ba). The normalized blood vessel density of the PALN in the non-metastasis group increased between days 15 and 22 (Fig. 3Ba). Additional analysis was performed in mice in which blood flow in the PALN was initially low, i.e. a blood vessel density on day 0 < 35% (this cutoff value was selected because the mean blood vessel density of the PALN on day 0 was approximately 35%). In the subgroup analysis, the normalized blood vessel density of the PALN was significantly higher in the metastasis group than in the control group on day 22 (P < 0.01; n = 6 for the control group; n = 3 for the non-metastasis group; and n = 5 for the metastasis group) (Fig. 3Bb).
Blood vessel density in the PALN measured by CE-HFUS imaging (A) Representative vascular extraction images for each group, taken from the widest cross-section of the PALN on days 0 and 22. The white circles indicate the boundary of each PALN. In the control group, there were no obvious differences in vessel structure between the US images obtained on days 0 and 22. In vascular extraction images from the non-metastasis and metastasis groups, the proportion of the PALN colored green was higher on day 22 than on day 0. (B) A longitudinal analysis of the normalized blood vessel density of the PALN in each group. The normalized blood vessel density of the PALN in the metastasis group progressively increased and showed a trend toward being higher than that in the other two groups on days 8, 15 and 22; however there were no statistically significant differences between the groups (Fig. 3Ba; n = 10 for the control group; n = 6 for the non-metastasis group; and n = 10 for the metastasis group). Additional analysis was performed in mice in which the PALN had an initially low blood vessel density (blood vessel density < 35% on day 0) (Bb). A significant difference was demonstrated between the control and metastasis groups on day 22 (P < 0.01; n = 6 for the control group; n = 3 for the non-metastasis group; and n = 5 for the metastasis group). **P < 0.01. Scale bars represent 1 mm.
Measurement of changes in blood vessel volume and the size of the PALN
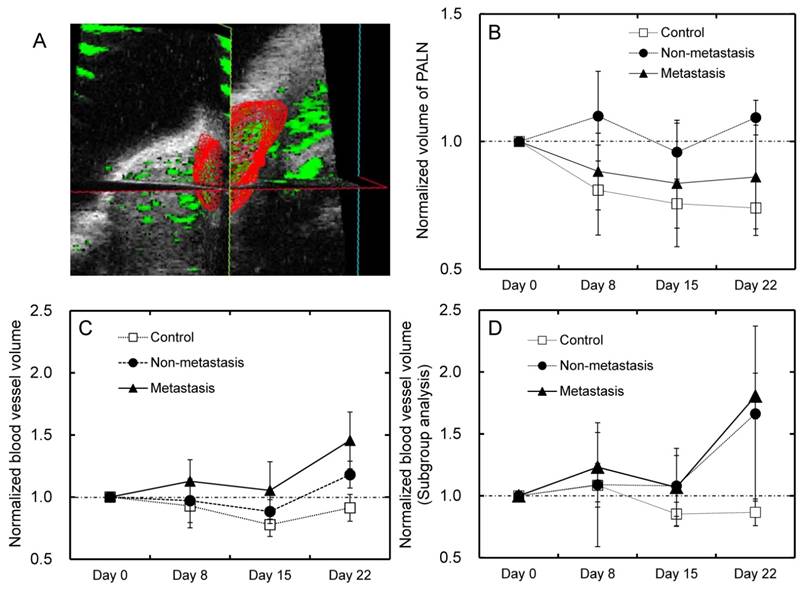
The blood vessel volume of the PALN was investigated using 3D CE-HFUS and normalized to that measured on day 0. A representative 3D image of the PALN is shown in Fig. 4A. In all groups, the normalized volume of the PALN did not show any significant changes during the entire experimental period (Fig. 4B). The normalized blood vessel volume of the PALN in the metastasis and non-metastasis groups suggested a trend towards being higher than in the control group (Fig. 4C). As described above, subgroup analysis was performed for blood vessel volume measurements. For mice in which blood flow in the PALN was low on day 0, the metastasis and non-metastasis groups exhibited an increase in the normalized blood vessel volume of the PALN between days 15 and 22; however, there were no significant differences between any of the groups (Fig. 4D).
Analysis of PALN volume and blood vessel volume of the PALN (A) Representative three-dimensional images of the PALN on day 0 in the control group. The PALN did not contain tumor cells. (B) The volume of the PALN was measured for each group. None of the groups showed any significant changes in PALN volume during the experimental period. (C) The normalized blood vessel volume of the PALN in the metastasis and non-metastasis groups appeared to increase between days 15 and 22, although there were no significant differences between any of the groups (n = 10 for the control group; n = 6 for the non-metastasis group; and n = 10 for the metastasis group). (D) Additional analysis was carried out in mice in which the PALN had an initially low blood vessel density (blood vessel density < 35% on day 0). There was a trend toward a higher normalized blood vessel volume in the metastasis and non-metastasis groups compared to the control group, although statistical significance was not reached (n = 6 for the control group; n = 3 for the non-metastasis group; and n = 5 for the metastasis group).
Histological analysis and quantification of the number of blood vessels
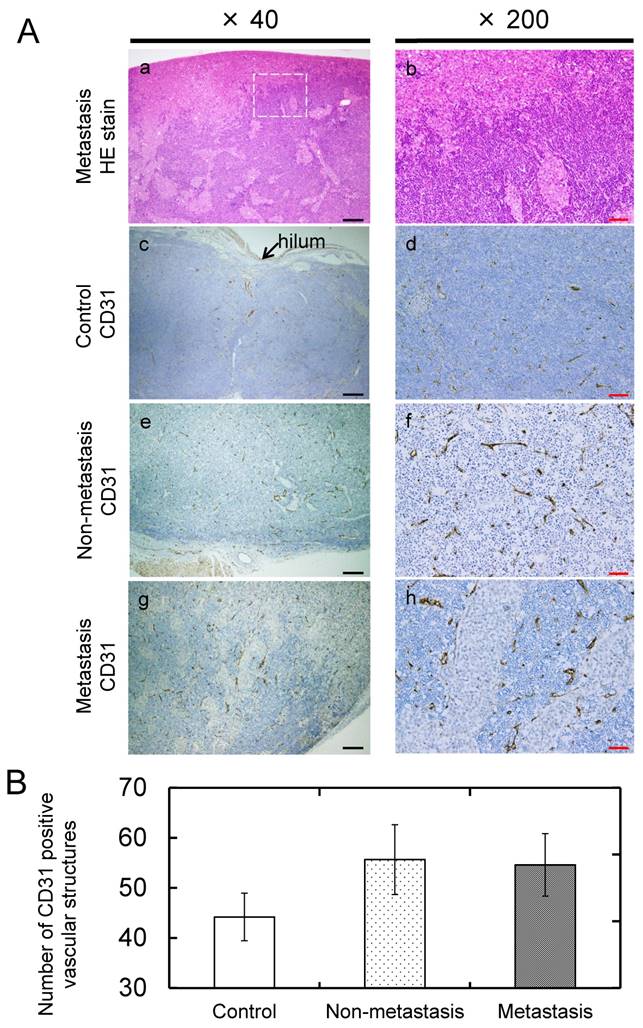
Histopathological analysis was carried out and the presence of tumor cells was verified in H&E-stained sections taken from the metastasis group. In sections taken from the metastasis group, tumor cells were predominantly found around the marginal sinus and revealed infiltrative growth into the parenchyma of the lymph node (Fig. 5Aa, b). Tumor cells were not evident in H&E-stained sections from the non-metastasis and control groups. CD31-immunostained sections from the control and non-metastasis groups revealed that CD31-positive vasculature structures were distributed uniformly in the lymph node parenchyma and that most of these were collapsed microvessels (Fig. 5Ac-f). In CD31-immunostained sections taken from the metastasis group, CD31-positive vascular structures were more prominent in peritumoral than in intratumoral areas (Fig. 5Ag, h). There was a trend towards a higher microvessel density (number of CD31-positive vascular structures in vascular-rich areas) in the metastasis and non-metastasis groups compared to the control group, although statistical significance was not reached (Fig. 5B).
Histopathological analysis (Aa) Representative H&E-stained sections for the metastasis group. (Ab) Higher-magnification view of the region highlighted in panel Aa (white dotted square). Tumor cells were predominantly located around the edge of the lymph node and exhibited infiltrative growth into the node. Representative CD31-immunostained sections from the control (Ac, d), non-metastasis (Ae, f) and metastasis (Ag, h) groups are also presented. In the C31-immunostained sections from the non-metastasis and control groups, CD31-positive vasculature was distributed over the entire lesion. In the metastasis group, CD31-positive vascular structures were predominantly located in peritumoral areas. (B) Quantification of blood vessel density in the PALN. The number of CD31-positive vascular structures in the metastasis and non-metastasis groups showed a trend towards being higher than that in the control group. Black and red bars represent 200 μm and 50 μm, respectively.
Discussion
To our knowledge, this is the first study using CE-HFUS to monitor and compare blood vessel densities and volumes between early-stage metastatic lymph nodes and tumor-draining lymph nodes that do not contain metastatic cancer cells. The experiments were designed to assess whether a single cross-sectional evaluation of lymph node volume or/and blood vessel density could be used to identify early-stage metastasis or whether a longitudinal analysis (with repeated measurements over time) would be needed. The present study investigated the correlation between PALN volume and luciferase-labeled tumor growth in the PALN. Figures 1B and 4B show that the development of tumor cells in the PALN did not lead to an increase in the volume of the PALN in the metastasis group. When the sonographic images obtained on day 0 were compared with those obtained on day 22 (Fig. 3A), the PALNs of MXH10/Mo/lpr mice in all 3 groups showed no obvious alterations in either the distribution of the vessel extraction image (CE-HFUS) or the morphological characteristics. In addition, the mean value of the blood vessel density of the PALN on day 22 did not differ significantly between any of the groups. These results indicate that in this experimental model, a single cross-sectional evaluation using CE or grayscale HFUS is unable to detect a tumor-positive PALN. However, the blood vessel density of the PALN in the metastasis group showed a progressive rise and a trend towards being higher than those in the non-metastasis and control groups. CE-US with Sonazoid has advantages that include relatively low cost and low toxicity [35]. Therefore, longitudinal imaging of regional lymph nodes using CE-HFUS could be practical in the clinical setting and helpful in the detection of early-stage metastatic lymph nodes.
Blood vessel density values obtained in all groups on day 0 varied from 14.9% to 56.1%, indicating that there were marked individual differences in blood flow through the PALN as measured by CE-HFUS. In subgroup analyses conducted in mice in which the initial blood vessel densities of the PALNs were low (blood vessel density < 35% on day 0), the normalized blood vessel density of the PALN in the metastasis group progressively increased and on day 22 was approximately double that in the control group (which, in contrast, demonstrated little change throughout the entire experimental period) (Fig. 3Bb). This finding suggests that longitudinal analysis of regional lymph nodes using CE-HFUS might be a more reliable method of predicting the development of lymph node metastasis in patients with lymph nodes with a physiologically poor vasculature. The cutoff point selected in the present study was based on the mean value of the blood vessel density of the PALN in all groups on day 0. To determine the optimal cutoff value for blood vessel density at the initial measurement, it may be helpful to select patients for whom longitudinal CE-US imaging proves to be a reliable modality for diagnosing early-stage lymph node metastasis. However, the sample size was too small to allow determination of the optimal cutoff value to be made in mice.
In the present study, both the density and volume of the blood vessels of the PALN were monitored to determine which strategy would be more reliable for detecting early-stage alterations in blood flow through a metastatic lymph node. Figures 4C and 4D show that the normalized blood vessel volume of the PALN increased between days 15 and 22 in the metastasis and non-metastasis groups but did not exhibit a major change in the control group. However, when compared with evaluations of normalized blood vessel density, the differences between groups in normalized blood vessel volume on day 22 were relatively smaller and there were no notable differences between the metastasis and non-metastasis groups over the entire experimental period (Figs 3Ba, 3Bb, 4C and 4D). It was not possible to determine which method (normalized blood vessel volume or density) reflected the actual change in blood flow through the PALN more accurately. Nonetheless, it was evident that a longitudinal analysis of blood vessel density was a more useful strategy for identifying early-stage lymph node metastasis.
A heterogeneous pattern of contrast enhancement on CE-US and non-hilar blood flow on color Doppler US has been observed in histologically proven metastatic lymph nodes in various types of carcinoma [20, 22, 36-38]. These characteristic imaging findings are thought to result from tumor-induced alterations of preexisting vascular structures; however, a detailed assessment of the vasculature in metastatic lymph nodes has not been carried out. In addition, there has been little research concerning angiogenesis in metastatic lymph nodes, but Jeong and colleagues reported that sprouting angiogenesis was not detected during the early process of metastasis to a lymph node [39, 40]. Previous pathological analysis has indicated that most blood vessels observed in normal lymph nodes are microvessels [41], and this finding is consistent with the immunohistochemically-stained sections obtained in our controls (Fig. 5A). In the present study, the numbers of microvessels in hot-spots (microvessel density) were analyzed to evaluate structural alterations in the vasculature of the PALN in each group. There were no significant differences in microvessel density between any of the groups (Fig. 5B). Furthermore, there were no significant differences in microvessel density between groups in a subgroup analysis of mice in which the PALN had an initially low blood vessel density (< 35% on day 0; data not shown). However, it should be noted that the microvessel and blood vessel densities of the PALN in the metastasis and non-metastasis groups showed a trend towards being higher than those in the control group. The results suggest that the vascular structures in the PALN are influenced not only by tumor in the PALN but also by tumor in the SiLN. However, the detailed mechanisms underlying these changes have not yet been fully elucidated.
The most unique feature of this study is that a comparison was made between the metastasis and non-metastasis groups, but the factors differing between these groups remain unclear. An increase in the blood vessel density of the PALN in the non-metastasis group was observed between days 15 and 22 (Fig. 3B). It was not possible to determine whether mice in the non-metastasis group would eventually develop metastasis to the PALN over a longer experimental time period. Extension of the observation period will resolve this question. If PALNs in the non-metastasis group are in a premetastatic state, a CE-HFUS measured increase in blood vessel density might be a predictor of the subsequent development of lymph node metastasis.
Although Fig. 1B appears to show that the bioluminescence signal intensity from the PALN in the non-metastasis group exhibited a small progressive rise compared with the control, it should be emphasized that the size of the increase for the non-metastasis group (approximately 4-fold change) was around 100 times smaller than that seen for the metastasis group (approximately 400-fold change). Furthermore, this apparent increase in the non-metastasis group was not statistically significant. Since the bioluminescence signal intensity in the SiLN (which contained luciferase-labeled tumor) increased in both the non-metastasis and metastasis groups, it is likely that the small apparent increase in the bioluminescence signal from the PALN in the non-metastasis group was due to an increase in background fluorescence caused by the enhanced bioluminescence of the SiLN. We believe that the apparent increase in the bioluminescence signal from the PALN in the non-metastasis group was not caused by the presence of luciferase-labeled breast cancer cells because histopathological analysis confirmed the absence of these cells in the PALNs of mice in the non-metastasis group.
There is a limitation of the present study. The experimental model of lymph node metastasis we used represents metastasis from a tumor-positive lymph node to a draining lymph node. For this reason, the results obtained in the present study may not be exactly applicable to the situation where there is metastasis to a sentinel lymph node from a primary site.
In conclusion, monitoring the blood vessel density of a lymph node by CE-HFUS is a potentially promising technique to diagnose early-stage lymph node metastasis in selected patients. However, further research is needed to define the mechanisms underlying the time-dependent changes in blood vessel density in a tumor-positive lymph node or a tumor-draining lymph node that has not acquired tumor. Expansion of the experimental time period and detailed investigation of the interrelationship between alterations in the blood vessel density of a tumor-draining lymph node and the vascular structures within the lymph node is required.
Abbreviations
CE-HFUS: contrast-enhanced high-frequency ultrasound; CE-US: contrast-enhanced ultrasound; HE: hematoxylin and eosin; HFUS: high-frequency ultrasound; MRL/lpr: MRL/MpJ-lpr/lpr mouse strain; MXH10/Mo/lpr: MXH10/Mo-lpr/lpr mouse strain; PALN: proper axillary lymph node; SiLN: subiliac lymph node; US: ultrasound.
Acknowledgements
The study was supported in part by JSPS KAKENHI Grant Numbers 26293425 (SM), 26670856 (SM), 25293382 (MS), 24659834 (MS), 26242051 (TK) and 24650286 (TK). This study was also partly supported by Iwate Prefecture's subsidiary aid for innovative medical equipment development project.
Competing Interests
The authors have declared that no competing interest exists.
References
1. Ran S, Volk L, Hall K, Flister MJ. Lymphangiogenesis and lymphatic metastasis in breast cancer. Pathophysiology. 2010;17:229-51
2. Swartz MA. The physiology of the lymphatic system. Adv Drug Deliv Rev. 2001;50:3-20
3. Jatoi I, Hilsenbeck SG, Clark GM, Osborne CK. Significance of axillary lymph node metastasis in primary breast cancer. J Clin Oncol. 1999;17:2334-40
4. Kiriyama M, Ebata T, Aoba T, Kaneoka Y, Arai T, Shimizu Y. et al. Prognostic impact of lymph node metastasis in distal cholangiocarcinoma. Br J Surg. 2015;102:399-406
5. Xu XL, Zheng WH, Zhu SM, Zhao A, Mao WM. The Prognostic Impact of Lymph Node Involvement in Large Scale Operable Node-Positive Esophageal Squamous Cell Carcinoma Patients: A 10-Year Experience. PloS one. 2015;10:e0133076
6. Swartz MA, Lund AW. Lymphatic and interstitial flow in the tumour microenvironment: linking mechanobiology with immunity. Nat Rev Cancer. 2012;12:210-9
7. Futamura M, Asano T, Kobayashi K, Morimitsu K, Nawa M, Kanematsu M. et al. Prediction of macrometastasis in axillary lymph nodes of patients with invasive breast cancer and the utility of the SUV lymph node/tumor ratio using FDG-PET/CT. World J Surg Oncol. 2015;13:014-0424
8. Blum A, Schlagenhauff B, Stroebel W, Breuninger H, Rassner G, Garbe C. Ultrasound examination of regional lymph nodes significantly improves early detection of locoregional metastases during the follow-up of patients with cutaneous melanoma: results of a prospective study of 1288 patients. Cancer. 2000;88:2534-9
9. Li L, Mori S, Kodama M, Sakamoto M, Takahashi S, Kodama T. Enhanced sonographic imaging to diagnose lymph node metastasis: importance of blood vessel volume and density. Cancer Res. 2013;73:2082-92
10. Ganeshalingam S, Koh DM. Nodal staging. Cancer Imaging. 2009;9:104-11
11. Ying M, Bhatia KS, Lee YP, Yuen HY, Ahuja AT. Review of ultrasonography of malignant neck nodes: greyscale, Doppler, contrast enhancement and elastography. Cancer Imaging. 2014;13:658-69
12. Ahuja AT, Ying M. Sonographic evaluation of cervical lymph nodes. AJR Am J Roentgenol. 2005;184:1691-9
13. Alvarez S, Anorbe E, Alcorta P, Lopez F, Alonso I, Cortes J. Role of sonography in the diagnosis of axillary lymph node metastases in breast cancer: a systematic review. AJR Am J Roentgenol. 2006;186:1342-8
14. Cui XW, Jenssen C, Saftoiu A, Ignee A, Dietrich CF. New ultrasound techniques for lymph node evaluation. World J Gastroenterol. 2013;19:4850-60
15. Saini R, Hoyt K. Recent developments in dynamic contrast-enhanced ultrasound imaging of tumor angiogenesis. Imaging Med. 2014;6:41-52
16. Na DG, Lim HK, Byun HS, Kim HD, Ko YH, Baek JH. Differential diagnosis of cervical lymphadenopathy: usefulness of color Doppler sonography. AJR Am J Roentgenol. 1997;168:1311-6
17. Ecanow JS, Abe H, Newstead GM, Ecanow DB, Jeske JM. Axillary staging of breast cancer: what the radiologist should know. Radiographics. 2013;33:1589-612
18. Eisenbrey JR, Forsberg F. Contrast-enhanced ultrasound for molecular imaging of angiogenesis. Eur J Nucl Med Mol Imaging. 2010;37:010-1449
19. Greis C. Ultrasound contrast agents as markers of vascularity and microcirculation. Clin Hemorheol Microcirc. 2009;43:1-9
20. Dudau C, Hameed S, Gibson D, Muthu S, Sandison A, Eckersley RJ. et al. Can contrast-enhanced ultrasound distinguish malignant from reactive lymph nodes in patients with head and neck cancers? Ultrasound Med Biol. 2014;40:747-54
21. Xiang D, Hong Y, Zhang B, Huang P, Li G, Wang P. et al. Contrast-enhanced ultrasound (CEUS) facilitated US in detecting lateral neck lymph node metastasis of thyroid cancer patients: diagnosis value and enhancement patterns of malignant lymph nodes. Eur Radiol. 2014;24:2513-9
22. Rubaltelli L, Khadivi Y, Tregnaghi A, Stramare R, Ferro F, Borsato S. et al. Evaluation of lymph node perfusion using continuous mode harmonic ultrasonography with a second-generation contrast agent. J Ultrasound Med. 2004;23:829-36
23. Andrews BS, Eisenberg RA, Theofilopoulos AN, Izui S, Wilson CB, McConahey PJ. et al. Spontaneous murine lupus-like syndromes. Clinical and immunopathological manifestations in several strains. J Exp Med. 1978;148:1198-215
24. Li L, Mori S, Sakamoto M, Takahashi S, Kodama T. Mouse model of lymph node metastasis via afferent lymphatic vessels for development of imaging modalities. PloS one. 2013;8:e55797
25. Yamada A, Miyazaki T, Lu LM, Ono M, Ito MR, Terada M. et al. Genetic basis of tissue specificity of vasculitis in MRL/lpr mice. Arthritis Rheum. 2003;48:1445-51
26. Zielonka TM, Demkow U, Zycinska K, Filewska M, Korzeniewska M, Radzikowska E. et al. Angiogenic activity of sera from patients with systemic autoimmune diseases in relation to clinical, radiological, and functional pulmonary status. J Physiol Pharmacol. 2008;6:791-800
27. Tammela T, Alitalo K. Lymphangiogenesis: Molecular mechanisms and future promise. Cell. 2010;140:460-76
28. Ji RC. Lymph node lymphangiogenesis: a new concept for modulating tumor metastasis and inflammatory process. Histol Histopathol. 2009;24:377-84
29. Sato T, Mori S, Arai Y, Kodama T. The combination of intralymphatic chemotherapy with ultrasound and nano-/microbubbles is efficient in the treatment of experimental tumors in mouse lymph nodes. Ultrasound Med Biol. 2014;40:1237-49
30. Shao L, Mori S, Yagishita Y, Okuno T, Hatakeyama Y, Sato T. et al. Lymphatic mapping of mice with systemic lymphoproliferative disorder: usefulness as an inter-lymph node metastasis model of cancer. J Immunol Methods. 2013;389:69-78
31. Sato T, Mori S, Sakamoto M, Arai Y, Kodama T. Direct delivery of a cytotoxic anticancer agent into the metastatic lymph node using nano/microbubbles and ultrasound. PloS one. 2015;10:e0123619
32. Sontum PC. Physicochemical characteristics of Sonazoid, a new contrast agent for ultrasound imaging. Ultrasound Med Biol. 2008;34:824-33
33. Braide M, Rasmussen H, Albrektsson A, Bagge U. Microvascular behavior and effects of sonazoid microbubbles in the cremaster muscle of rats after local administration. J Ultrasound Med. 2006;25:883-90
34. de Jong JS, van Diest PJ, Baak JP. Hot spot microvessel density and the mitotic activity index are strong additional prognostic indicators in invasive breast cancer. Histopathology. 2000;36:306-12
35. Miyamoto Y, Ito T, Takada E, Omoto K, Hirai T, Moriyasu F. Efficacy of sonazoid (perflubutane) for contrast-enhanced ultrasound in the differentiation of focal breast lesions: phase 3 multicenter clinical trial. AJR Am J Roentgenol. 2014;202:10518
36. Rubaltelli L, Beltrame V, Tregnaghi A, Scagliori E, Frigo AC, Stramare R. Contrast-enhanced ultrasound for characterizing lymph nodes with focal cortical thickening in patients with cutaneous melanoma. AJR Am J Roentgenol. 2011:196
37. Zhao H, Xu R, Ouyang Q, Chen L, Dong B, Huihua Y. Contrast-enhanced ultrasound is helpful in the differentiation of malignant and benign breast lesions. Eur J Radiol. 2010;73:288-93
38. Moritz JD, Ludwig A, Oestmann JW. Contrast-enhanced color Doppler sonography for evaluation of enlarged cervical lymph nodes in head and neck tumors. AJR Am J Roentgenol. 2000;174:1279-84
39. Guidi AJ, Berry DA, Broadwater G, Perloff M, Norton L, Barcos MP. et al. Association of angiogenesis in lymph node metastases with outcome of breast cancer. J Natl Cancer Inst. 2000;92:486-92
40. Jeong HS, Jones D, Liao S, Wattson DA, Cui CH, Duda DG. et al. Investigation of the Lack of Angiogenesis in the Formation of Lymph Node Metastases. J Natl Cancer Inst. 2015:107
41. Tschammler A, Heuser B, Ott G, Schmitt S, Hahn D. Pathological angioarchitecture in lymph nodes: underlying histopathologic findings. Ultrasound Med Biol. 2000;26:1089-97
Author contact
![]() Corresponding author
Corresponding author