Impact Factor ISSN: 1837-9664

 Global reach, higher impact
J Cancer 2017; 8(2):207-219. doi:10.7150/jca.16415 This issue Cite
Research Paper
Interferon Regulatory Factor 7 Promoted Glioblastoma Progression and Stemness by Modulating IL-6 Expression in Microglia
Zongze Li1*, Qiming Huang2*, Heping Chen3, Zhiqin Lin1, Meng Zhao1, Zhongli Jiang1 ![]()
1. Department of Neurosurgery, Beijing Tiantan Hospital, Capital Medical University, No. 6 Tiantan Xili, Dong Cheng District, Beijing, 100050, China.
2. Beijing Neurosurgical Institute, No. 6 Tiantan Xili, Dong Cheng District, Beijing, 100050, China.
3. School of Medicine, University of Arizona, Tucson, AZ 85724, USA.
* These authors contributed equally to this study and share first authorship.
Received 2016-6-8; Accepted 2016-9-23; Published 2017-1-13
Abstract
Background: Interferon Regulatory Factor 7 (IRF7) is associated with chronic inflammation initiated by the activation of microglia. However it remains poorly defined how IRF7 activates microglia to initiate inflammatory microenvironment, and thus promotes the growth and malignancy of glioblastoma multiforme (GBM). This study investigated the role of IRF7 expression in microglia which increases GBM progression.
Methods: We established stable human microglia (HMs) over-expressing IRF-7 or empty vector by lentiviral transduction and stable selection. These HM-IRF-7 cells were co-cultured with U87-MG to examine their influence on GBM, in terms of cell proliferation, apoptosis and stemness of U87-MG. By qRT-PCR and ELISA assays, the expression of key genes and secretion of inflammatory factors were identified in inflammatory signal pathway respectively. We also analyzed whether the expression of IRF7 and its target gene IL-6 correlated with PFS (progression-free survival) and OS (overall survival) in clinical samples by Kaplan-Meier survival curves.
Results: HMs can be engineered to stably express high level of IFR7 with IRF7 lentivirus, and was found to promote U87-MG growth and inhibit its apoptosis in co-culture. Meanwhile, U87-MG seemed to show stem cell character with ALDH1 expression. These results may be related to IRF7 initiating IL-6 expression and secretion in both HM and U87-MG cells. The IRF7 and IL-6 were highly expressed in GBM tissues, and IL-6 secretion was high in GBM serums, both of which were significantly correlated with PFS and OS.
Conclusions: The immune function of HMs was changed while it expressed IRF7 genes. The results demonstrated for the first time that IRF7 of microglia promoted GBM growth and stemness by mediating IL-6 expression, and revealed that IRF-7 and IL-6 were independent factors affecting the overall survival probability.
Keywords: Interferon Regulatory Factor 7, IL-6, Microglia
Introduction
Patients suffering from glioblastoma multiforme (GBM), the highest grade glioma, have an average survival time of only around one year after diagnosis [1]. The inflammatory microenvironment plays a pivotal role of initiate GBM development in vivo, wherein microglia is involved in the chronic inflammation of malignant gliomas expansion [2]. Microglia are myeloid cells residing in the central nervous system that participate in inflammatory responses and could promote the pathogenesis of neuroinflammatory diseases [3]. Both brain-resident microglia and peripheral macrophages/monocytes accumulate within and around glioma, but fail to exert effective anti-tumor activity and even support tumor growth [4]. The etiology of microglia is unclear. Although microglia can retain intrinsic anti-tumor properties in brain, glioma microenvironment may convert the glioma-associated microglia into glioma-supportive, immunosuppressive cells [5].
The endogenous microenvironment of the brain is an essential watchdog to guard over microglia polarization during diseases. Microglia polarization is divided into classical inflammatory (M1) activation and alternative (M2) activation [6]. Limiting inflammatory reactions of activated microglia and blood-derived monocytes is a key prerequisite for the resolution of tissue insults [7]. However, it was found that monocytes but not microglia are able to shift to an anti-inflammatory state during inflammation. The reason was that transforming growth factor-β1 (TGFβ1) prevents activated microglia to switch to an anti-inflammatory state by regulating the expression of IRF7 [8]. Gliomas can attract microglia and polarize them into tumor-supporting cells (M2) that participate in matrix remodeling, invasion, angiogenesis, and suppression of adaptive immunity [9]. But a recent research found that IRF7 expression increased during the M2-like to M1-like switch in microglia, moreover M2-like microglia exhibited greater phagocytic capacity than M1-like microglia [10]. Therefore it needs further study whether the mechanism of gliomas directing microglia toward the immunosuppressive phenotype was regulated by inducing microglia to express IRF7.
IRF7 is the master transcription factor that plays a pivotal role in the transcriptional activation of type I interferon genes in tumor progression via the expression of inflammatory cytokines in glioma [11]. IRF7 promotes glioma cell invasion and both chemo- and radio-resistance through diminishing argonaute 2 (AGO2) expression [12]. Additionally IRF7-driven IL-6 confers cancer stemness to glioma cells through JAK-STAT-mediated activation of Jagged-Notch signaling [13]. As a primary mediator of the inflammatory response, IL-6 is very important in the pathogenesis of many cancer. The increased IL-6 levels in gliomas are associated with the grade of malignancy and contribute to the maintenance of tumor heterogeneity [14]. The upregulation of CCL2 and CXCL1 is also involved in glioma stem cells (GSC) maintenance through recruitment of microglia, which further promotes the pro-tumorigenic inflammatory microenvironment [13]. By DNA microarray analysis to compare the expression profiles of glioma-associated microglia and naive control cells of GL261-implanted C57BL/6 mouse brains, some important genes were identified and validated to be associated with poor prognosis in human GBM, such as transcription factor IRF7 and M2 marker IL-6 [15]. Meanwhile, in the microglia genomic profiling of pediatric astrocytomas, it was also revealed that immune response-related genes most strongly associated with survival in adult GBM, including IRF7 and IL-6 [16]. These studies indicated that the IRF7 expression driven microglia polarization may participate in GBM malignancy and stemness by in an inflammatory model of IL6-STAT signaling.
In this study, we first verified the IL-6 generation after ectopic IRF7 overexpression in human microglia, which promoted GBM proliferation and inhibited its apoptosis in co-culture, while conferring U87-MG stem cell-like character with ALDH1 expression. The IRF7 and IL-6 genes were highly expressed in GBM tissues, and IL-6 secretion was also high in GBM serums, both of which were significantly correlated with PFS and OS. These findings reveal novel biochemical properties of the IRF7 in HM and suggest the possibility that GBM malignancy control via the function of HM is involved in the development of IL-6-STAT3 signaling.
Materials and Methods
Cell culturing
Human microglia (HM) and human GBM cell line U87-MG was purchased from Sciencell and the American Type Culture Collection respectively. Both HM and U87-MG were maintained in Dulbecco's modified Eagle's medium (DMEM, high glucose) (Gibco) supplemented with 10% fetal bovine serum (Gibco), 100 mg/mL penicillin and 100 mg/mL streptomycin (Gibco).
Preparation of IRF7 plasmids
To construct the IRF7 expression vector, the fragments encompassing the IRF7 sequence were synthetized chemically, and then cloned into the BamHI and AgeI sites in lentiviral vector (GV358) (Genechem, Shanghai). Plasmid DNA was transformed in MAX Efficiency® DH5a™ Competent Cells (Invitrogen, Mount Waverley, Victoria, Australia) as described by the manufacturer. Positive colonies were further cultured for plasmid amplification and purification using the Wizard® Plus Midiprep DNA Purification System (Promega Corporation) as per manufacturer's instructions. Purified plasmid DNA was verified for the presence of IRF7 insert by restriction digest with BamHI/AgeI. All constructs were further confirmed by DNA sequencing analysis.
293T cells were cultured at 10cm culture dishes for 24h, before the cells were co-transfected with GV358-IRF7 DNA (20μg), pHelper 1.0 (15μg), and pHelper 2.0 (15μg) using Lipofectamine 2000 in 1ml volume for 6hr (Invitrogen). After co-transfection for 6hr, the transfected supernatants were removed, and the dished were washed once by using 10ml 1×PBS, and added new cell medium. The culture supernatants were collected after the 293T cells cultured for 48hr and used as virus stock after concentration. Viral titer was determined by HIV-1 P24 Antigen ELISA (ZeptoMetrix Corporation) after infection.
Transduction and IRF-7 Over-expression
HMs were seeded at 2 × 10⁵ cells per well in 6 well-plates on coverslips. After 12hr incubation, HMs were infected with MOI=1, 10 and 100 GV358-IRF7 or GV358 empty lentiviral particles using polybrene (8 mg/ml) (Sigma-Aldrich) in 2ml volume. After 12 hours incubation at 37℃, medium was replaced with fresh medium to exclude polybrene. Stably transfected cells (IRF7 overexpression or control) were selected using ampromycin (100ug/ml, Invitrogen) for 4 days. The IRF7 overexpression positive cells were identified by qRT-PCR and western blotting analysis.
Co-culture of HMs and U87-MG
Six-well plate transwell cultures with a 0.4μM membrane pore size (Corning, Costar, Cambridge, MA, USA) were used to co-culturing HM with U87-MG in high-glucose DMEM supplemented with 10% fetal bovine serum, 100 mg/mL penicillin and 100 mg/mL streptomycin. U87-MG at a concentration of 1 × 10⁵ cells/ml was co-cultured with 1 × 10⁵ cells/ml HMs at 2ml volume for 12 days, wherein the HMs in the inner chamber of the well and the U87-MG in the outer chamber. After 3 and 12 days, the HMs were detected by using flow cytometry analysis and quantitative RT-PCR. Three replicates with HMs were performed, i.e. non-transfected (HMs), empty vector transfected HMs (BLANK-HMs) and IRF7 transfected HMs (IRF7-HMs).
Cell proliferation assay
For cell proliferation, U87-MG cells and HMs were harvested by trypsin digestion and counted using a haemocytometer at 3rd, 6th, 9th and 12th after co-culture.
Cell apoptosis detection
The apoptotic ratios of cells were determined with the Annexin V-FITC and Propidium Iodide (PI) apoptosis detection kit (Sigma). Briefly, after 72 hours leflunomide treatment, the cells were collected and washed twice with cold PBS buffer, suspended in 195μl of binding buffer, incubated with 5μl of Annexin V-FITC and 10μl PI staining solution for 15 min at room temperature, and analyzed by flow cytometry (FACSAria II, BD company). Cells treated with DMSO were used as the negative control.
Gene expression assay by quantitative RT-PCR
Total RNA was isolated from treated cells and used for cDNA synthesis by PrimeScript Ⅱ 1st strand cDNA Synthesis Kit (TaKaRa, Dalian, China) according to the manufacturer's instructions. The cDNA was then used for quantitative RT-PCR in a volume of 20μl containing 10μl GoTaq® qPCR Master Mix (Promega, Madison, WI) and 0.2μm each primer set of the target genes. The quantitative RT-PCR was performed on ABI7500 Detection System (Applied Biosystems, U.S.A), with 40 cycles of 95℃ for 2min, 55℃ for 30sec, 72℃ for 30sec. A dissociation stage was performed at the end of the reaction consisting of 200 cycles of 7sec with temperature increased at 0.2℃/cycle to show the specificity of the amplification. Expression analysis was performed in triplicate for each sample. The housekeeping GADPH was used as the normalization control. The fold difference for each sample was obtained using the equation 2-dCt, where Ct is the threshold cycle (the cycle number at which the fluorescence generated within a reaction crosses the threshold) and dCt equals the mean Ct of the sample gene minus the mean Ct of GAPDH.
Primers used for quantitative RT-PCR are listed.
| Genes | Primer Sequence | Direction | Expected Size |
|---|---|---|---|
| IRF7 | 5'- TGGTCCTGGTGAAGCTGGAA-3' | Forward | 134 bp |
| 5'-GATGTCGTCATAGAGGCTGTTGG-3' | Reverse | ||
| STAT3 | 5'-TAAAACCCTCAAGAGTCAAGG-3' | Forward | 132 bp |
| 5'-TCACTCACGATGCTTCTCCGC-3' | Reverse | ||
| IL-6 | 5'-AGACAGCCACTCACCTCTTCA-3' | Forward | 125 bp |
| 5'-AGTGCCTCTTTGCTGCTTTC-3' | Reverse | ||
| GAPDH | 5'-TGACTTCAACAGCGACACCCA-3' | Forward | 121 bp |
| 5'-CACCCTGTTGCTGTAGCCAAA-3' | Reverse |
Protein expression assay by Western blot
Cell lysates prepared in Phosphosafe Extraction Buffer at equal protein concentration were mixed with electrophoresis SDS sample buffer and separated on 12% SDS PAGE Tris-Glycine gels. Proteins were transferred to PVDF membranes and blocked with 4% skim milk solution in PBST before immunoblotting for total proteins. For detection of total IRF7, membranes were probed with polyclonal antisera (1:1500) against IRF7. Secondary antiserum was rabbit-HRP at 1:5,000 dilution. Expression of GAPDH was determined using antisera at 1:5000 and 1:3000 respectively for protein loading controls where necessary.
IL-6 secretion by enzyme linked immunosorbent assay
IL-6 was measured at the end of opium exposure period in the supernatant of culture media and the sera of GBM patients by enzyme-linked immunosorbent assay (ELISA) technique as instructed by kit manufacturer (Biolegend). The detection was implemented by iMark™ Microplate Absorbance Reader (Bio-Rad), and data were acquired from three repetitions for each concentration.
Bioinformatics analyses of clinical data
The clinical GBM specimens were used to detect IRF7 and IL-6 genes expression by qRT-PCR. All patients provided written informed consent for the current study and the clinical study was approved by the Medical Ethics Committee of Capital Medical University. The Chi-squared test or Fisher exact test was also used to determine correlations between clinical characteristics, survival and gene expression in glioma specimens. In these data, the term 'all gliomas' indicates all specimens that were used to analyze patient survival. The 'High expression group ≥2.0× consisted of patients with gene expression ≥2-fold higher than mean values in normal tissue, whereas 'intermediate expression group' consisted of those with gene expression between that of 'high expression group ≥2.0× and 'low expression group ≤2.0×.
Statistical analyses
Data were presented as the means ± SD from three separate experiments. The differences between groups were analyzed using Student's t test when only two groups were compared or a one-way analysis of variance (ANOVA) when more than two groups were compared. The differences between groups of metastasis in vivo were analyzed using Chi-squared test (χ2 test). All of the statistical analyses were performed with SPSS software (version 16.0; SPSS Inc., Chicago, IL, USA). The difference was considered to be statistically significant at P <0.05.
Results
Establishment of stable HM-IRF-7 and HM-vector cells
Human IRF-7 gene (full length) was inserted to lentiviral expression vector (pLv_GV358) to create pLv_GV358-IRF-7 and positive clones were amplified as described in materials and methods. For lentivirus production, 293T was co-transfected with pLv_GV358-IRF-7 (or pLv_GV385 as control) together with helper plasmid DNA (refer to MM). The target lentivirus was collected and purified from above culture medium. The purified lentivirus (pLv_GV358-IRF-7 or pLv_GV358) was used to transduce HM cells, which were subsequently drug-selected and established as stable cell lines designated as HM/GV358-IRF-7 or HM/GV358. Initially, we tested the lentiviral transduction at three different MOI (1, 10, and 100). We observed that the transduction of HM by pLv_GV385-IRF-7 at MOI 100 gave high transduction efficiency but also showed notably decreased cell survival, as compared to HM cells transduced at lower MOI (1 and 10) (Fig. 1 A, B, C, D). Thus, we used lentivirus at MOI 10 as optimal dose to transduce and establish stable cell lines. The stable cell line, HM/pLv_GV358-IRF7 was confirmed to over-express IRF-7 (58 kDa, full length) by Western blot. (Figure 1E), as compared to parental HM or HM/pLv_GV358 stable cells.
The human microglia were analyzed by fluorescence microscope, qRT-PCR and western blotting after transfecting with IRF-7 lentiviruses. A-C: The IRF-7 lentiviruses transduced HMs (HMs-GV358-IRF7) was observed green fluorescence by fluorescence microscope at different MOI. D: We selected the optimal MOI to use for transduction of HMs by IRF7 expression and the survival ratio of HMs-GV358-IRF7. E: The HMs-GV358-IRF7 was confirmed to express IRF-7 protein by western blotting (IRF-7 molecular weight 58kDa).
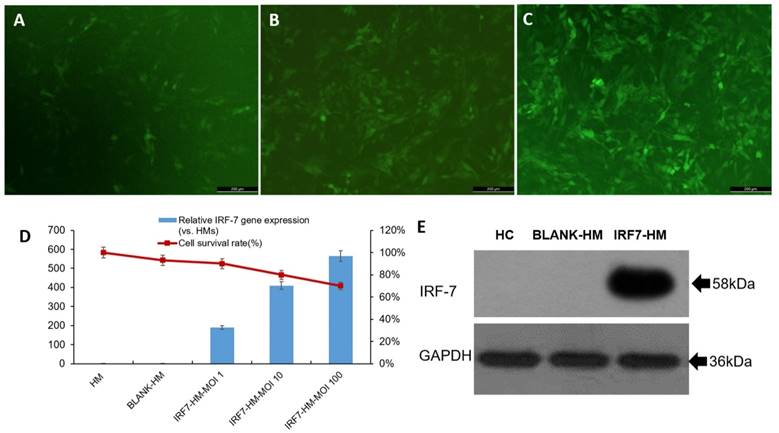
The IRF7 expression of IRF7 lentiviruses transfected HMs (IRF7-HMs) was significantly higher than HMs (Contr) and lentiviruses transfected HMs (BLANK-HMs) by qRT-PCR (**P=0.000 and 0.000 respectively) (Fig 1D). The IRF7 expression of IRF7-HMs gradually increased with the promotion of MOI value. But the survival ratio of IRF7-HMs gradually declined with the promotion of MOI value, so we selected the optimal MOI=10. The IRF7 lentiviruses transfected HMs expressed IRF7 protein by western blotting (IRF7 molecular weight 58kDa) (Fig 1E). We successfully constructed lentiviruses vector of IRF7 overexpression.
Influence of HM/IRF-7 on GBM (U87-MG) growth and survival in co-culture
We analyzed proliferation and apoptosis of U87-MG (a GBM cell line) upon co-culture with HMs. U87-MG cells grew well by itself (Figure 2A, no co-culture). When co-cultured with HM (2B) or HM/GV 358 (2C) for 6 days, however, U87-MG showed notable signs of cell death or apoptosis. When co-cultured with HM/GV358-IRF7, on the contrary, U87-MG showed little signs of cell death or apoptosis. The above results were determined by trypan blue staining of live/dead cells. We also examined proliferation of U87-MG under the same co-culture conditions, from Days 0-12 by cell count. As shown in Figure 2E, U87-MG considerably grew more in co-culture with HM/GV358-IRF7, than with HM/GV358 or HM (**P=0.012 and 0.015 respectively). These data indicated that IRF-7 over-expressed by HM/GV358-IRF7 enhanced U87-MG growth and survival.
U87-MG cells were analyzed its proliferation and apoptosis after co-culturing with HMs. A-D: U87-MG cells were observed under invert microscope, i.e. before co-culturing with HMs(A), at 6 days after co-culturing with HMs (HM-U87) (B), BLANK-HMs (HM-GV358/U87) (C)and IRF7-HMs (HM-GV358-IRF7/U87) (D) respectively. U87-MG cells emerged dying and apoptosis after co-culturing with HMs and HM-GV358. E: U87-MG were counted continuously and analyzed proliferative level (**P=0.012 and 0.015 respectively). F-H: U87-MG cells were detected its apoptosis level by annexin V-FITC and PI staining.
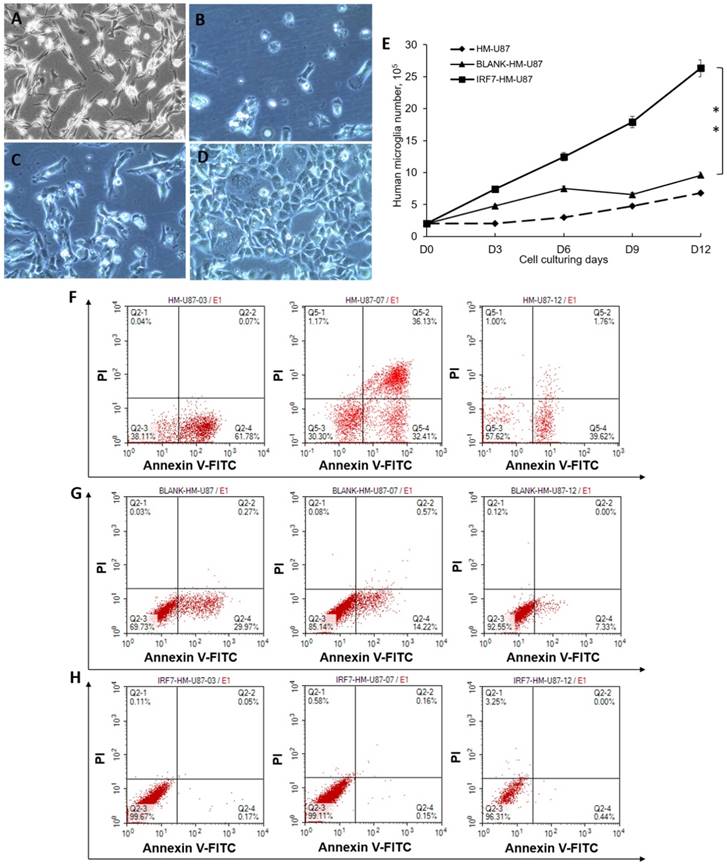
As a further confirmation, we assayed cell apoptosis by annexin V staining and FACS analysis. When co-cultured with HM, U87-MG displayed cell apoptosis with annexin V positive ratio of 61.78% at 3 days after co-culturing. The annexin V and PI positive ratio of U87-MG was 32.41% and 36.13% respectively at 6 days after co-culture, showing continuous apoptosis and cell death. However U87-MG displayed apoptosis with annexin V positive ratio of 39.62% (Fig 2F). When co-cultured with HM-GV358, U87-MG displayed cell apoptosis, with annexin V positive ratio of 29.97%, 14.22% and 7.33% respectively at 3, 6 and 12 days after co-culturing (Fig 2G). When co-cultured with HM-GV358-IRF7, on the other hand, U87-MG cells hardly displayed obvious apoptosis and cell death after co-culturing (Fig 2H), with annexin V positive ratio of 0.17%, 0.18%, and 0.44% respectively at 3, 6 and 12 days after co-culturing. Collectively, the data indicated that the IRF7 expression contributed to U87 growth and inhibited U87 apoptosis and cell death.
Phenotypic changes after co-culturing with IRF7-HMs
We investigated phenotypic changes of both HMs and U87-MG after co-culture. In culture by itself, the microglia (HM) expressed high percentage of CD1a (99.57%), but low percentage of CD11c (1.97%) and co-costimulatory molecules, such as CD83 (1.88%), CD86 and CD80 (2.96% and 2.66%, not showed) (Fig 3A). In co-culture with U87-MG, however, the microglia (HM) expressed moderately reduced percentage of CD1a (71.77%), but increased percentage of CD11c and CD83 (11.83% and 42.72% respectively) (Fig 3B). The changes may be related to activate immune functions of HMs which produced antigen presentation.
The phenotypes of human microglia and U87-MG were detected by flow cytometry at 6 days after co-culturing. A: The flow cytometry results were analyzed in microglia before co-culture. B: The phenotypic changes were acquired in microglia at 6 days after co-culture. C: The phenotype of stem cells were analyzed in U87-MG at 6 days after co-culturing with HMs. D-E: The phenotypic changes of stem cells were acquired in U87-MG at 6 days after co-culturing with HM-GV358 and HM-GV358-IRF7.
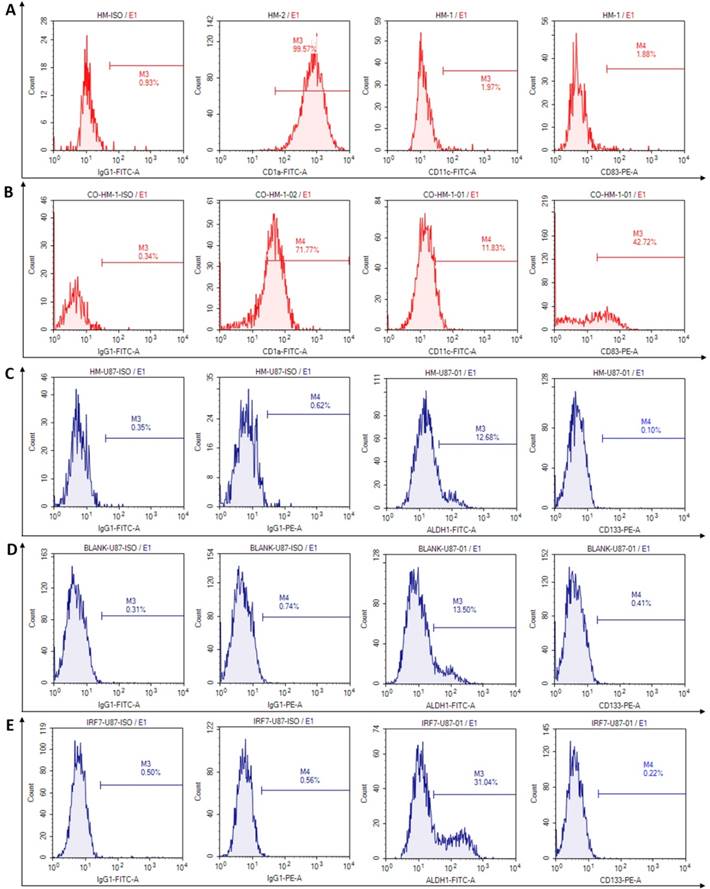
The stem cells phenotypes of U87-MG were next examined upon co-culture for 6 days, with HM, HM/GV358, and HM-GV358-IRF7. As shown in Fig. 3C-3F, U87-MG expressed glioma stem cell phenotype makers ALDH1 and CD133 in co-cultures with HMs as follow: a) 12.68% and 0.10% respectively with HM, b) 13.50% and 0.41% respectively with HM/GV358, and c) 31.04% and 0.22% respectively with HM-GV358-IRF7. As noted, the ALDH1 positive level of U87-MG was significantly higher by co-culture with HM-GV358-IRF7 than that with HMs and HM-GV358. On the other hand, the percentage of CD133 positive U87-MG remained similarly low in all three co-cultures. These results suggested that over-expression of IRF7 in HMs promoted stemness property of U87-MG.
IRF7-IL6 signaling mediating GBM malignancy between HMs and glioma cells
HM-GV358-IRF7 stable cells expressed high level of IRF7 mRMA by itself, but unexpectedly expressed even higher level of IRF7 (>2 folds, from 409.79 to 877.06, *P=0.011) when co-cultured with U87-MG for 6 days. In both cases, this is in sharp contrast to little or no IRF7 expression in parental HM or HM/GV358 vector stable cells, without or with co-culture (Fig 4A). Next, the signal transducers and activators of transcription 3 (STAT3) expression was examined under the same culture conditions. As shown (Fig. 4B), a) STAT3 mRNA expression was high in HM but remarkably dropped after co-culture (from 1.00 to 0.36, *P=0.033); b) STAT3 mRNA expression was low in both HM-GV358 and HM-GV358-IRF7 stable cells by themselves, but remarkably increased to a high level after co-culture with U87-MG.
The pivotal genes expression of HMs and U87-MG were analyzed by qRT-PCR detection. A-C: The IRF-7, STAT3 and IL-6 genes expression of HMs were detected before and at 6 days after co-culturing with U87-MG. D-F: The IRF-7, STAT3 and IL-6 genes expression of U87-MG were detected before and at 6 days after co-culturing with HMs, HM-GV358 and HM-GV358-IRF7.
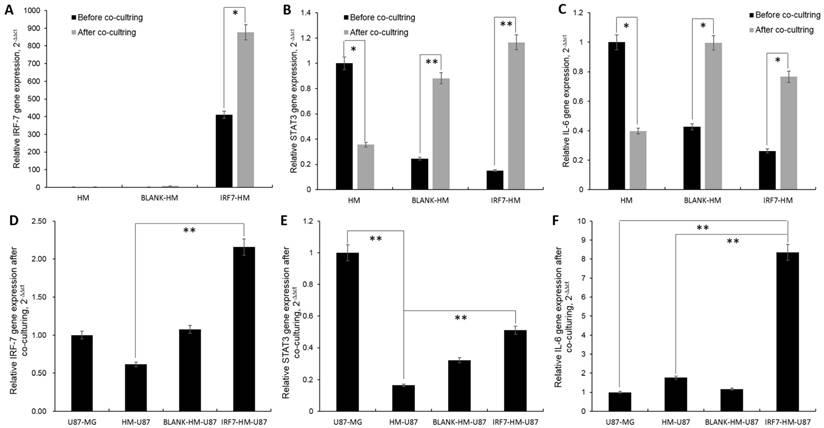
Lastly we assayed for IL-6 mRNA expression under the same conditions. As shown in Fig. 4C, a) IL6 mRNA expression was high in HM but notably dropped after co-culture; b) IL6 mRNA expression was low in both HM-GV358 and HM-GV358-IRF7 stable cells by themselves, but notably increased to a high level after co-culture with U87-MG. The data showed that GBM cells stimulated IRF7 expression of HMs, meanwhile up-regulated its downstream target genes STAT3 and IL-6.
Similarly we also investigated the expression of the above three genes in U87-MG with or without co-culture with HMs. IRF7 expression was moderate in U87-MG by itself, moderately dropped in co-culture with parental HM, returned to a level slightly higher than U87-MG (alone) in co-culture with HM-GV358 stables cells, and rose to a higher level in co-culture with HM-GV358-IRF7 (Fig. 4D).
STAT3 expression was high in U87-MG by itself, significantly dropped in co-culture with parental HM, and to a certain extent, recovered in co-culture with HM-GV358 or HM-GV358-IRF7 stable cells (albeit with the level lower than U87-MG by itself) (Fig. 4E). In sharp contrast, IL6 expression was low in U87-MG by itself, slightly increased in co-culture with parental HM or HM-GV358 stable cells, and significantly up-regulated in co-culture with HM-GV358-IRF7 stable cells (Fig 4F). These data suggested that the IRF-7 expression of HMs promoted STAT3-IL-6 signaling activation in U87-MG.
IRF7 expression initiated IL-6 secretion in inflammatory microenvironment
We observed that the IL-6 secretion was the highest in supernatant of HM-GV358-IRF7 co-cultured with U87-MG (i.e. 1366.11±112.23pg), in comparison to HMs alone (292.32±34.92pg, **P=0.015), HMs/U87-MG (124.71±29.56, **P=0.013), and HM-GV358/U87-MG (167.00±30.21pg, **P=0.008) under the same culture condition (Fig 5A). Similarly, the IL-6 secretion in supernatant of IRF7-HMs/U87-MG culture alone was also obviously higher than other supernatant of U87-MG alone (42±9.51pg, **P=0.008), HMs/U87-MG (124.71±29.56, **P=0.013), and HM-GV358/U87-MG under the same culture condition (Fig 5B). The data suggested that IRF7 over-expression contributed to STAT3 induced IL-6 secretion.
A-B: The IL-6 secretion were analyzed in cell culturing supernatant by ELISA. C: IRF-7 and IL-6 gene expression in clinical GBM samples by qRT-PCR detection. D: The IL-6 secretion were detected in clinical blood by ELISA.
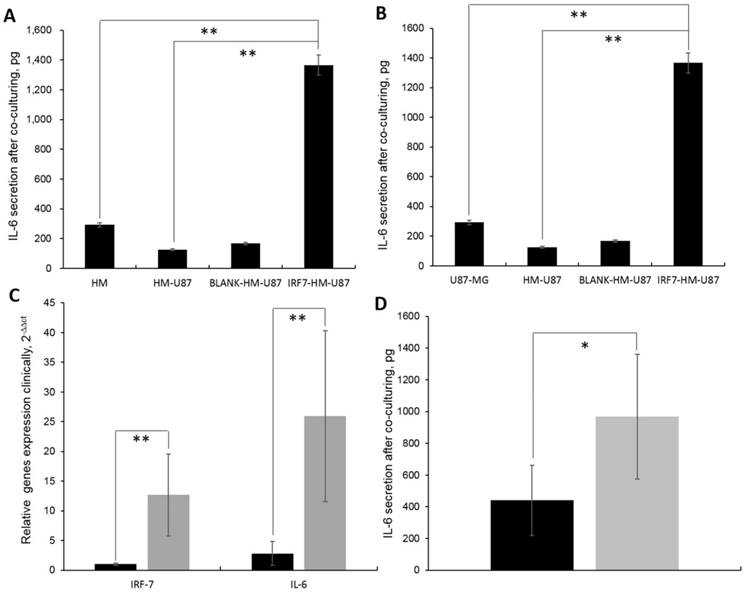
In addition, IRF7 and IL-6 expression was significantly higher in GBM patients than control tissues, i.e. 12.67±6.93 vs. 1.00±0.21, **P=0.006; 25.93±14.41 vs. 2.81±2.01, **P=0.006 (Fig 5C). Meanwhile, the IL-6 secretion was significantly higher in GBM patients' serums than control serums, i.e. 966.93±392.66pg vs. 440.36±220.82pg, *P=0.036 (Fig 5D). It was found that both IRF7 and IL-6 were expressed in GBM samples and IL-6 secreted in GBM patients' sera clinically.
Relationship between the expression of IRF7 and IL-6 in tumor and overall survival and pathological features of patients with glioblastoma
The patient demographics are presented in Table 1. CD137L expression did not significantly (P=0.339) correlate with age, gender, Karnofsky (KPS), and PFS, but significantly correlated with death rate (*P=0.018) in patients with glioblastoma (Table 2). IL-6 expression significantly correlated with progression-free survival (PFS) (*P=0.029) and death rate (**P=0.000) (Table 2). Both IRF7 and IL-6 expression did not significantly (p>0.05) correlated with age, gender, or Karnofsky (KPS) in patients with glioblastoma (Table 2).
Clinical characteristic of 42 patients with brain glioblastoma.
| Patients | Age, years | Gender | Tumor (T) stage | Resection degree | Size | KPS | PFS | OS | Recurrence |
|---|---|---|---|---|---|---|---|---|---|
| P1 | 55 | Male | GBM,T4 | total | 5.50 | 80 | 13.00 | 24.00 | NO |
| P2 | 45 | Female | GBM,T4 | total | 6.00 | 80 | 12.00 | 24.00 | NO |
| P3 | 64 | Female | GBM,T4 | total | 7.00 | 50 | 13.00 | 17.00 | NO |
| P4 | 34 | Female | GBM,T4 | total | 5.50 | 60 | 6.00 | 11.50 | Yes |
| P5 | 52 | Female | GBM,T4 | subtotal | 4,5 | 80 | 6.00 | 8.00 | NO |
| P6 | 35 | Female | GBM,T4 | total | 6.00 | 70 | 19.00 | 23.00 | NO |
| P7 | 36 | Male | GBM,T4 | total | 4.00 | 90 | 6.00 | 8.00 | NO |
| P8 | 23 | Female | GBM,T4 | total | 9.00 | 40 | 12.00 | 22.00 | NO |
| P9 | 56 | Male | GBM,T4 | total | 7.00 | 90 | 4.00 | 13.00 | NO |
| P10 | 66 | Female | GBM,T4 | subtotal | 7.00 | 80 | 3.00 | 4.50 | Yes |
| P11 | 45 | Female | GBM,T4 | total | 4.00 | 90 | 3.00 | 12.00 | NO |
| P12 | 36 | Male | GBM,T4 | subtotal | 4.00 | 90 | 3.00 | 4.00 | NO |
| P13 | 53 | Female | GBM,T4 | subtotal | 5.00 | 90 | 16.00 | 18.00 | NO |
| P14 | 44 | Male | GBM,T4 | subtotal | 6.00 | 80 | 17.00 | 17.00 | NO |
| P15 | 78 | Female | GBM,T4 | total | 7.00 | 90 | 18.00 | 18.00 | NO |
| P16 | 58 | Female | GBM,T4 | total | 6.00 | 89 | 4.00 | 6.00 | NO |
| P17 | 38 | Female | GBM,T4 | subtotal | 5.00 | 70 | 15.00 | 17.00 | NO |
| P18 | 26 | Male | GBM,T4 | total | 2.00 | 50 | 9.00 | 11.00 | Yes |
| P19 | 34 | Male | GBM,T4 | subtotal | 4.00 | 90 | 3.00 | 13.00 | NO |
| P20 | 46 | Male | GBM,T4 | total | 5.50 | 90 | 10.00 | 17.00 | NO |
| P21 | 57 | Male | GBM,T4 | total | 6.00 | 60 | 12.50 | 15.00 | NO |
| P22 | 46 | Male | GBM,T4 | subtotal | 6.00 | 90 | 8.00 | 10.50 | NO |
| P23 | 48 | Male | GBM,T4 | subtotal | 4.00 | 90 | 15.00 | 15.00 | NO |
| P24 | 37 | Female | GBM,T4 | total | 5.00 | 90 | 15.00 | 15.00 | NO |
| P25 | 64 | Male | GBM,T4 | total | 5.00 | 90 | 14.00 | 14.00 | NO |
| P26 | 44 | Female | GBM,T4 | total | 6.00 | 90 | 10.00 | 10.00 | NO |
| P27 | 27 | Female | GBM,T4 | subtotal | 5.00 | 30 | 8.00 | 14.00 | NO |
| P28 | 48 | Female | GBM,T4 | total | 8.00 | 80 | 14.00 | 14.00 | NO |
| P29 | 71 | Male | GBM,T4 | total | 5.00 | 90 | 15.00 | 15.00 | NO |
| P30 | 42 | Male | GBM,T4 | total | 5.00 | 80 | 9.00 | 13.00 | NO |
| P31 | 35 | Male | GBM,T4 | total | 4.50 | 90 | 11.00 | 9.00 | NO |
| P32 | 58 | Female | GBM,T4 | total | 3.00 | 90 | 13.00 | 13.00 | Yes |
| P33 | 63 | Female | GBM,T4 | total | 3.00 | 90 | 12.00 | 13.00 | NO |
| P34 | 33 | Female | GBM,T4 | total | 6.00 | 90 | 6.00 | 9.00 | NO |
| P35 | 48 | Male | GBM,T4 | subtotal | 3.50 | 80 | 9.00 | 10.50 | NO |
| P36 | 64 | Male | GBM,T4 | subtotal | 5.00 | 40 | 8.00 | 10.00 | NO |
| P37 | 48 | Female | GBM,T4 | total | 3.50 | 70 | 4.00 | 10.00 | NO |
| P38 | 26 | Female | GBM,T4 | total | 5.00 | 90 | 3.00 | 4.00 | Yes |
| P39 | 53 | Male | GBM,T4 | subtotal | 6.10 | 80 | 9.00 | 9.00 | NO |
| P40 | 44 | Female | GBM,T4 | total | 4.40 | 90 | 7.00 | 9.00 | NO |
| P41 | 58 | Male | GBM,T4 | total | 5.10 | 70 | 8.00 | 8.00 | NO |
| P42 | 60 | Female | GBM,T4 | total | 5.00 | 90 | 6.00 | 8.00 | NO |
Correlations between IRF7, IL-6 expression in tumor tissues and clinic pathological features of patients with glioblastoma.
| Characteristics | IRF7-positive cells | p value | IL6-positive cells | p value | ||
|---|---|---|---|---|---|---|
| Low | High | Low | High | |||
| Age, years | ||||||
| <60 | 21 | 12 | 14 | 19 | ||
| ≥60 | 5 | 4 | 0.658 | 3 | 6 | 0.622 |
| Gender | ||||||
| male | 13 | 6 | 6 | 13 | ||
| female | 13 | 10 | 0.429 | 11 | 12 | 0.286 |
| Karnofsky, KPS | ||||||
| ≤60 | 6 | 1 | 3 | 4 | ||
| >60 | 20 | 15 | 0.155 | 14 | 21 | 0.888 |
| Progression-free survival, PFS | ||||||
| <12 | 14 | 11 | 6 | 18 | ||
| ≥12 | 12 | 5 | 0.339 | 11 | 7 | 0.018* |
| Recurrence | ||||||
| no | 5 | 3 | 7 | 5 | ||
| yes | 21 | 13 | 0.969 | 10 | 20 | 0.136 |
| Death | ||||||
| no | 20 | 7 | 16 | 10 | ||
| yes | 6 | 9 | 0.029* | 1 | 15 | 0.000** |
Chi-squared tests, *P<0.05, **P<0.01.
Univariate and multivariate analyses using log rank test of Kaplan-Meier methodology and Cox proportional hazard model were used to assess the potential prognostic significance of IRF7 and IL-6 expression and other clinical pathological parameters for patients with GBM. Univariate analysis showed that expression of IRF7/IL-6 and PFS were both significant prognostic factors (Table 3). Multivariate analysis revealed that IL-6 expression was an independent predictor of survival (P=0.019), as was PFS (P=0.035). The relative risk in patients with low levels of IL-6 was 0.07 times greater than that in patients with higher expression of IL-6 (Table 3).
Univariate and Multivariat analyses of variables associated with survival.
| Variables | Univariate analysis | Multivariate analysis | ||||
|---|---|---|---|---|---|---|
| Log-Rank test | 95%CI | P value | HR | 95%CI | P value | |
| IRF7-positive cells(Low vs High) | 8.84 | 3.96-17.04 | 0.00** | 0.37 | 0.12-1.17 | 0.09 |
| IL6-positive cells(Low vs High) | 13.41 | 10.40-13.60 | 0.00** | 0.07 | 0.01-0.64 | 0.02* |
| Age, years(≥60 vs <60) | 0.17 | 11.20-22.80 | 0.68 | 1.86 | 0.32-10.79 | 0.49 |
| Gender(male vs female) | 0.01 | 15.22-20.03 | 0.94 | 0.47 | 0.15-1.53 | 0.21 |
| KPS(≤60 vs>60) | 0.29 | 8.64-25.36 | 0.59 | 0.77 | 0.16-3.73 | 0.75 |
| PFS, months(≥12 vs<12) | 4.46 | 6.20-19.80 | 0.04* | 0.18 | 0.04-0.89 | 0.04* |
Fisher's Exact, *P<0.05, **P<0.01; V means vs.; KPS: Karnofsky; PFS: Progression-free survival.
HR Hazard Ratio, CI confidence interval.
Using a Kaplan-Meier curve assessment, we found that expression of IRF7 was an independent predictor for prognosis of patients with GBM. The two-year overall survival probability among patients with high levels of IRF7 was significantly higher than those with low levels expression (**P=0.003) (Fig. 6B), but wasn't significantly correlated with PFS (P=0.364) (Fig. 6A). Moreover, patients expressing high levels of IL-6 had a better two-year overall survival probability than those expressing low levels (**P=0.000) (Fig. 6D), and was significantly correlated with PFS (*P=0.015) (Fig. 6C).
Kaplan-Meier survival curves according to the level of genes expression including IRF-7 and IL-6 as the patients of genes overexpression show a much more PFS and OS clinical course. A: The IRF-7 overexpression was not significantly correlated with PFS (P=0.364).B: The IRF-7 overexpression was significantly correlated withOS (**P=0.003). C-D: The IL-6 overexpression was significantly correlated with both PFS (*P=0.015), and OS (**P=0.000). The cutoff values of IRF-7 and IL-6 expression were confirmed by calculating 2 folds 2-△△ct values of control samples (Green: patients of genes under-expression; Blue: genes overexpression).
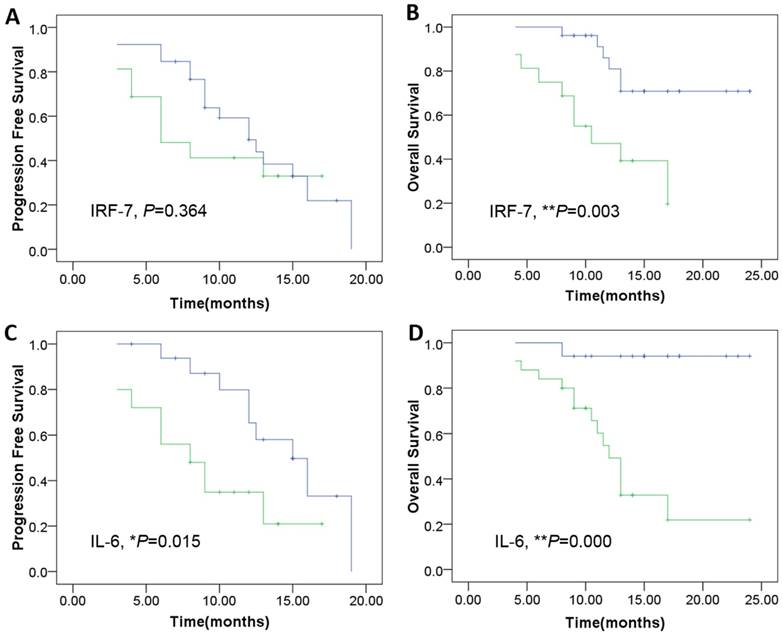
Therefore, we found that high expression of IRF7 and IL-6 is an indicator of longer overall survival in patients with glioblastoma. In this study, we found there was significant correlation between the expression level of IRF7 and IL-6 in the tumor tissue.
Discussion
In the study, we unexpectedly discovered that the IRF7 expression of IRF7 lentiviruses transfected HMs was further increased upon co-culture with U87-MG. In the same co-culture, the expression of IRF7 was also significantly elevated in U87-MG. The expression of both STAT3 and IL-6 were also increased in HM-IRF7 and U87-MG after co-culture, but were declined after HMs co-cultured with U87-MG. It explained that HMs exerted normal immune function of antigen presentation for tumor cells, so caused the under-regulation of negative regulatory factors. However, because the overexpression of IRF7 in IRF7-HMs, both STAT3 and IL-6 were initiated to up-expression in HMs and U87-MG. That is, U87-MG was facilitated for proliferation and inhibited for apoptosis, and was promoted for the characteristics of glioma stem cells.
The primary immune effector cells of the brain are microglia, which are activated in response to brain injury or inflammatory conditions. Most likely, they play a pivotal role during onset, maintenance, relapse and progression of an inflammatory state [17]. Microglia contribute substantially to the tumor mass of glioblastoma as they make up the largest population of tumor-infiltrating cells [18]. The immune function of microglia was inhibited in GBM tissue, such as antigen presentation as dendritic cells, and reduction of costimulatory molecules. The expression of intracellular STAT-3 is a character of M2 microglia polarization [19] which prevents the production of cytokines required to support tumor-specific CD8+ T cells, and CD4+ T helper 1 and promotes the function of CD4+ regulatory T cells, and are therefore tumor supportive [20]. We also found that HMs expressed STAT3 and IL-6, and released IL-6 which can establish an immunosuppressive milieu in the study. The STAT3-polarizated M2 Microglia seem to possess a decisive tumor-supporting role by creating a microenvironment, which plays a critical role in GBM initiation and progression.
IRF7 signaling plays an important role in microglial polarization switching [8]. Constitutive STAT3 activation in tumor cells is associated with invasion, survival, and growth of tumor cells and tumor model in mice in vivo [21]. Some reports indicate that STAT3 is one of the major oncogenic pathways activated in glioma and GSC [22]. Therefore, the activation of IRF7 resulted in the strong promotion of STAT3 expression which increased the expression of IL-6. The STAT3-initiated IL-6 gene expression is upregulated in GBM and that IL-6-STAT3 signaling pathway promotes survival and the stemness potentials of GBM cells.
As a stem-like cell marker, aldehyde dehydrogenase 1 (ALDH1) has been used to isolate tumorigenic stem-like cells in a large number of tumors, including GBM. ALDH1 expression correlates well with asymmetric division capacity and tumor sphere formation [23] and pathological grade and patient survival [24]. The expression of ALDH1 was also elevated substantially in U87-MG after co-culturing with IRF7-HMs, which were related with activation of IRF7-IL-6 signaling pathway probably. IRF7 can maintain stem cells property of GBM cells by mediating IL-6/STAT3 signaling of microglia.
Based the research results above, we collected 42 glioblastoma samples among which 38.10% (16/42) expressed IRF7 and IL-6 was 59.52% (25/42). We further analyzed the relationship between expression of IRF7 or IL-6 and the clinic pathologic features of glioblastoma. Both IRF7 and IL-6 expression did not significantly correlate with age and gender. There was significant association between the expression of IRF7 and death rate. Of note, we found a statistically significant correlation between the expression of IL-6 and PFS and death rate. Some other studies have shown that IRF7 and IL-6 expression was associated with clinical stage in glioma tissues [13, 25]. Kaplan-Meier survival analysis showed that the two-years overall survival rate of patients with high levels expression of IRF7 and IL-6 was significantly higher than those with low levels of IRF7 and IL-6 expression. By using univariate analyses, we found that high expression of IRF7 and IL-6 was significant prognostic factor for glioblastoma. Multivariate analysis revealed that IL-6 expression was an independent predictor for survival and PFS. IRF7 and IL-6 expression may also be a potential prognostic factor in all patients with glioblastoma.
In conclusion, we identified IRF7 expression signature that can promote GBM cell proliferation and inhibit GBM apoptosis, and produce stem cells property by initiating activation of STAT3-IL6 signaling pathway in microglia. The high level of both IRF-7 and IL-6 expression in the tumor tissues may be a useful prognostic marker for patients with GBM.
Acknowledgements
The most important acknowledgement is to the participants and their relatives in this research, as well as authors thank the support from the basic and clinical cooperation foundation of capital medical university (Grant No.14JL05).
Competing Interests
The authors have declared that no competing interest exists.
References
1. Theeler BJ, Gilbert MR. Advances in the treatment of newly diagnosed glioblastoma. BMC Med. 2015;13:293
2. Tarassishin L, Casper D, Lee SC. Aberrant expression of interleukin-1β and inflammasome activation in human malignant gliomas. PLoS One. 2014;9(7):e103432
3. Könnecke H, Bechmann I. The role of microglia and matrix metalloproteinases involvement in neuroinflammation and gliomas. Clin Dev Immunol. 2013;2013(3):914104
4. Zhai H, Heppner FL, Tsirka SE. Microglia/macrophages promote glioma progression. GLIA. 2011;59(3):472-485
5. Wei J, Gabrusiewicz K, Heimberger A. The controversial role of microglia in malignant gliomas. Clin Dev Immunol. 2013;2013:285246
6. Mantovani A, Sica A, Sozzani S, Allavena P, Vecchi A. et al. The chemokine system in diverse forms of macrophage activation and polarization. Trends in immunology. 2004;25:677-686
7. Umemura N, Saio M, Suwa T. et al. Tumor-infiltrating myeloid-derived suppressor cells are pleiotropic-inflamed monocytes/macrophages that bear M1- and M2-type characteristics. Journal of Leukocyte Biology. 2008;83(5):1136-1144
8. Cohen M, Matcovitch O, David E. et al. Chronic exposure to TGFβ1 regulates myeloid cell inflammatory response in an IRF7-dependent manner. EMBO J. 2014;33(24):2906-21
9. Ellert-Miklaszewska A, Dabrowski M, Lipko M. et al. Molecular definition of the pro-tumorigenic phenotype of glioma-activated microglia. Glia. 2013;61(7):1178-90
10. Tanaka T1, Murakami K, Bando Y. et al. Interferon regulatory factor 7 participates in the M1-like microglial polarization switch. Glia. 2015;63(4):595-610
11. Honda K, Yanai H, Negishi H. et al. IRF-7 is the master regulator of type-I interferon-dependent immune responses. Nature. 2005;434(7034):772-7
12. Kim JK, Jin X, Ham SW. et al. IRF7 promotes glioma cell invasion by inhibiting AGO2 expression. Tumour Biol. 2015;36(7):5561-9
13. Jin X, Kim SH, Jeon HM. et al. Interferon regulatory factor 7 regulates glioma stem cells via interleukin-6 and Notch signaling. Brain. 2012;135(Pt 4):1055-69
14. Qiu B, Zhang D, Wang Y. et al. Interleukin-6 is overexpressed and augments invasiveness of human glioma stem cells in vitro. Clin Exp Metastasis. 2013;30(8):1009-18
15. Szulzewsky F, Pelz A, Feng X, Synowitz M, Markovic D, Langmann T. et al. Glioma-Associated Microglia/Macrophages Display an Expression Profile Different from M1 and M2 Polarization and Highly Express Gpnmb and Spp1. PLoS ONE. 2015;10(2):e0116644
16. Engler JR, Robinson AE, Smirnov I, Hodgson JG, Berger MS. et al. Increased Microglia/Macrophage Gene Expression in a Subset of Adult and Pediatric Astrocytomas. PLoS ONE. 2012;7(8):e43339
17. Loane DJ, Kumar A. Microglia in the TBI brain: The good, the bad, and the dysregulated. Exp Neurol. 2015;275(3):316-32
18. Markovic D S, Vinnakota K. Chirasani S, et al. Gliomas induce and exploit microglial MT1-MMP expression for tumor expansion,” Proc Natl Acad Sci U S A. 2009;106(30):12530-5
19. Gabrusiewicz K, Ellert-Miklaszewska A, Lipko M. et al. Characteristics of the alternative phenotype of microglia/macrophages and its modulation in experimental gliomas. PLoS ONE. 2011;6(8):e23902
20. Wei J, Barr J. et al. Glioma-associated cancer initiating cells induce immunosuppression. Clinical Cancer Research. 2010;16(2):461-473
21. Xiong H, Zhang Z, Tian X, Sun D, Liang Q, Zhang Y. et al. Inhibition of JAK1, 2/STAT3 signaling induces apoptosis, cell cycle arrest, and reduces tumor cell invasion in colorectal cancer cells. Neoplasia. 2008;10:287-97
22. Hossain A, Gumin J, Gao F. et al. Mesenchymal Stem Cells Isolated From Human Gliomas Increase Proliferation and Maintain Stemness of Glioma Stem Cells Through the IL-6/gp130/STAT3 Pathway. Stem Cells. 2015;33(8):2400-15
23. Soehngen E, Schaefer A, Koeritzer J. et al. Hypoxia upregulates aldehyde dehydrogenase isoform 1 (ALDH1) expression and induces functional stem cell characteristics in human glioblastoma cells. Brain Tumor Pathol. 2014;31(4):247-56
24. Liu DY, Ren CP, Yuan XR. et al. ALDH1 expression is correlated with pathologic grade and poor clinical outcome in patients with astrocytoma. J Clin Neurosci. 2012;19(12):1700-5
25. Shan Y, He X, Song W. et al. Role of IL-6 in the invasiveness and prognosis of glioma. Int J Clin Exp Med. 2015;8(6):9114-20
Author contact
![]() Corresponding author: Jiang Zhongli, M.D., Neurosurgery, Beijing Tiantan Hospital, Capital Medical University, Tiantan Xili No 6, Beijing 100050, People's Republic of China. Phone & Fax: +86-10-67096509, email: jiangzhongli5com.
Corresponding author: Jiang Zhongli, M.D., Neurosurgery, Beijing Tiantan Hospital, Capital Medical University, Tiantan Xili No 6, Beijing 100050, People's Republic of China. Phone & Fax: +86-10-67096509, email: jiangzhongli5com.