Impact Factor ISSN: 1837-9664

 Global reach, higher impact
J Cancer 2016; 7(15):2388-2407. doi:10.7150/jca.15055 This issue Cite
Research Paper
The Role of BCA2 in the Endocytic Trafficking of EGFR and Significance as a Prognostic Biomarker in Cancer
Jennifer M. Wymant1, Stephen Hiscox1, Andrew D. Westwell1, Sylvie Urbé2, Michael J. Clague2, Arwyn T. Jones1 ![]()
1. Cardiff School of Pharmacy and Pharmaceutical Sciences, King Edward VII Avenue, Cardiff, CF10 3NB, Wales, U.K.
2. Institute of Translational Medicine, University of Liverpool, Crown Street, Liverpool, L69 3BX, England, U.K.
Received 2016-1-22; Accepted 2016-8-14; Published 2016-12-9
Abstract
Breast Cancer Associated gene 2 (BCA2) is an E3 ubiquitin ligase that is over-expressed in >50% of primary breast cancers, and has been shown to increase in vitro cell proliferation and invasion. The protein has been linked to alterations in EGFR degradation; however there is some dispute as to its role and influence on the biology of this receptor. Our work aimed to ascertain the role of BCA2 in EGFR endocytosis and down-regulation and to examine its links with breast cancer outcome. Data generated with the online expression analysis tool KM-Plotter showed that high BCA2 levels are associated with poor prognosis in ovarian, gastric and breast cancer, particularly HER2 over-expressing breast cancers. Experimentally, we demonstrate that over-expression of BCA2 induced a reduction in total EGFR levels. BCA2 over-expressing cells stimulated with EGF exhibited reduced lysosomal degradation of both this ligand and its receptor. Signalling downstream of EGFR in BCA2 over-expressing cells was characterized by a lower magnitude but increased duration. Our findings support a role for BCA2 in receptor endocytosis. Consistent with this we show that BCA2 over-expression reduces the level of vesicle-associated Rab7, a regulator of late endocytosis and documented interaction partner of BCA2. Levels of transferrin receptor and the uptake of transferrin were unaltered by over-expression of BCA2 indicating that trafficking changes may be limited to late endocytic sorting events. This report offers a thorough exploration of BCA2 biology and suggests a context-dependent role for the protein in the endocytic regulation of EGFR and as a prognostic biomarker in cancer.
Keywords: BCA2
Introduction
Receptor tyrosine kinases (RTKs) are essential for normal cell function and are often over-expressed, ineffectively down-regulated or mutated in cancer. Epidermal growth factor receptor (EGFR) and human epidermal growth factor receptor 2 (HER2) are members of the ErbB family of RTKs that are of particular importance in breast cancer. Although estimates vary, EGFR over-expression is thought to present in approximately 30% of breast cancers while HER2 positivity is detected in 25-30% of cases (1, 2). High levels of EGFR and HER2 are associated with more aggressive cancer phenotypes and poorer prognosis (3). When activated by ligand binding and dimerization, RTKs are internalized and pro-oncogenic intracellular signalling is initiated, primarily via the MAPK and PI3K/Akt pathways. The aberrant gene expression induced by enhanced expression/activation of EGFR or HER2 promotes cancer cell proliferation, survival, migration, and angiogenesis (4).
Endocytosis is the mechanism by which cells internalize ligand-bound RTKs, and a critical process for the regulation of downstream signalling (5). Activated receptors are removed from the cell surface in vesicles that are shuttled into the cell. These vesicles fuse with early endosomes via the action of Rab5, a member of the Rab family of small GTPases that collectively coordinate many stages of membrane trafficking. Receptors are sorted in the early endosome and are subsequently trafficked along different routes (6): fast or slow recycling to the plasma membrane or lysosomal degradation. Receptor recycling maintains receptor numbers on the cell surface, prolongs signalling and promotes receptor reactivation. Rab7 controls the degradation pathway and is responsible for receptor sorting in late endosomes and transport to lysosomes for degradation (7).
Proteins regulating RTK endocytosis have also been implicated in cancer (8) including Rab7 (9), Rab5 (10) and the E3 ligase C-cbl (11, 12). Rab7 has been shown to affect cell survival and adhesion via co-ordination of the later stages of endocytosis (9). Rab7 has additionally been shown to have a role in endocytosis and cancer through its interaction with Breast Cancer Associated gene 2 (BCA2). The consequence of the relationship between BCA2 and Rab7 has been separately said to both inhibit and promote EGFR degradation (13-15).
BCA2 is a RING E3 ubiquitin ligase, a family of enzymes involved in the post-translational modification of other proteins via the addition of small, regulatory ubiquitin tags. In addition to BCA2, a number of E3 ligases have been implicated in breast cancer including: BRCA1; RNF11; c-Cbl and Efp (16). Upon first identification, BCA2 was named Rabring7 due to its interaction with Rab7 (13). The protein is also known as RNF115 and ZNF364 and the name BCA2 derives from its association with breast cancer. Differential display and subtractive hybridization screening in normal and malignant mammary cell lines showed that BCA2 was significantly up-regulated in 56% of primary breast cancers and 74% of estrogen receptor (ER) positive disease (17). In vitro data from the same study suggested an oncogenic role: siRNA depletion of BCA2 significantly reduced cell growth and invasion of T47D (ER+) breast cancer cells while over-expression of BCA2 in NIH3T3 (mouse fibroblast) cells increased proliferation by 50%. Further functional links between BCA2 expression and breast cancer pathology have since been explored by other in vitro experiments, clinical expression analyses and genomic studies. The principal findings from these studies indicate that BCA2: 1) is transcriptionally regulated by the ER, 2) can modulate the anti-breast cancer effect of the AMPK inhibitor metformin, 3) can promote proliferation of ER+ breast cancer by down-regulating p21, 4) has a role in regulating the DNA damage response, 5) is a potential susceptibility gene for breast cancer and 6) may serve as a potential drug target in anti-breast cancer therapy (18-24).
It has been suggested, based on over-expression studies, that BCA2 is recruited by Rab7 to late endosomes and lysosomes, and that as a result EGFR degradation is inhibited (13). Intriguingly, BCA2 has also been shown to promote degradation of EGFR, as siRNA depletion of BCA2 in cervical cancer cells caused EGFR to accumulate in late endocytic compartments following EGF stimulation. The defects in EGFR degradation were attributed to a reduction in the number of late endosomes formed in the BCA2 depleted cells (15).
As the body of work on BCA2 has increased, so too has the apparent disparity in the literature surrounding the protein's role in receptor trafficking and breast cancer. We therefore sought to further explore BCA2's role in EGFR endocytosis, down-regulation and signalling. In parallel we also examined the relationship between BCA2 expression and patient survival in different breast cancer subtypes and in other cancers. Our results substantiate a role for BCA2 in EGFR endocytosis and signalling and link this to the sub-cellular localization of Rab7. BCA2 expression correlates with poorer prognosis in ovarian, gastric and breast cancers (particularly in breast cancer subtypes that over-express HER2).
Materials and Methods
Routine cell culture
MCF-7 (ER+, HER2-), MDA-MB-231 (ER-, HER2-), BT474 (ER+, HER2+) and T47D (ER+, HER2-) human breast cancer cells were kindly donated by the Breast Cancer Molecular Pharmacology Group (BCMPG), Cardiff University. MCF-10A human breast epithelial cells were purchased from the ATTC's approved UK supplier LGC Standards. Cervical cancer HeLa cells were obtained from the European Molecular Biology Laboratory (25).
MCF-7, MDA-MB-231, BT474 and T47D cells were cultured in Roswell Park Memorial Institute media (RPMI) containing phenol red and supplemented with 10% Fetal Bovine Serum (FBS). MCF-10A cells were grown in Dulbecco's Modified Eagle Medium: Nutrient mixture F12 (DMEM/F12) supplemented with 5% horse serum, 20 ng/mL epidermal growth factor (EGF), 0.5 µg/mL hydrocortisone, 100 ng/mL cholera toxin and 10 µg/mL insulin (26). HeLa cells were cultured in Dulbecco's Modified Eagle Medium (DMEM) supplemented with 10% FBS.
All cell lines were cultured at 37°C in a 5% CO2 humidified atmosphere. Cells were used up to a maximum of 28 passages and were subject to regular mycoplasma testing.
Transfection
Plasmid constructs
The pCMV-HA plasmid containing the BCA2 insert was a kind gift from Naoki Yamamoto at the AIDS Research Centre, National Institute of Infectious Diseases, Tokyo (27).
pCMV6-AC-HA (PrecisionShuttle) with no insert DNA was used as a mock-transfection control in HA-BCA2 experiments.
Fugene 6 transfection
The following method describes volumes and quantities per well of a 12-well plate and quantities were scaled accordingly for transfections in 6- and 96- well plates. MCF‑7 (110,000), MDA-MB-231 (75,000) or HeLa (67,000) cells were seeded onto coverslips and incubated for 24 hr in 800 µL complete media. After 24 hr the cells were transfected with Fugene 6 (#E2691, Promega) in accordance with the manufacturer's directions. Fugene 6 transfection mixture was prepared by mixing 3 μL of Fugene 6 with 97 μL of serum free media (SFM) and incubating at room temperature for 5 min. The diluted Fugene 6 was then added to 1 μg of plasmid DNA in 98 μL of SFM. The mixture was incubated at room temperature for 30 min then 200 μL of the FuGENE 6:DNA complex was added dropwise to cells. The media was changed for fresh complete media after 5 hr and cells were subject to analysis 24 hr after transfection.
Ligand Binding and Uptake: EGF, Alexa-labeled-EGF and Alexa-labeled-Transferrin
Transfected cells were pre-incubated in 1 mL SFM for 1 hr at 37°C, 5% CO2. The SFM was then replaced with 500 μL of SFM containing one of the following ligands diluted in SFM: 20 ng/mL EGF (#E9644, Sigma); 8 μg/mL transferrin Alexa-488 (#T-13342, Molecular Probes); 0.5 μg/mL Alexa-555 EGF (#E35350, Molecular Probes); 0.5 μg/mL Alexa-488 EGF (#E13345, Molecular Probes). The cells were incubated in these ligand solutions for time periods up to 60 min. The culture plates were then placed on ice and rinsed 2x with ice-cold PBS prior to further analysis.
Antibodies
Western Blotting
Mouse anti-HA HA.11 clone 16B12 (#MMS-101P, Covance, 1:1000). Goat anti-BCA2 (#SAB2500854, Sigma Aldrich, 1:500). Rabbit anti-EGFR (#HPA018530, Sigma, 1:1000). Mouse anti-Transferrin Receptor (#13-6800, Life Technologies, 1:500). Mouse anti-c-Met (#3127, Cell Signalling, 1:500). Rabbit anti-pEGFR Tyr1068 (#3777, Cell Signalling, 1,000). Rabbit anti-AKT (#9272, Cell Signalling, 1:1,000). Rabbit anti-pAKT Ser473 (#9271, Cell Signalling, 1:500). Rabbit anti-ERK 1/2 (#9102, Cell Signalling, 1:500). Rabbit anti-pERK 1/2 Thr202/Tyr204 (#9101, Cell Signalling, 1:500). Mouse HRP conjugated anti-β-tubulin (#ab21058, Abcam, 1:50,000). All secondary antibodies for Western blotting were from Pierce and were used at a dilution of 1:2000.
Immunofluorescence microscopy (IF)
Mouse anti-HA HA.11 clone 16B12 (#MMS-101P, Covance, 1:1000). Rabbit anti-EGFR
(#HPA018530, Sigma, 1:100). Mouse anti-EEA1 (#SC-6415, Santa-Cruz, 1:200). Rabbit anti-LAMP2 (#H4B4, DSHB, 1:200). Rabbit anti-Rab7 (#9367, Cell Signalling, 1:100). Rabbit anti-HA (#3724, Cell Signalling, 1:1600). Rabbit anti-cathepsin D (#ab72915, Abcam, 1:100). Mouse anti-transferrin receptor (#13-6800, Life Technologies, 1:300). All secondary antibodies for IF were from Life Technologies and were used at a dilution of 1:400.
Fluorescence microscopy
Immunofluorescence
PFA fixation for antibodies against: HA, EEA1, TfR and EGFR
Cells cultured on glass coverslips were fixed in 3% paraformaldehyde (PFA) for 15 min, free aldehyde groups were blocked with 50 mM NH4Cl for 10 min and cells were permeabilised for 5 min with 0.2% Triton X-100.
Methanol fixation for antibodies against: HA, cathepsin D and LAMP2
Cells cultured on glass coverslips were fixed in -20 °C, 100% methanol at -20 °C for 5 min then washed thrice in PBS.
Single antibody immunolabeling for HA
Following fixation, a solution of 2% FBS, 2% bovine serum albumin (BSA) in PBS was used to block non-specific binding sites via a 1 hr incubation. Cells were then incubated for 1 hr with anti-HA antibody diluted in blocking solution before being washed and incubated with Alexa labeled secondary antibody and Hoechst 33342 (#H3570, Life Technologies) at 1 µg/mL for 1 hr. Washed coverslips were mounted onto glass slides and were imaged by confocal microscopy.
Double antibody immunolabeling for HA and either EGFR, EEA1, cathepsin D, TfR or LAMP2
The protocol for double immunolabeling followed the protocol for single labeling until after the secondary antibody incubation. At this point the cells were blocked for a second time in 150 μL blocking buffer for 30 min before being incubated with the second diluted primary antibody (raised in a different species from either of the previously applied antibodies). After incubation for 1 hr at room temperature the coverslips were washed, then incubated with the appropriate species of Alexa labeled secondary antibody for 1 hr. Washed coverslips were then mounted onto glass slides for imaging.
Double antibody immunolabeling for HA and Rab7
The cells were fixed then incubated with NH4Cl as for single labeling. They were then blocked in 150 μL of 5% BSA, 0.3% (v/v) Triton X-100 for 1 hr and subsequently incubated overnight with anti-Rab7 antibody (4°C with gentle agitation in a humidified chamber). The antibody diluent was 1 % BSA, 0.3 % (v/v) Triton X-100. On the second day cells were incubated with Alexa labeled secondary antibody and Hoechst 33342 for 1 hr. The protocol for single antibody labeling for HA was then followed, though Hoechst was omitted from the final secondary antibody incubation.
Microscopy
Confocal fluorescence microscopy analysis was conducted on a Leica SP5 inverted confocal laser scanning microscope. The microscope was equipped with a 63x oil-immersion objective and 405, 488, 453 and 633 nm excitation lasers. Gain and offset settings were optimized for each fluorescent channel within an experiment. Images were recorded using the sequential scanning mode to prevent fluorescence channel crosstalk/ bleed-through. Images were scanned at 100 Hz with a line average of three to reduce noise.
Western blotting
Cells were seeded in 6-well plates and grown in complete media to 70-80 % confluence on the day of lysate collection. Cell lysates were collected on ice by washing x1 in ice-cold PBS then scraping in 100 μL of lysis buffer (150 mM NaCl, 50 mM Tris base pH 8, 1 % NP-40 containing protease and phosphatase inhibitors). The lysates were centrifuged at 13,800 xg for 10 min at 4 °C and protein concentration of the supernatants was determined by bicinchoninic acid assay (BCA) assay. Samples were then mixed with 4x SDS-PAGE loading buffer before thermal denaturation at 96 °C for 5 min, and centrifugation at 4°C, 13,800 g for 30 s. Proteins (18 μg total) were then separated by SDS-PAGE on a 10% acrylamide gel and were transferred to Polyvinylidene fluoride (PVDF) membrane. Membranes were blocked for 1 hr at room temperature in 5% milk in PBST (0.025% Tween20) and were incubated overnight at 4 °C with primary antibodies diluted in milk in PBST at the following dilutions: 5 % milk (anti-Tubulin), 3 % milk (anti-BCA2) or 2 % milk (all other primary antibodies). Membranes were washed in PBST before being incubated for 1 hr at room temperature with species specific secondary antibodies (diluted in 2 % milk in PBST). Before development, the membranes were washed again in PBST. Protein bands were detected by enhanced chemiluminescence (ECL). Band intensities were quantified using ImageJ software and normalized to loading control bands for housekeeping proteins.
Antibody stripping for membrane reprobing
After the first immunoblotting procedure had been completed and imaged, some membranes needed to be stripped and reprobed, to this end membranes were washed 2x 5 min in PBS then 2 x 5 min in dH2O. The membranes were then stripped in 0.2 M NaOH for 10 min before being washed twice more for 5 min in dH20 and 2 x 5 min in PBS. The membrane was then ready for the blocking step of the second immunoblotting procedure.
Cell viability
Cell viabilities were determined using the CellTiter-Blue® assay (#G8080, Promega) in accordance with manufacturer's instructions. HeLa cells (3,500) were seeded into black 96-well plates and incubated overnight at 37°C, 5% CO2. The following day they were transfected with 0.1 μg HA-BCA2 or empty vector control and incubated under normal tissue culture conditions for 24 hr. Cells were then serum starved in SFM for 1 hr before being incubated for 48 hr with 100 µL of either: complete media, reduced-serum (0.5% FBS) media or reduced-serum media containing 20 ng/ml EGF. After 44 hr incubation, 20 μL of CellTiter-Blue reagent was added to each of the wells and the plates were returned to the incubator for 4 hr. The final fluorescence (544Ex/590Em) was measured using a Fluostar Optima fluorescent plate reader.
Statistical methods
Results are presented from either all the data from three independent experiments or representative images/immunoblots are shown (as indicated in the figures). Where replicates were performed (and data was quantitative) separate means were calculated for each independent experiment. Independent means were then averaged to give an estimate of the true mean (µ) and 95% confidence intervals. Quantitative data are presented as means ± 95% confidence intervals (28). Prior to conducting statistical analyses to compare means, F-tests for heteroscedasticity were performed to determine whether a T-test for equal or unequal variance should be used. Student's independent T-tests were performed when determining the significance of differences between two groups/means.
GOBO: gene expression-based outcome
The online biomarker assessment tool GOBO (http://co.bmc.lu.se/gobo)(29) was used to analyze the expression levels of BCA2 across different subgroups in a panel of 51 breast cancer cell lines based on Affymetrix ID 212742_at (BCA2) signal intensity. Mean log2 expression levels for each cell line were displayed by the software along with box-plots for each of the groups (Basal A, Basal B and luminal; Triple negative, HER2, and hormone receptor positive). Analysis of variance (ANOVA) statistics were automatically performed to assess differences between groups.
Biomarker and survival analysis
The KM Plotter online biomarker analysis tool (http://www.kmplot.com/) (30) was used to produce Kaplan-Meier plots for relapse free survival (RFS) and overall survival (OS) based on the signal intensity of Affymetrix ID 212742_at (BCA2). This probe set was chosen for the analysis as JetSet probes have been optimized for gene specificity, splice variant coverage and resistance to degradation (31). The dataset was divided into high and low expressing groups using the auto-select best cutoff. Survival curves were generated across all tumours and, in breast cancer, for analyses restricted according to ER status, HER2 status and molecular subtype. The hazard ratio for RFS or OS with 95% confidence intervals and logrank P value were also calculated for low vs. high BCA2 expression.
Results
BCA2 expression in a panel of cell lines
BCA2 mRNA expression was analyzed in silico from a publicly available dataset of 51 breast (normal and cancer) cell lines using GOBO (29). Relative expression levels across the cell lines are presented in Figure 1A. Statistical comparison was also made between groups of cell lines divided according to basal or luminal type (Fig. 1B). A third analysis looked at BCA2 expression across cell line groups defined by HER2 positivity, hormone receptor positivity and triple negative subtypes (Fig. 1C). Mean BCA2 mRNA levels were higher in breast/breast cancer cell lines categorized as luminal (e.g. MCF‑7 and T47D) though the difference in expression compared with basal A (e.g. MDA‑MB‑468) and basal B (e.g. MDA-MB-231) types was non-significant (Figure 1B, p=0.09616). The highest mean BCA2 expression was associated with hormone receptor positivity and lower mean BCA2 expression levels were seen in the triple negative and HER2+ cell lines (Figure 1C). The difference in BCA2 expression between triple-negative, HER2 and hormone receptor positive cell line classes was statistically significant (p=0.02912).
Comparative BCA2 expression analysis. A-C) From GOBO dataset of 51 normal and malignant breast cell lines. A) Log2 BCA2 expression levels across all the cell lines. Green arrows indicate the cell lines chosen for Western blotting analysis in 1D. B) Mean Log2 BCA2 expression compared between basal A, B and luminal A subtypes. C) Mean Log2 BCA2 expression compared between triple negative, HER2 positive and hormone receptor positive disease. In A and B: Red = Basal A, Grey = Basal B and Blue = Luminal. D) Immunoblots of endogenous BCA2 and EGFR levels in a panel of cell lines. BCA2 protein levels quantified with ImageJ software, normalized to the tubulin loading control and their expression levels were calculated relative to MCF-10A cells.
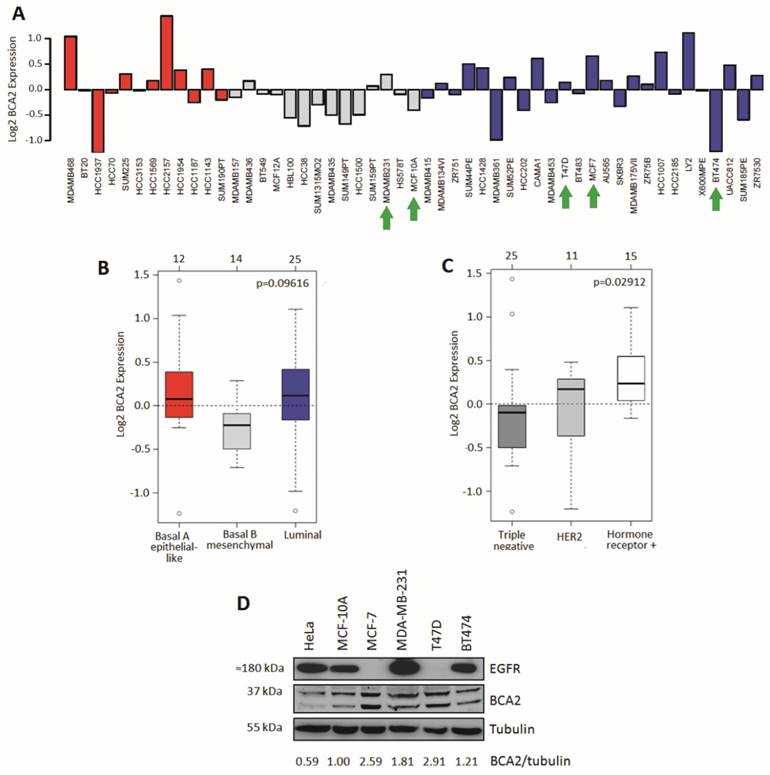
We compared relative protein expression levels of BCA2 and EGFR in a selection of breast cell lines by Western blotting. Band intensities were quantified using ImageJ software, normalized to tubulin and expressed relative to MCF-10A levels (Fig. 1D). Our cell panel comprised immortalized breast epithelial cells (MCF-10A), luminal A, ER+ breast cancer cells (MCF-7 and T47D), triple-negative breast cancer (MDA-MB-231) and luminal B, HER2+ breast cancer (BT474). We also included the HeLa cervical carcinoma line in our analysis as EGFR trafficking in these cells is well characterized and they have been used in published studies of BCA2's effects on receptor trafficking (15). Endogenous BCA2 expression varied across these cell lines (Fig. 1D) and suggested a possible inverse relationship between BCA2 and EGFR expression. However, the panel of cell lines tested was not sufficiently large to perform meaningful correlation analyses. The immunoblots of BCA2 demonstrated two clear bands near the approximate predicted molecular weight of BCA2 (34 kDa). Confirmation that these both represented BCA2 was shown using siRNA depletion (supplementary Figure S1). In line with data in Figure 1D, BCA2 most often appears in the literature as a doublet (15, 17, 27, 32). T47D and MCF-7 cells expressed the highest levels of BCA2 while HeLa expressed the lowest. MDA-MB-231 cells were also found to express relatively high levels, contrary to some published data, though in line with others and with the mRNA data in Figure 1A (18, 22).
Heterogeneity of BCA2 localization and expression levels in transiently transfected MCF-7, MDA-MB-231 and HeLa cells
The sub-cellular localization of endogenous BCA2, using different antibodies, has variously been described in the literature as: nuclear (MCF-7) (33); cytoplasmic and/or late endosome/ lysosome associated (BHK) (13); punctate cytoplasmic staining (MCF-7) (32); faint cytoplasmic and intense nucleolar staining (MCF-7) (21). In transfected 293T cells large cytoplasmic accumulations of BCA2 have been demonstrated (27). The differences in reported subcellular localization may reflect true biological heterogeneity or may result from different experimental approaches. Given these discrepancies and the lack of validated commercially available antibodies, we decided to use transient expression of epitope tagged protein as an alternative means of characterising BCA2 localization.
The HA-BCA2 plasmid was transfected into MCF-7, MDA-MB-231 and HeLa cells which, 24 hrs later, were fixed and immunolabeled for HA. HA-BCA2 transfected MCF-7 and HeLa cells both displayed a number of different, seemingly expression level-dependent phenotypes (Fig. 2, top and bottom rows). High BCA2 expressing cells either tended to display ubiquitous small, uniform vesicles throughout the cytoplasm or they contained large, dense perinuclear vesicles and/or large cytoplasmic structures. Cells expressing moderate BCA2 levels cells tended to have diffuse cytoplasmic staining with few sparsely distributed vesicles, whilst low HA‑BCA2 expressing cells only showed a faint, diffuse cytoplasmic labeling. There was some evidence of nuclear labeling in the transfected cells but this was rare (<5% of transfected cells) and there was no evidence of BCA2 in nucleoli.
Sub-cellular localization of HA-BCA2 in MCF-7, MDA-MB-231 and HeLa cells. Cells were transfected with HA-BCA2 and after 24 hr were fixed and immunolabeled for HA. Nuclei were counterstained blue with Hoechst. Blue arrowheads indicate vacuoles. Scale bars = 25 μm.
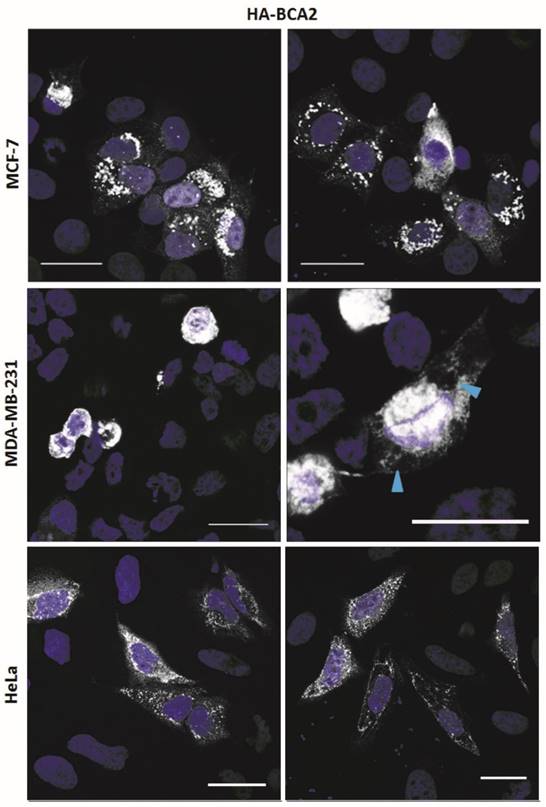
HA-BCA2 over-expressing MDA-MB-231 cells (Fig. 2, middle row) showed signs of poor viability: most of the transfected cells appeared to be rounded or demonstrated cytoplasmic vacuolation. Owing to the poor viability no further experiments were performed on the MDA-MB-231 cells.
In order to verify that the sub-cellular localisation in Figure 2 related to HA-tagged BCA2, i.e. to confirm that the protein was expressed and the HA-tag was uncleaved, double-immunolabeling was performed for BCA2 and HA. Co-localization analysis confirmed that immunofluorescence staining was specific to BCA2 and that the HA tag remained attached in vitro (Supplementary Figure S2A). Single labeling was also performed for both BCA2 and HA (Supplementary Figure S2B). The staining patterns seen in single-labeled cells were very similar, further indicating the structures/localisation seen were not artefacts of the double-labeling process. These experiments also validated the goat anti-BCA2 antibody for use in immunofluorescence.
BCA2 over-expression decreases EGFR levels in HeLa cells
BCA2 has been shown to alter EGFR trafficking (13-15) but its effects on basal levels of this RTK have not been directly explored. HeLa cells naturally express low levels of BCA2 (Fig. 1) and EGFR trafficking in these cells has been extensively studied. BCA2 depletion in HeLa cells has previously been shown to impair ligand induced degradation of both EGFR and c-Met (15). The HeLa cell line was therefore a useful model for studying the effects of BCA2 over-expression on EGFR in cancer cells. We investigated BCA2 induced changes in total levels of the RTKs EGFR and c-Met and also of the (non-tyrosine kinase) transferrin receptor (TfR). Receptor levels were examined by Western blotting of cells transfected with HA-tagged BCA2 or the mock plasmid. Three independent, duplicate experiments showed a significant decrease in total EGFR (p=0.001) and c-Met (p=0.003) in the HA-BCA2 over-expressing cells (Fig. 3A-C); TfR expression was not significantly altered (p=0.365. Figures 3A and D).
Relative levels of EGFR, c-Met and TfR in mock transfected control and HA-BCA2 over-expressing HeLa cells. A) Immunoblots for selected receptors in cells transfected with HA-BCA2 or mock transfected with an empty control vector. B-D) Protein expression was quantified with ImageJ software. Results from three independent, experiments carried out in duplicate are shown. Error bars represent 95% confidence intervals. ** p≤0.01. *** p≤0.001. E and F) Confocal microscopy images of EGFR in HA-BCA2 over-expressing HeLa cells. HA-BCA2 transfected cells were serum starved for 60 min then either E) stimulated with 20 ng/mL EGF for 15 min or F) incubated with EGF Alexa 488 for 30 min on ice. Cells were then fixed and immunolabeled for HA-BCA2 (red) and (in E only) for EGFR (green). Nuclei were stained blue with Hoechst. Representative images from two independent, duplicate experiments are shown. Scale bars = 50 µm. Arrowheads indicate examples of HA-BCA2 transfected cells.
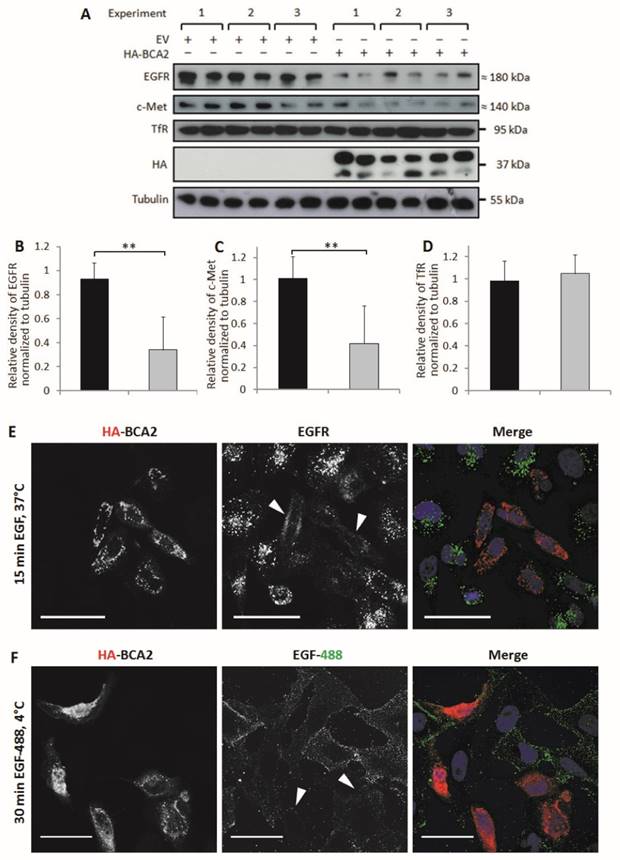
In order to visualize the reduction in EGFR levels induced by BCA2 over-expression, two different experiments were performed. Firstly, cells were treated with EGF to induce EGFR accumulation in early endosomes and secondly cells were incubated with fluorescently labeled EGF on ice (9). Incubating cells with EGF at 4°C for 30 min allows the ligand to bind to surface receptors without inducing internalization (34).
Figure 3E shows the results of double-labeling IF for HA and for EGFR following EGFR stimulation. HA-BCA2 transfected cells showed reduced accumulation of EGFR in intracellular vesicles. Figure 3F demonstrates a trend of reduced EGF-488 binding to the HA-BCA2 over-expressing cells, indicative of reduced receptor numbers on the cell surface.
Total expression levels of EGFR were also examined in MCF-7 cells following siRNA depletion of BCA2 in three independent Western blotting experiments (Supplementary Fig. S1). An 80% reduction in BCA2 was associated with a 2.5 fold increase in EGFR levels in the BCA2high/EGFRlow cell line (p=0.040) while levels of TfR were unaffected (p=0.451). This confirms in two different cell types that BCA2 expression can influence EGFR protein expression levels.
BCA2 over-expression delays EGFR degradation in HeLa cells
The binding of EGF to EGFR stimulates internalization and trafficking of the receptor-ligand complex, primarily to the lysosomes for degradation (34). BCA2 has been reported to alter ligand-induced degradation of EGFR, though there is some debate as to whether the protein promotes or inhibits degradation of the receptor (13-15). Having shown that total EGFR levels are influenced by changes in BCA2 expression we investigated the effect of BCA2 over-expression on EGFR endocytic downregulation following EGF stimulation (Fig. 4).
EGFR and EGF degradation in HA-BCA2 over-expressing HeLa cells. A) HA-BCA2 and mock transfected HeLa cells were serum starved for 60 min then stimulated with 20 ng/ml EGF for 0 or 60 min. Cell lysates were collected from three independent, triplicate experiments. Western blotting was performed for EGFR and HA. Representative blot of a single experiment is shown. B) Band intensities were quantified using ImageJ software. Error bars represent 95% confidence intervals. * p≤0.05. ** p≤0.01. C and D) Confocal microscopy images of endocytosed fluorescent EGF and Transferrin (Tf) in HA-BCA2 over-expressing HeLa cells. HA-BCA2 transfected cells were incubated with 0.5 µg/mL Alexa-488 EGF or 8 µg/mL Alexa-488 Tf (both green) for 15 OR 60 min before being fixed and immunolabeled for HA (red). Nuclei were stained blue with Hoechst. Scale bar = 50 µm. Arrowheads indicate examples of HA-BCA2 transfected cells.
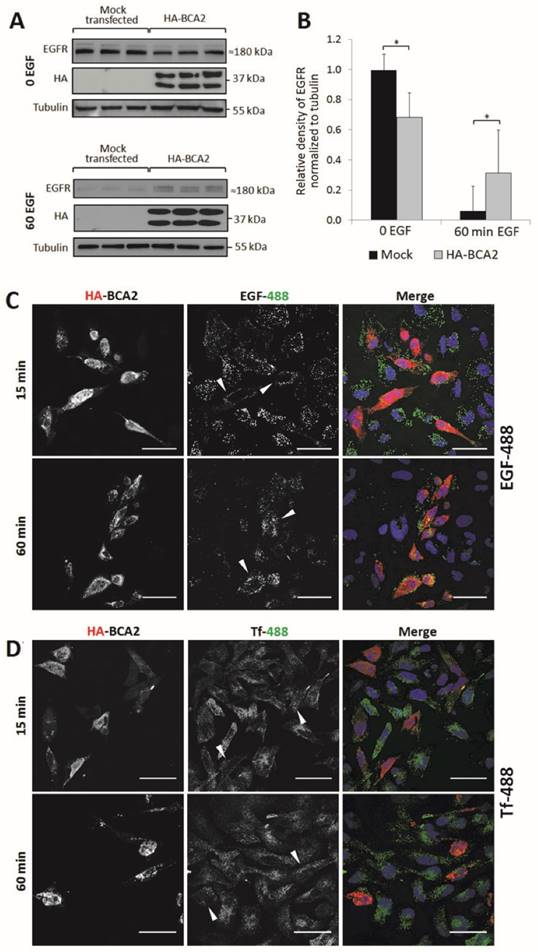
For Western blot analysis, HA-BCA2 and mock transfected HeLa cells were serum starved for 60 min then stimulated with 20 ng/mL EGF (or diluent control) for the same time period. Cell lysates were collected from three independent experiments conducted in triplicate. Following SDS-PAGE and transfer to PVDF, immunoblotting was performed for EGFR, HA and tubulin (Fig. 4A) and band-densities were quantified using ImageJ (Fig. 4B). Basal EGFR expression levels (t=0) were significantly reduced in HA-BCA2 over-expressing cells relative to mock transfected controls (p=0.002). Conversely, after 60 min, significantly more EGFR persisted in the HA-BCA2 over-expressing cells (p=0.030) indicating that EGFR degradation was delayed as a result of the increase in BCA2 levels.
We next monitored the endocytic degradation of EGFR by confocal microscopy of HA-BCA2 over-expressing HeLa cells acutely stimulated with fluorescently labeled EGF. To control for potential general effects on endocytosis, we also used fluorescently labeled transferrin (Tf) in parallel experiments. Transfected cells were incubated for 15 or 60 min with either 0.5 µg/mL Alexa-488 EGF or 8 μg/mL Alexa-488 Tf. After incubation with the fluorescent ligands the cells were fixed and immunolabeled for HA-BCA2 (Fig. 4C and D).
Figure 4C demonstrates that EGF internalization was initially reduced in the BCA2 over-expressing HeLa cells, as indicated by the low EGF-488 signal at 15 min. After 60 min of incubation, EGF appeared to accumulate and persist in BCA2 over-expressing HeLa cells. In contrast, the majority of the EGF signal was lost in the non-transfected cells due to lysosomal delivery and degradation. This mirrors the results seen by Western blotting (Fig. 4A). There was little discernible difference in Tf uptake and distribution between HA-BCA2 over-expressing cells and non-transfected controls at either time point (Fig. 4D).
Endocytic profile of BCA2 over-expressing HeLa with and without EGF stimulation
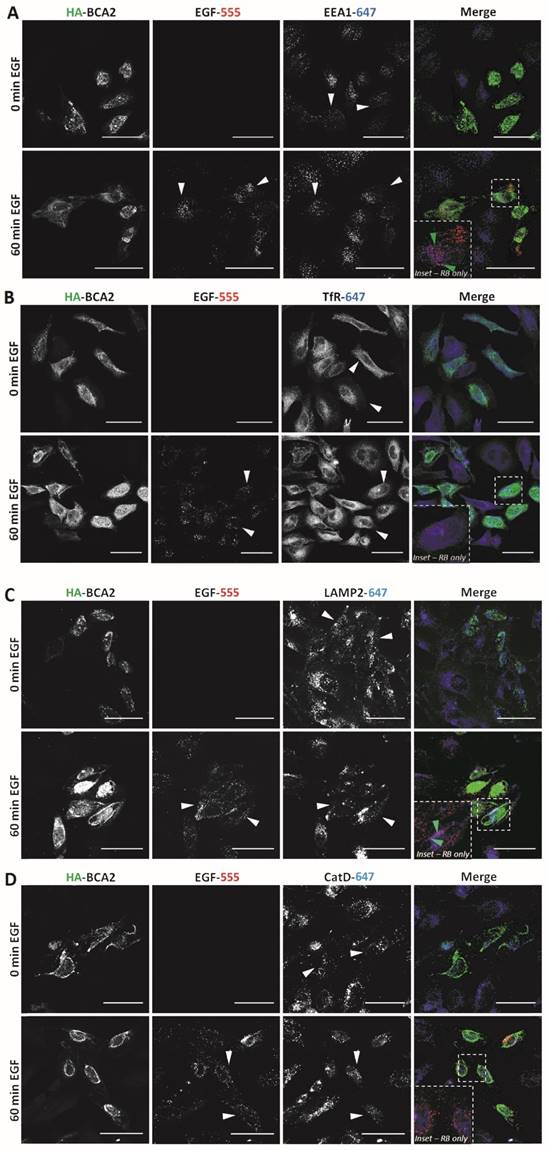
Having established that EGF degradation was delayed/impaired by HA-BCA2 over‑expression, we sought to determine which endocytic compartments the EGF was retained in at the 60 min time point. We also wanted to ascertain whether the endocytic profile of the transfected cells and/or the localization of BCA2 was altered in the EGF stimulated (and unstimulated cells). Following 60 min of serum starvation, HA-BCA2 over‑expressing HeLa cells were either incubated with EGF-555 or diluent control for 60 min. After fixation, double-immunofluorescence labeling was performed for HA and either EEA1 (early endosomes), TfR (recycling endosomes), LAMP2 (late endolysosomes) or cathepsin D (lysosomes). Figure 5A-D shows that in both unstimulated (0 min EGF) and EGF stimulated (60 min EGF) cells there were no significant alterations in the sub‑cellular localization or abundance of any of the immunolabelled endolysosomal compartments. HA-BCA2 localization remained heterogeneous in EGF stimulated and unstimulated cells: vesicles and cytoplasmic accumulations in a range of sizes and/or diffuse cytosolic labeling patterns were seen, as in Figure 2. After 60 min incubation, the signal from EGF-555 had largely been lost from untransfected cells, indicating degradation. In HA-BCA2 over‑expressing cells however, EGF-555 accumulation was detected in early (EEA1 positive) and late (LAMP2 positive) endosomal compartments (Fig. 5A and C red-blue channel merge [RB] insets). Little co-localisation was seen between EGF-555 and the cathepsin D positive and TfR containing compartments (Fig. 5B and D, RB-inset).
Endocytic profile of HA-BCA2 over-expressing HeLa cells ± EGF. HA-BCA2 transfected cells were incubated with 0.5 µg/mL Alexa-555 EGF (red) for 0 or 60 min before being fixed. A) Sequential immunolabeling of HA-BCA2 and EEA1 (early endosomes, blue). B) Co-incubation of Alexa-555 EGF and Tf-647 (recycling endosomes, blue) and immunolabeling for HA-BCA2. C) Sequential immunolabeling of HA-BCA2 and LAMP2 (late endosomes/lysosomes, blue). D) Sequential immunolabeling of HA-BCA2 and cathepsin D (lysosomes, blue). Scale bar = 50 µm. White arrowheads indicate examples of HA-BCA2 transfected cells. Inset is merge of red and blue channels to show co-localisation (purple) between endocytic markers and EGF. Green arrowheads indicate examples of co-localisation.
BCA2 over-expression alters downstream EGFR signalling in HeLa cells
Upon EGF binding and receptor dimerization, the intracellular domain of EGFR becomes phosphorylated. This initiates downstream activation of oncogenic signalling, predominantly via the MAPK and PI3K/Akt pathways. EGFR is internalized following activation and there is a strong body of evidence to indicate that it continues to signal from endosomes and that receptor internalization is required for some components of downstream signalling (35, 36). We therefore hypothesised that the BCA2 induced changes in EGFR trafficking and degradation might alter downstream signalling pathways. Three independent experiments were performed to test this hypothesis. HA-BCA2 or mock transfected HeLa cells were serum starved then stimulated with 20 ng/mL of EGF for 5 or 60 min before lysates were collected on ice. No baseline phosphorylation of EGFR was observed in unstimulated cells (data not shown) so a 5 min pulse of EGF was selected as the earliest time point. Cell lysates were probed for HA and a panel of signalling proteins: total EGFR and phosphorylated EGFR (pEGFR, Tyr1068), total AKT and phosphorylated Akt (pAKT, Ser473) and total ERK1/2 and phosphorylated ERK (pERK, Thr202/Tyr204). The complete panel of immunoblots shown in Figure 5A was achieved by stripping and re-probing of PVDF membranes cut into low and high molecular weight strips. Band intensities were quantified using ImageJ software and protein activation was determined by the ratio of phosphoprotein to total protein (Fig. 6B and C). Activation of EGFR was examined by normalizing pEGFR to total EGFR and to Akt. Total Akt also acted as a loading control for pEGFR and thus enabled further information to be obtained about the relative proportion of active EGFR while taking into account changes in total EGFR levels.
EGFR activation and signalling in HA-BCA2 over-expressing HeLa cells following. HA-BCA2 and mock transfected cells were serum starved for 60 min then stimulated with 20 ng/mL EGF for 5 or 60 min. Cell lysates were collected from three independent experiments. A) Western blotting was performed for EGFR, pEGFR (Tyr1068), AKT (Ser473), pAKT, ERK, pERK (Thr202/Tyr204) and HA. Band intensities were quantified using ImageJ software and are presented as the amount of pEGFR normalized to total EGFR, amount of pEGFR normalized to total AKT, amount of pAKT normalized to total AKT and amount of pERK normalized to total ERK. B) Relative amount of phosphorylated proteins at 5 min. C) Relative amount of phosphorylated proteins at 60 min. Error bars represent 95% confidence intervals. ** p ≤ 0.01. *** p ≤ 0.001.
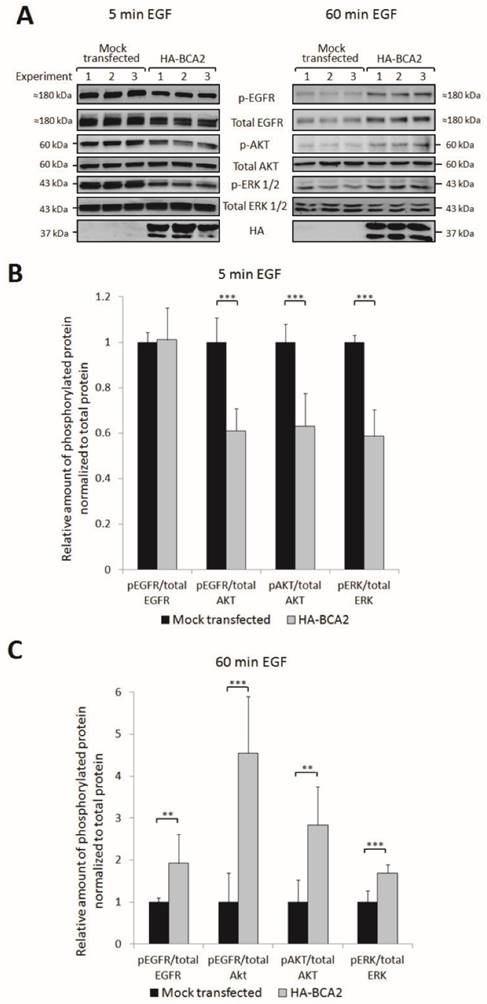
Quantification and student's independent two-tailed t-test of the immunoblotting data in Figure 6A revealed that after 5 min EGF stimulation there was a significant reduction in pEGFR, pAkt and pERK in BCA2 over-expressing HeLa cells compared with mock transfected controls (Fig. 6B). Conversely, after 60 min EGF stimulation, significantly more EGFR, Akt and ERK remained active in the BCA2 over-expressing cells compared with controls (Fig. 6C). Examining the ratios of pEGFR/total EGFR and pEGFR/total AKT we found that at 5 min the reduction in EGFR activation in HA-BCA2 over-expressing cells was proportional to the reduction in total receptor level. However, after 60 min of EGF stimulation, a greater proportion of the remaining EGFR was active in the HA-BCA2 over-expressing cells. Overall this suggests that BCA2 over-expression can influence the endocytic signalling and degradation of EGFR.
BCA2 over‑expression reduces HeLa cell viability
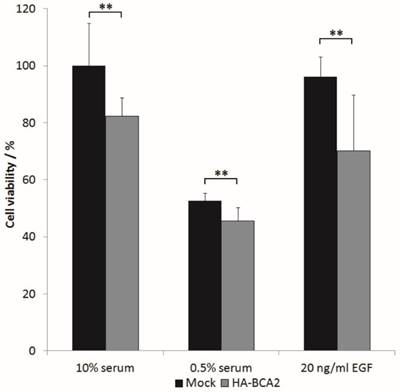
The above results indicated that BCA2 over‑expression elicited a downstream EGFR signalling response of reduced magnitude (at 5 min) but prolonged duration (at 60 min). We wondered whether these changes in signalling translated to changes in cell growth. HA-BCA2 or mock transfected HeLa cells were serum starved for 1 hr, prior to a further 48 h incubation in either reduced serum media (0.5% FBS), in media supplemented with 10% FBS or in reduced serum media supplemented with 20 ng/ml EGF. Cell viability was assessed using a Cell-titre blue assay. Data from three independent experiments conducted in triplicate were processed by converting mean fluorescence intensity values to “cell viability” as a percentage of mock-transfected controls grown in complete media (10% serum). The viability of HA-BCA2 over‑expressing cells was modestly but statistically significantly lower than control cells in all tested conditions (Figure 7).
The effect of BCA2 over-expression on the viability of transiently transfected HeLa cells. HA-BCA2 or Mock transfected cells were either serum-starved (0.5% FBS) or grown for 48 hr in the presence of 10% FBS or 20 ng/ml EGF in 0.5% serum-containing media. Cell viability was analyzed by CellTitre- Blue™ assay. Results from three independent, triplicate experiments were normalized to mock transfected control cells grown in FBS. Error bars represent 95% confidence intervals. ** p≤0.001.
The relationship between BCA2 and Rab7 in HeLa cells
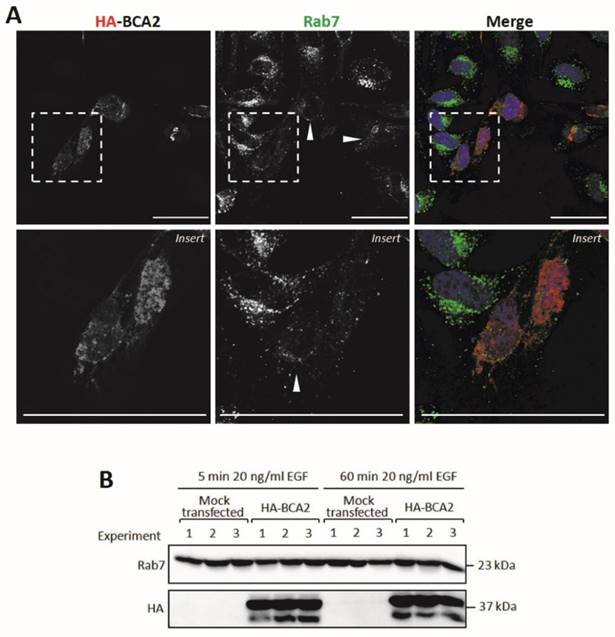
BCA2 and Rab7 have previously been shown to interact (13). We therefore decided to examine the sub-cellular localization of Rab7 in cells transiently transfected with HA-BCA2. These cells were sequentially labeled for Rab7 and HA and were then imaged by confocal microscopy. The untransfected cells featured perinuclear clusters of Rab7 positive vesicles whereas in HA-BCA2 over‑expressing cells we observed an overall reduction in Rab7 fluorescence and in the number of the Rab7 positive vesicles (Fig. 8A). Contrary to previous reports in the literature (13) we did not find evidence of co‑localization between the over-expressed BCA2 and Rab7 proteins.
Rab7 sub-cellular localization and expression levels in HA-BCA2 over-expressing HeLa cells. A) Confocal microscopy of HA-BCA2 (red) over-expressing cells following sequential immunlabeling for Rab7 (green) then HA (Red). Nuclei were stained with Hoechst (blue). Arrowheads indicate examples of HA-BCA2 transfected cells. Scale bars = 50 μm. B) Immunoblot showing Rab7 levels in mock transfected and HA-BCA2 over-expressing HeLa following EGF stimulation. HA-BCA2 and mock transfected cells were serum starved for 60 min then stimulated with 20 ng/mL EGF for 5 or 60 min. Cell lysates were prepared from three independent experiments (repurposed from experiment in Figure 6) and probed for HA and Rab7.
Others have previously reported co-localization between enhanced green fluorescence protein (EGFP) tagged Rab7 and BCA2 (13). We therefore examined the sub-cellular localization of HA-BCA2 and EGFP-Rab7 in transiently co-transfected cells. EGFP-Rab5, a marker of early endosomes with no reported links to BCA2, was studied in parallel. Whilst we observed some co-localization of BCA2 with EGFP-Rab7 in the perinuclear area, we also found that HA-BCA2 co‑localized with EGFP-Rab5 on peripheral vesicles (Supplementary Figure S3). Since we were unable to demonstrate the specificity of BCA2 and Rab7 co-localization with a dual over‑expression approach, no further experiments were performed using the EGFP-Rab constructs.
Rab proteins are delivered by chaperone proteins to membranes and interact with lipids via geranylgeranyl tails located at their C-terminus. (37). The reduction in vesicular Rab7 labeling seen in Figure 8A could have reflected a redistribution of Rab7 to the cytosol or alternatively a decrease in total Rab7 protein levels in the transfected cells. To distinguish between these two possibilities, Rab7 protein levels were examined in HA-BCA2 over‑expressing and mock transfected HeLa cells after 5 and 60 min EGF incubation, as described in Figure 6. The data in Figure 8B demonstrate that Rab7 levels were unchanged by HA-BCA2 over‑expression at either time point with EGF. This suggests that the loss of vesicular Rab7 seen by IF was the result of altered localization rather than a reduction in protein level.
Biomarker and survival analysis
KM Plotter (http://www.kmplot.com/) is an online analysis tool that integrates microarray expression data with clinical information from a large cohort of 10,188 patient samples: 4,142 breast, 1,648 ovarian, 2,437 lung and 1,065 gastric cancer patients. Users can examine the impact on survival of different levels of gene expression for over 50,000 target genes (30). For this study the data were split into high and low expressing groups and survival curves were generated across all breast, ovarian, lung and gastric cancers. Survival was also examined in breast cancer analyses restricted according to estrogen receptor (ER) status, molecular subtype and HER2 expression. The hazard ratio for survival with 95% confidence intervals and logrank P value were automatically calculated for low vs. high expression.
Survival curves generated with KM Plotter for high versus low BCA2 expression in breast cancer show that BCA2 significantly impacts on RFS in this disease and that survival effects are subtype dependant (Fig. 9).
Kaplan-Meier survival curves for high vs. low BCA2 mRNA expression in breast cancer created using KM Plotter (30). Probability of relapse free survival in high (red) or low (black) BCA2 expressing breast cancer is compared. A) Survival across all tumours. B) Survival in ER+ vs. ER- disease. C) Survival in HER2+ vs. HER2- disease. D) Survival stratified according to molecular subtype.
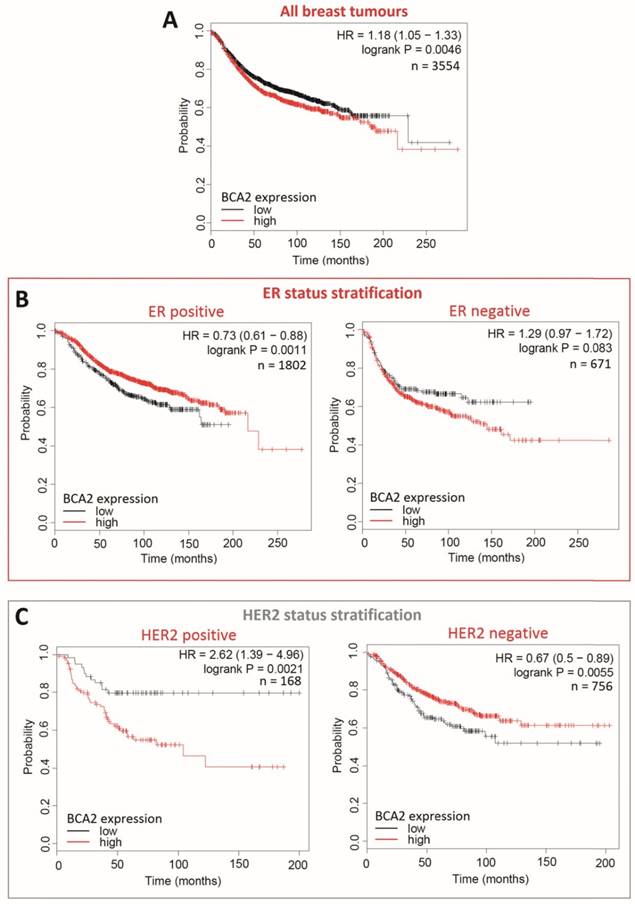
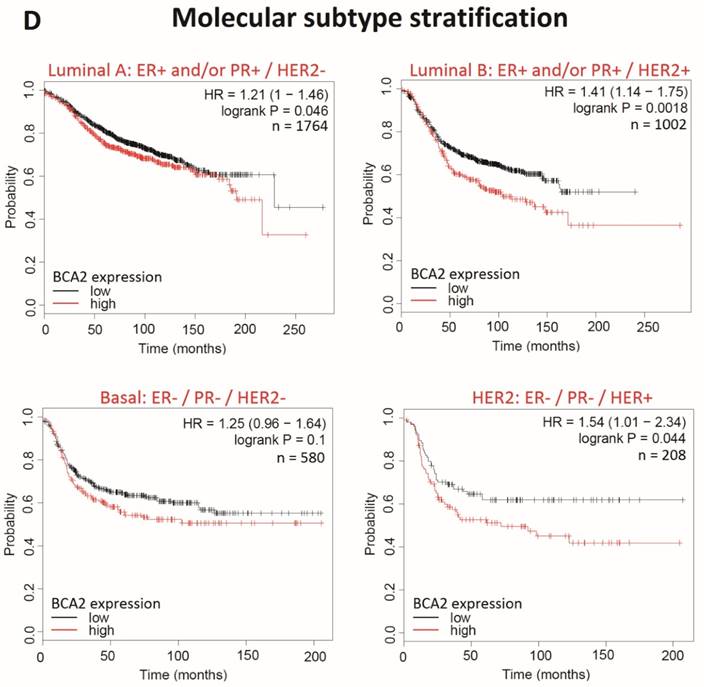
Plots for low versus high BCA2 expression show that breast cancers expressing high levels of BCA2 were associated with poorer prognosis: the hazard ratio (HR) for RFS across all tumours was 1.18, P=0.0046. Significantly reduced RFS was demonstrated in high BCA2 expressing breast cancers that were HER2 positive (HR=2.62, p=0.0021). In the HER2 over-expressing molecular subtypes luminal B and HER2, high BCA2 expression was also associated with reduced survival (Luminal B: HR=1.41, p=0.0018 and HER2: HR=1.54, p=0.044). Conversely, high levels of BCA2 in ER+ and HER2- disease were associated with improved patient prognosis (ER+: HR=0.73, p=0.0011 and HER-: HR=0.67, p=0.0055).
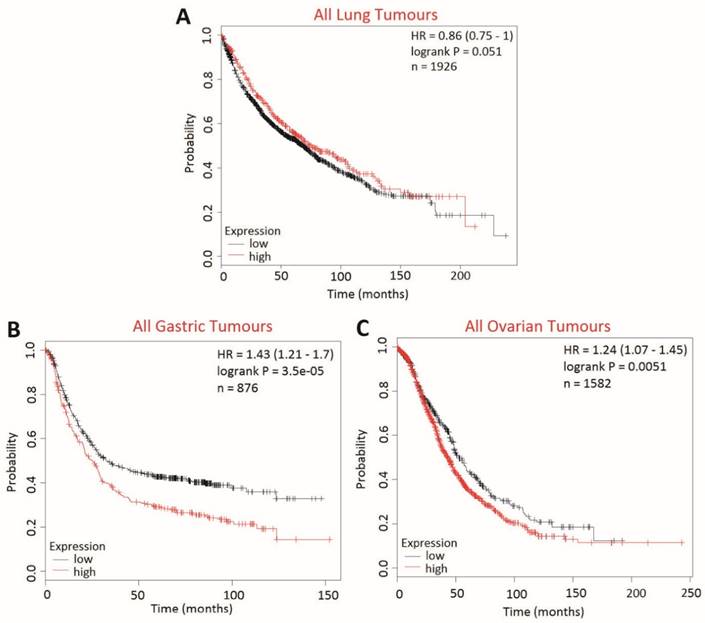
The effect of BCA2 on overall survival (OS) in lung, gastric and ovarian cancers was examined using KM Plotter to determine whether BCA2 was also a potential biomarker in cancers other than those of the breast (Fig. 10). High BCA2 expression was associated with poorer survival in gastric (HR=1.43, p=0.000035) and ovarian cancer (HR=1.24, p=0.0051). Conversely, high BCA2 expression appeared to be associated with increased overall survival in lung cancer, however, this narrowly missed reaching statistical significance (HR=0.86, p=0.051).
Kaplan-Meier survival curves for high vs. low BCA2 mRNA expression in lung, gastric and ovarian cancer created using KM Plotter (30). Probability of overall survival in high (red) or low (black) BCA2 expressing is compared in A) lung cancer B) gastric cancer and C) ovarian cancer.
Discussion
Our results here demonstrating that BCA2 over‑expression reduces total EGFR levels while inhibiting the receptor's degradation initially appear to be contradictory. Others have shown that EGFR degradation is inhibited by the BCA2-Rab7 interaction (13) and supporting a relationship between the two proteins we found that HA-BCA2 over‑expression appeared to induce a failure of Rab7 membrane association. siRNA depletion of Rab7 has been shown to reduce the lysosomal degradation of EGFR while inducing a concomitant decrease in total levels of the receptor (7, 9). Thus the strongest hypothesis to explain our data is that over‑expressed BCA2 sequesters Rab7 in the cytosol, preventing the GTPase from carrying out its endosomal function on the membrane. In this manner BCA2 over‑expression produces cellular effects analogous to Rab7 depletion. Sequestration of interacting proteins is a documented effect of transient over‑expression systems (38, 39).
The finding that BCA2 over‑expression inhibits EGFR trafficking is directly supported by some literature (13) but appears to be contrary to others (14, 15). Sakane and colleagues suggested that BCA2 over‑expression accelerates ligand induced EGFR degradation in cells transfected with BCA2 and EGFR (14). However, the HEK293 cell line used did not readily degrade EGFR in response to EGF stimulation: after three hours the receptor levels were only reduced to 80% in the mock-transfected control cells. A separate experiment was performed in which cells were transfected with BCA2 plus EGFR, ubiquitin and c-Cbl and here EGFR was extensively down-regulated in response to EGF stimulation. Under these conditions, EGFR degradation was inhibited in BCA2 over-expressing cells compared with control, just as we have shown in Figure 4. Supporting our Rab7 sequestration hypothesis were further data from this study showing that a BCA2 RING mutant produced a greater inhibitory effect on EGFR degradation than wild-type protein (14). The BCA2 RING mutant has been shown to lack E3-ligase (and autoubiquitination) activity (33) but, with an intact N-terminus, should still able to bind Rab7 (13). Enhanced inhibition of EGFR degradation by the RING mutant may therefore reflect intracellular accumulation of autoubiquination-deficient BCA2, leading to increased cytosolic sequestration of Rab7.
Another BCA2 study that invites comparison with our research, is that conducted by Smith et al. (15). As in our experiments, the relationship between BCA2 and EGFR trafficking was investigated in a HeLa cell model. An siRNA approach was used for the studies and BCA2 depletion was shown to delay EGFR degradation. EGFR activation was also examined and here the BCA2 siRNA increased EGFR phosphorylation and promoted association of EGFR with the signalling protein SHC1. We extend this work by showing novel downstream signalling effects in a BCA2 over‑expression system. Our findings indicate that EGF stimulation of BCA2 over‑expressing cells gives rise to a reduced but more prolonged signalling response in MAPK (ERK1/2) and Akt pathways. The consequences of such a signalling pattern are not fully resolved, though they may be connected to the reduced cell viability seen in Figure 7. Our findings in Figure 6 are supported by the persistence of EGF in the (EEA1 positive) early endosomes of HA-BCA2 over-expressing cells since EGFR is known to signal from this endocytic compartment (40).
BCA2 over‑expression (Figs. 4-7) and depletion (15) in the same cell line have now been shown to similarly influence EGFR trafficking. We hypothesise that in our studies BCA2 over‑expression produces a dominant negative phenotype, equivalent to that produced by protein depletion. This may be a result of disrupted stoichiometry between BCA2, Rab7 and/or other interactors, an effect reported in the literature for other over‑expressed proteins (38, 39).
Since caspase 3-mediated cleavage of EGFR has been shown to occur concomitantly with reduced receptor degradation during apoptosis (41), our data in Figures 3 to 7 could alternatively be explained by cytotoxicity induced by over‑expression e.g. by aggregate/aggresome formation. Aggresomes are cytoplasmic inclusions containing deposits of ubiquinated, often misfolded, proteins and are believed form when the production rate of aggregation-prone proteins exceeds proteasome capacity (42). Despite heterogeneity, the most commonly seen patterns of HA-BCA2 localization were large perinuclear and cytoplasmic inclusions. Such localization has also been seen in the literature (13, 27, 43) and may indicate a natural tendency for the protein to cluster and/or aggregate, especially at high expression levels. The accumulation of protein aggregates is known to affect cell signalling and to induce cytotoxicity (44, 45); it is a recognized potential limitation of transient transfection (46). The use of an inducible gene expression system, where the levels of BCA2 protein could be tuned, would potentially be more informative for further investigations.
In vitro data presented here and in the literature suggest that exogenous manipulation of BCA2 expression may have context-dependent effects on cancer cell survival. We found that over-expression of BCA2 was well tolerated by MCF-7 cells but not by MDA‑MB-231s. Interestingly, siRNA depletion of BCA2 has been shown to reduce cell growth in both the MCF-7 and MDA-MB-231 cell lines (17, 22), while pharmacological BCA2 inhibition results in differing cytotoxic effects: MCF-7 cells are sensitive to BCA2 inhibitors but MDA‑MB‑231 are not (18). The effect of BCA2 over‑expression on cell viability/proliferation has previously been examined in NIH3T3 mouse embryonic fibroblast cells and in these cells, proliferation was promoted by transfection with BCA2 (17). We, however, show a reduction in HeLa cell viability upon BCA2 over-expression. The difference between these viability findings could relate to inter-cell line variation in the expression of BCA2 partner proteins, RTKs and/or endocytic regulators. The cytotoxicity induced by BCA2 over-expression in HeLa cells is further evidence to support our hypothesis that over-expressing BCA2 produces a double negative phenotype that is akin to functional depletion of Rab7. siRNA depletion of Rab7 has been shown to promote cell death (9); sequestration of Rab7 by over-expressed BCA2 would therefore explain our findings. A network of the possible mechanisms linking BCA2 over‑expression with cell viability and EGFR regulation is presented in Supplementary Figure S4.
Whilst the cells in this study were engineered to artificially over-express BCA2, high expression levels of this protein have been observed in breast cancer patients. Further experiments in breast cancer cell models would need to be performed to determine whether/to what extent our findings in HeLa cells apply to breast cancer specifically.
In this study we have provided new in silico evidence that high levels of BCA2 may be associated with reduced relapse-free survival across all breast cancers. One previous study linked high levels of BCA2 to increased disease-free survival for regional recurrence and reduced lymph node metastasis (17). In this study by Burger et al. the relationship between BCA2 and the positive prognostic indicators was not thought to be a functional consequence of BCA2 expression. BCA2's association with reduced recurrence and metastasis was attributed to the high incidence of BCA2 upregulation in ER+ breast cancer, the most readily treatable form of the disease. Our data however suggest that BCA2 may in fact have an independent functional impact on breast cancer prognosis rather than simply a bystander correlation with other positive prognostic indicators. This can be inferred as a positive relationship between BCA2 expression and survival is apparent in the ER+ group following stratification. Interestingly in the ER- cohort BCA2 appears to impinge on prognosis, although this effect did not reach statistical significance.
The relationship between BCA2 expression and RFS in breast cancer has not been previously examined by subtype but was examined here. Our data indicated that high levels of BCA2 adversely affect survival in HER2 over-expressing cancers but was associated with better prognosis in HER2- disease. The relationship between BCA2 and HER2 is further evident as high BCA2 expression impinged on RFS in the HER2-type and luminal B type breast cancers, both of which express high levels of the HER2 oncoprotein. BCA2's apparent link with HER2 in breast cancer survival may actually relate to the role of BCA2 in EGFR regulation rather than reflecting a direct relationship with HER2. EGFR over-expression is most commonly seen in basal-type breast cancer but elevated levels of the receptor are often concomitant with HER2 positivity (47). Nonetheless a connection between BCA2 and HER2 has not been previously made in the literature and therefore may be a productive avenue for further research.
We extended our in silico studies to examining the relationship between BCA2 expression and overall patient survival in lung, gastric and ovarian cancer. We demonstrated a novel, anatomical-context dependent relationship between BCA2 expression and OS. High BCA2 expression was associated with poorer prognosis in gastric and ovarian cancers but was associated with better prognosis in lung cancer. Exploration of the mechanism/s connecting BCA2 and survival in other cancers is beyond the scope of this study. However, our findings add to the body of evidence that the role of BCA2 in cancer is contingent on the biological context.
Conclusions
The accumulated data from our studies suggest that BCA2 has an important, context dependent role as a prognostic biomarker in cancer with both positive and negative contributions. Our findings indicate that the protein has a regulatory function in the trafficking and expression of EGFR, impacting on the signalling and viability of cancer cells. Developing a deeper understanding of BCA2's context dependency will be essential for determining whether BCA2 is a potential therapeutic target in breast cancer.
Abbreviations
ANOVA: Analysis of variance; BCA: bicinchoninic acid; BCA2: Breast cancer associated gene 2; BSA: Bovine serum albumin; DMEM: Dulbecco's Modified Eagle Medium; DMEM/F12: Dulbecco's Modified Eagle Medium: Nutrient mixture F12; EEA1: Early endosome antigen 1; ECL: Enhanced Chemiluminescence; EGF: Epidermal growth factor; EGFP: Enhanced green fluorescence protein; EGFR: Epidermal growth factor receptor; ER: Estrogen receptor; FBS: Fetal bovine serum; HA: Haemaglutinin; HER2: Human epidermal growth factor receptor 2; IF: Immunofluorescence microscopy; LAMP1: Lysosomal-associated membrane protein 1; NaOH: sodium hydroxide; NaCl: Sodium chloride; NH4Cl: Ammonium chloride; OS: Overall survival; PBS: Phosphate buffered saline; PBST: Phosphate buffered saline containing 0.025% Tween20; PFA: Paraformaldehyde; PVDF: Polyvinylidene fluoride; RB-inset: Red-blue channel merge inset; RFS: Relapse free survival; RPMI: Roswell Park Memorial Institute media; RTK: Receptor tyrosine kinase; SFM: Serum free media; Tf: Transferrin; TfR: Transferrin receptor.
Supplementary Material
Supplementary figures and method.
Acknowledgements
Funding is acknowledged from a Cancer Research UK studentship (C36040/A11652) awarded to ATJ, ADW, SH and JMW.
Competing interests
The authors have declared that no competing interest exists.
References
1. Bolla M, Chedin M, Souvignet C, Marron J, Arnould C, Chambaz E. Estimation of epidermal growth factor receptor in 177 breast cancers: correlation with prognostic factors. Breast cancer research and treatment. 1990;16(2):97-102
2. Slamon DJ, Godolphin W, Jones LA, Holt JA, Wong SG, Keith DE. et al. Studies of the HER-2/neu proto-oncogene in human breast and ovarian cancer. Science. 1989;244(4905):707-12
3. Rimawi MF, Shetty PB, Weiss HL, Schiff R, Osborne CK, Chamness GC. et al. Epidermal growth factor receptor expression in breast cancer association with biologic phenotype and clinical outcomes. Cancer. 2010;116(5):1234-42
4. Nicholson R, Hutcheson I, Jones H, Hiscox S, Giles M, Taylor K. et al. Growth factor signalling in endocrine and anti-growth factor resistant breast cancer. Reviews in endocrine & metabolic disorders. 2007;8(3):241-53
5. Sorkin A, von Zastrow M. Endocytosis and signalling: intertwining molecular networks. Nature reviews molecular cell biology. 2009;10(9):609-22
6. Jovic M, Sharma M, Rahajeng J, Caplan S. The early endosome: a busy sorting station for proteins at the crossroads. Histology and histopathology. 2010;25(1):99
7. Vanlandingham PA, Ceresa BP. Rab7 regulates late endocytic trafficking downstream of multivesicular body biogenesis and cargo sequestration. Journal of Biological Chemistry. 2009;284(18):12110-24
8. Yarden Y. The EGFR family and its ligands in human cancer: signalling mechanisms and therapeutic opportunities. European journal of cancer. 2001;37:3-8
9. Wang T, Zhang M, Ma Z, Guo K, Tergaonkar V, Zeng Q. et al. A role of Rab7 in stabilizing EGFR-Her2 and in sustaining Akt survival signal. Journal of Cellular Physiology. 2011
10. Torres VA, Mielgo A, Barbero S, Hsiao R, Wilkins JA, Stupack DG. Rab5 mediates caspase-8-promoted cell motility and metastasis. Molecular biology of the cell. 2010;21(2):369-76
11. Peschard P, Fournier TM, Lamorte L, Naujokas MA, Band H, Langdon WY. et al. Mutation of the c-Cbl TKB domain binding site on the Met receptor tyrosine kinase converts it into a transforming protein. Molecular cell. 2001;8(5):995-1004
12. Bao J, Gur G, Yarden Y. Src promotes destruction of c-Cbl: implications for oncogenic synergy between Src and growth factor receptors. Proceedings of the National Academy of Sciences. 2003;100(5):2438-43
13. Mizuno K, Kitamura A, Sasaki T. Rabring7, a novel Rab7 target protein with a RING finger motif. Molecular biology of the cell. 2003;14(9):3741-52
14. Sakane A, Hatakeyama S, Sasaki T. Involvement of Rabring7 in EGF receptor degradation as an E3 ligase. Biochemical and biophysical research communications. 2007;357(4):1058-64
15. Smith CJ, Berry DM, McGlade CJ. The E3 ubiquitin ligases RNF126 and Rabring7 regulate endosomal sorting of the epidermal growth factor receptor. Journal of cell science. 2013;126(6):1366-80
16. Burger A, Amemiya Y, Kitching R, Seth AK. Novel RING E3 ubiquitin ligases in breast cancer. Neoplasia (New York, NY). 2006;8(8):689
17. Burger AM, Gao Y, Amemiya Y, Kahn HJ, Kitching R, Yang Y. et al. A novel RING-type ubiquitin ligase breast cancer-associated gene 2 correlates with outcome in invasive breast cancer. Cancer research. 2005;65(22):10401
18. Brahemi G, Kona FR, Fiasella A, Buac D, Soukupová J, Brancale A. et al. Exploring the structural requirements for inhibition of the ubiquitin E3 ligase breast cancer associated protein 2 (BCA2) as a treatment for breast cancer. Journal of medicinal chemistry. 2010;53(7):2757-65
19. Burger AM, Kona F, Amemiya Y, Gao Y, Bacopulos S, Seth AK. Role of the BCA2 ubiquitin E3 ligase in hormone responsive breast cancer. The open cancer journal. 2010;3(1):116
20. Wang Z, Nie Z, Chen W, Zhou Z, Kong Q, Seth AK. et al. RNF115/BCA2 E3 ubiquitin ligase promotes breast cancer cell proliferation through targeting p21Waf1/Cip1 for ubiquitin-mediated degradation. Neoplasia (New York, NY). 2013;15(9):1028
21. Kona FR, Stark K, Bisoski L, Buac D, Cui Q, Dou QP. Transcriptional activation of breast cancer-associated gene 2 by estrogen receptor. Breast Cancer Research and Treatment. 2012:1-9
22. Buac D, Kona FR, Seth AK, Dou QP. Regulation of metformin response by Breast Cancer Associated Gene 2. Neoplasia. 2013;15(12):1379-IN12
23. Michailidou K, Beesley J, Lindstrom S, Canisius S, Dennis J, Lush MJ. et al. Genome-wide association analysis of more than 120,000 individuals identifies 15 new susceptibility loci for breast cancer. Nature genetics. 2015;47(4):373-80
24. Lee Y-H, Sun Y, Gerweck LE, Glickman RD. Regulation of DNA damage response by estrogen receptor β-mediated inhibition of Breast Cancer Associated Gene 2. Biomedicines. 2015;3(2):182-200
25. Simpson JC, Griffiths G, Wessling-Resnick M, Fransen JA, Bennett H, Jones AT. A role for the small GTPase Rab21 in the early endocytic pathway. Journal of cell science. 2004;117(26):6297-311
26. Tang WYY, Beckett AJ, Prior IA, Coulson JM, Urbé S, Clague MJ. Plasticity of mammary cell boundaries governed by EGF and actin remodeling. Cell reports. 2014;8(6):1722-30
27. Miyakawa K, Ryo A, Murakami T, Ohba K, Yamaoka S, Fukuda M. et al. BCA2/Rabring7 promotes tetherin-dependent HIV-1 restriction. PLoS Pathogens. 2009;5(12):e1000700
28. Cumming G, Fidler F, Vaux DL. Error bars in experimental biology. The Journal of Cell Biology. 2007;177(1):7-11
29. Ringnér M, Fredlund E, Häkkinen J, Borg Å, Staaf J. GOBO: gene expression-based outcome for breast cancer online. PloS one. 2011;6(3):e17911
30. Gyorffy B, Lanczky A, Eklund A, Denkert C, Budczies J, Li Q. et al. An online survival analysis tool to rapidly assess the effect of 22,277 genes on breast cancer prognosis using microarray data of 1809 patients. Breast Cancer Res Treatment. 2010;123(3):725-31
31. Li Q, Birkbak NJ, Gyorffy B, Szallasi Z, Eklund AC. Jetset: selecting the optimal microarray probe set to represent a gene. BMC bioinformatics. 2011;12(1):474
32. Bacopulos S, Amemiya Y, Yang W, Zubovits J, Burger A, Yaffe M. et al. Effects of partner proteins on BCA2 RING ligase activity. BMC cancer. 2012;12(1):63
33. Amemiya Y, Azmi P, Seth A. Autoubiquitination of BCA2 RING E3 ligase regulates its own stability and affects cell migration. Molecular Cancer Research. 2008;6(9):1385
34. Roepstorff K, Grandal MV, Henriksen L, Knudsen SLJ, Lerdrup M, Grøvdal L. et al. Differential effects of EGFR ligands on endocytic sorting of the receptor. Traffic. 2009;10(8):1115-27
35. Vieira AV, Lamaze C, Schmid SL. Control of EGF receptor signaling by clathrin-mediated endocytosis. Science. 1996;274(5295):2086-9
36. Wang Y, Pennock S, Chen X, Wang Z. Endosomal signaling of epidermal growth factor receptor stimulates signal transduction pathways leading to cell survival. Molecular and cellular biology. 2002;22(20):7279-90
37. Pfeffer S, Aivazian D. Targeting Rab GTPases to distinct membrane compartments. Nature reviews molecular cell biology. 2004;5(11):886-96
38. Sopko R, Huang D, Preston N, Chua G, Papp B, Kafadar K. et al. Mapping pathways and phenotypes by systematic gene overexpression. Molecular cell. 2006;21(3):319-30
39. Prelich G. Gene overexpression: uses, mechanisms, and interpretation. Genetics. 2012;190(3):841-54
40. Burke P, Schooler K, Wiley HS. Regulation of epidermal growth factor receptor signaling by endocytosis and intracellular trafficking. Molecular biology of the cell. 2001;12(6):1897-910
41. He Y, Huang J, Chignell C. Cleavage of epidermal growth factor receptor by caspase during apoptosis is independent of its internalization. Oncogene. 2005;25(10):1521-31
42. Johnston JA, Ward CL, Kopito RR. Aggresomes: a cellular response to misfolded proteins. The Journal of cell biology. 1998;143(7):1883-98
43. Nityanandam R, Serra-Moreno R. BCA2/Rabring7 targets HIV-1 gag for lysosomal degradation in a tetherin-independent manner. PLoS pathogens. 2014;10(5):e1004151
44. Bucciantini M, Giannoni E, Chiti F, Baroni F, Formigli L, Zurdo J. et al. Inherent toxicity of aggregates implies a common mechanism for protein misfolding diseases. Nature. 2002;416(6880):507-11
45. Rodriguez-Gonzalez A, Lin T, Ikeda AK, Simms-Waldrip T, Fu C, Sakamoto KM. Role of the aggresome pathway in cancer: targeting histone deacetylase 6-dependent protein degradation. Cancer research. 2008;68(8):2557-60
46. Feller SM, Lewitzky M. Very 'sticky' proteins-not too sticky after all. Cell Commun Signal. 2012;10:15
47. Rimawi M, Weiss H, Bhatia P, Chamness G, Elledge R. EGFR expression in breast cancer: association with biologic phenotype, prognosis, and resistance to adjuvant therapy. ASCO Annual Meeting Proceedings. 2006
48. He Y, Huang J, Chignell C. Cleavage of epidermal growth factor receptor by caspase during apoptosis is independent of its internalization. Oncogene. 2005;25(10):1521-31
49. Rush JS, Quinalty LM, Engelman L, Sherry DM, Ceresa BP. Endosomal accumulation of the activated epidermal growth factor receptor (EGFR) induces apoptosis. Journal of biological chemistry. 2012;287(1):712-22
Author contact
![]() Corresponding author: jonesatac.uk
Corresponding author: jonesatac.uk