Impact Factor ISSN: 1837-9664

 Global reach, higher impact
J Cancer 2016; 7(14):1984-2004. doi:10.7150/jca.16244 This issue Cite
Review
Role of Urinary Biomarkers in the Diagnosis of Adenoma and Colorectal Cancer: A Systematic Review and Meta-Analysis
Emma Altobelli1,2 ![]() , Paolo Matteo Angeletti1, Giovanni Latella1,3
, Paolo Matteo Angeletti1, Giovanni Latella1,3
1. Department of Life, Health and Environmental Sciences, University of L'Aquila, L'Aquila, Italy
2. Epidemiology and Biostatistics Unit, AUSL Teramo, University of L'Aquila, L'Aquila, Italy.
3. Gastroenterology Unit, Department of Life, Health and Environmental Sciences, University of L'Aquila, L'Aquila, Italy
Received 2016-5-20; Accepted 2016-7-16; Published 2016-10-8
Abstract
The growing interest in enhancing and spreading colorectal cancer (CRC) screening has been stimulating the exploration of novel biomarkers with greater sensitivity and specificity than immunochemical faecal occult blood test (iFOBT). The present study provides i) a systematic review of the urinary biomarkers that have been tested to achieve early CRC diagnosis and assess the risk of colorectal adenoma and adenocarcinoma, and ii) a meta-analysis of the data regarding the urinary prostaglandin (PG) metabolite PGE-M.
As regard to gene markers, we found significantly different percent methylation of the vimentin gene in CRC patients and healthy controls (HC) (p<0.0001). Respect to metabolism of nitrogenous bases, cytidine, 1-methyladenosine, and adenosine, have higher concentrations in CRC patients than in HC (respectively, p<0.01, p=0.01, and p<0.01). As regard to spermine we found that N1,N12 diacetyl spermine (DiAcSpm) and N1, N8 diacetylspermidine (DiAcSpd) were significantly higher in CRC than in HC (respectively p=0.01 and p<0.01). Respect to PGE-M, levels were higher in CRC than in those with multiple polyposis (p<0.006) and HC subjects (p<0.0004). PGE-M seems to be the most interesting and promising urinary marker for CRC and adenoma risk assessment and for CRC screening.
In conclusion, evidence suggests that urinary biomarker could have a potential role as urinary biomarkers in the diagnosis of colorectal cancer. Particularly, PGE-M seems to be the most promising urinary marker for CRC early detection.
Keywords: Colorectal adenoma and cancer, early detection, urinary biomarkers, prostaglandins, meta-analysis
Introduction
Colorectal cancer (CRC) is a highly common malignant tumour; it has been estimated that 1.13 million new CRC cases are diagnosed every year and that CRC causes about 694,000 deaths per year [1,2]. CRC has become a major public health concern, because despite treatment as many as half of patients die from the disease [3]. One reason for such high mortality rate is that CRC is a silent disease, since specific signs such as bleeding and abdominal pain often arise only in patients with advanced tumour stages [4]; as a result, Dukes' stage C is found at diagnosis in half of the patients, whose 5 year survival is <50% [5-7]. CRC is sporadic in 90% of patients; in <10% it is inherited [8,9] or is a complication of inflammatory bowel disease, either ulcerative colitis or Crohn's disease [10-12]. Even though treatment approaches have considerably improved over the past decade, they have not exerted commensurate effects on outcomes or survival of patients with advanced disease. Moreover, they have induced a steep rise in treatment cost. Several modelling studies have demonstrated that a number of screening strategies are cost-saving [13]. In the majority of cases, CRC develops from a preclinical benign precursor, adenoma; progression from early adenoma to invasive cancer takes years [14, 15]. High incidence, protracted preclinical phase, recognisable and treatable precursor, high cost of treatment, and correlation of mortality with disease stage make CRC highly suitable for population screening [16, 17].
Faecal occult blood test (FOBT) has shown several limitations as an early diagnosis tool [18]. The growing interest in enhancing and spreading CRC screening has been stimulating the exploration of novel biomarkers with greater sensitivity (SE) and specificity (SP) than the gold standard (immunochemical FOB test [iFOBT]) and capable of being detected in blood [19], stools and urine [20-22]. Some studies have compared the values obtained with urinary and serum markers [23] and others have compared these with the FOBT [24], thus increasing their diffusion and the interest in developing laboratory techniques capable of detecting specific molecules. Several markers have been vetted, including nucleosides [25], the methylation level of specific genes [23,24], species deriving from oxidative stress [26], spermine concentration [27-29], and enzyme activities [30,31]. In the past decade, urinary prostaglandins (PG) have been examined as possible early markers of high-risk adenoma (HRA) [32-35]and adenocarcinoma [35, 36].
The present study provides: i) a systematic review of the urinary biomarkers that have been tested to achieve early CRC diagnosis and assess the risk of colorectal adenoma and adenocarcinoma, and ii) a meta-analysis of the data regarding the urinary prostaglandin (PG) metabolite PGE-M.
Material and methods
Relevant studies were identified using MEDLINE, EMBASE, Scopus, Clinicaltrial.gov, Web of Science, and Cochrane Library searches up to August 2015. The search strategy used the following terms: Urinary Biomarkers AND Colorectal Cancer; Urinary Biomarkers AND Colorectal Tumour; Urinary Biomarkers AND Colorectal Adenoma; Biomarkers AND Urine AND Colorectal cancer; Biomarkers AND Urine AND Colorectal tumour; Biomarkers AND Urine AND Colorectal neoplasm; Biomarkers AND Urine AND Colorectal adenoma. Papers were selected using the PRISMA checklist [37]. A manual search was also made. Only studies in English published in the previous 10 years were included. The references of all studies were screened by two independent reviewers (PMA and GL); a methodologist (EA) resolved any disagreements. Inclusion criteria were adult clinical studies and investigations of urinary biomarkers of CRC, including case-control, nested case-control, and early detection studies. Exclusion criteria were in vitro studies, studies validating laboratory techniques, prognostic studies and studies published as proceedings.
The general characteristics of the papers thus selected are summarised in table 1. The odds ratio (OR), reported in the studies, are listed in table 2. The SE, SP, positive (PPV) and negative predictive value (PNV), and receiver operating characteristic (ROC) curves of all urinary markers examined are shown in table 3.
Characteristics of included studies
| Reference Year | Biomarkers and Laboratory | Study Population | Differences between groups | Epidemiological analysis | |
|---|---|---|---|---|---|
| Sample Size | Characteristics of groups | ||||
| GENETIC MARKERS | |||||
Amiot et al (2014)23 | Vimentin Methylation | 247 | Diagnostic Early detection: two groups | Vimentin % OF METHYLATION HC 0% vs CRC 8% (p=0.57) | Specificity |
| ALX-4 Methylation | No. of patients by group, sex, mean age and SD (y) | ALX 4 % OF METHYLATION HC 0% vs CRC 15% (p=0.33) | Sensibility | ||
| Wif-1 Methylation | Group 1: CRC: No.= 90, 53 M, 37 F, 56.6 ± 11.3 (y) | Wif 1% OF METHYLATION HC 1.3% vs CRC 10.5 (p<0.001) | ROC curve | ||
| Laboratory: PCR | Group 2: HC: No.= 157, 76 M, 81 F, 68.3 ± 10.5 (y) | (see table 3 for details) | |||
Song et al (2012)75 | Vimentin Methylation | 40 | Case control: two groups | Vimentin % OF METHYLATION | - |
| Laboratory: MethyLight PCR | No. of patients by group, sex, mean age (y) | HC 10% vs CRC 75% (p<0.0001) | |||
| Group 1: CRC: No.= 20, 14 M, 6 F, 60.45 (y) | |||||
| Group 2: HC No.= 20, 8 M, 12 F, 73.8 (y) | |||||
Xiao et al (2014)22 | NDRG4 Methylation | 103 | Diagnostic Early detection: two groups | NDRG4 % OF METHYLATION | Specificity |
| Laboratory: Nested methylation-specific polymerase chain reaction | No. of patients by group, sex, median age and range (y) | 72.4% of positive methylated gene | Sensibility | ||
| Group 1: CRC: No.= 87, 52 M, 35 F, 56 (38-73) y | ROC curve | ||||
| Group 2: HC: No.= 16, 9 M, 6 F, 55.6 (40-74) (y) | (see table 3 for detail) | ||||
| METABOLITES OF NITROGENOUS BASES | |||||
Rozalski et al (2015)76 | 143 | Diagnostic Early detection: three groups | Specificity | ||
| No. of patients by group, sex, median age (y) | Sensibility | ||||
| 8-oxo-7,8-dihydro-2'-deoxyguanosine | Group 1: Adenomas No.=15, 8 M 7 F, 66 (y) | Mean levels of 8-oxoGua ± SD (nmol/mmol creatinine) CRC: 8.25 ± 10.22 HC: 4.58 ± 3.55 (p=0.00017) | ROC curve | ||
| 8-oxo-7,8-dihydroguanine | Group 2: CRC No.= 56, 32 M 24 F, 65 (y) | Mean levels of 8-oxoGuo ± SD CRC: 2.47 ± 1.31 HC: 1.79 ± 0.58 (p=0.008) | (see table 3 for detail) | ||
| 5-hydroxymethyluracil | Group 3: HC No. 72, 30 M 42F, 54 (y) | Mean levels of 5-hmUra± SD CRC: 5.61± 1.82 HC: 6.65 ± 1.75 (p=0.005) | |||
Laboratory: HPLC GC/MS | |||||
| Hsu et al (2013)24 | 71 | Diagnostic Early detection: two groups | Nucleoside concentration in urine (nmol/ creatinine) mean and SD | ||
| No. of patients by group, sex, mean age and SD (y) | Specificity | ||||
| Cytidine | Group 1: CRC: No.= 26, 12 M, 14 F, 65.30 ± 14.04 (y) | Cytidine HC 1.25 ±0.83 vs CRC 2.08 ± 1.35 (p<0.01) | Sensibility | ||
| 3-Methylcytidine | Group 2: Breast cancer: No.= 36, all females, age not reported | 3-Methylcytidine HC 0.81 ±0.27 vs CRC 0.86 ± 0.55 (p=0.55) | (see table 2 for detail) | ||
| 1-Methyladenosine | Group 3: Lung cancer: No.= 31, 16 M, 11 F, 60.68 ± 10.58 (y) | 1-methyladenosine HC 1.25 ±0.83 vs CRC 9.71 ± 5.42 (p=0.01) | |||
| 2-Deoxyguanosine | Group 4: HC No.= 18, sex not reported, age not reported | 2-Deoxyguanosine HC 0.15 ±0.13 vs CRC 0.15 ± 0.19 (p=0.45) | |||
| Adenosine | Adenosine HC 1.25 ±0.83 vs CRC 5.97 ± 3.4 (p<0.01) | ||||
| Inosine | Inosine HC 0.3 ±0.32 vs CRC 0.3 ± 0.33 (p=0.78) | ||||
| Laboratory: HPLC MS | |||||
Cheng et al (2012)105 | Citrate | 204 | Diagnostic Early detection: two groups | Not reported | ROC curve |
| Hippurate | No. of patients by sex, median age and range (y) | (see table 3 for detail) | |||
| P-cresol | Group 1: CRC: No.= 101, 58 M , 43 F, 60 (24-83) (y) | ||||
| 2-aminobutyrate | Group 2 : HC: No.=103, 31 M, 72 F, 58 (31-76) (y) | ||||
| Myristate | |||||
| Putrescine | |||||
| Kynurenate | |||||
| Laboratory: GT-TOFL | |||||
Feng et al (2005)77 | 114 | Diagnostic Early detection: two groups | Nucleoside concentration in urine (nmol nucleoside/ μmol creatinine) median [IQR] | ||
Adenosine | No. of patients for group, sex, median age and range (y) | Adenosine HC 0.51 [0.20] vs CRC 0.66 [0.72)] (p<0.01) | Sensivity | ||
| Pseudouridine | Pseudouridine HC 22.74 [6.86] vs CRC 39.63 [31.09] (p<0.01) | Sensibility | |||
| N4-acetylcytidine | Group 1: CRC: No.= 52, 27 M, 25 F, 63 (26-87) (y) | N4-acetylcytidine HC 0.66 [0.23] vs CRC 0.85 [0.41] (p<0.01) | ROC curve | ||
| Cytidine | Group 2: HC: No.= 62, 33 M, 29 F, 59 (24-78) (y) | Cytidine HC 0.14 [0.14] vs CRC 0.3 [0.25] (p<0.01) | (see table 3 for detail) | ||
| Guanosine | Guanosine HC 0.09 [0.04] vs CRC 1.37 [0.06] (p=0.268) | ||||
| Inosine | Inosine HC 0.29 [0.18] vs CRC 0.43 [0.27] (p<0.01) | ||||
| 1-methylinosine | 1-methylinosine HC 1.19 [0.37] vs CRC 2.16 [1.57] (p<0.01) | ||||
| 1-methladenosine | 1-methyladenosine HC 2.03 [6.86] vs CRC 2.76 [1.18] (p<0.01) | ||||
| 1-methylguanosine | 1-methylguanosine HC 0.79 [0.29] vs CRC 1.37 [0.70] (p<0.01) | ||||
| 2,2-methylguanosine | 2,2-methylguanosine HC 1.23 [0.37] vs CRC 1.71 [0.77] (p<0.01) | ||||
| 2-methylguanosine | 2--methylguanosine HC 1.25 [0.23] vs CRC 1.11 [0.55] (p<0.01) | ||||
| N6-methyladenosine | N6-methylguanosine HC 0.03 [0.03] vs CRC 0.04 [0.77] (p=0.023) | ||||
| 3 methyluridine + 5-methyluridine, | 3-methyluridine +5-methyluridine HC 0.01 [0.07] vs CRC 0.11 [0.09] (p<0.01) | ||||
| Uridine | Uridine HC 0.89 [0.18] vs CRC 0.29 [0.18] (p=0.869) | ||||
| (**) | |||||
Zheng et al (2005)78 | 112 | Two groups | Nucleoside concentration in urine (nmol nucleoside/ μmol creatinine) Mean, SD | ||
| No. of patients for group, sex, median age and range (y) | |||||
| Adenosine | Group 1: CRC: No.= 52, 29 M, 23 F, 60 (26-87) (y) | Adenosine HC 0.52 ± 0.16 vs CRC 0.66 ± 0.30 (p<0.05) | |||
| Pseudouridine | Group 2: HC: No.= 60, 31 M, 29 F, 52 (21-71) (y) | Pseudouridine HC 22.08 ± 5.11 vs CRC 42.19 ± 22.25 (p<0.05) | |||
| N4-acetylcytidine | N4-acetylcytidine HC 0.69 ± 0.20 vs CRC 0.84 ± 0.30 (p<0.05) | ||||
| Cytidine | Cytidine HC 0.15 ± 0.12 vs CRC 0.43 ± 0.49 (p<0.05) | ||||
| Guanosine | Guanosine HC 0.09± 0.03 vs CRC 0.10 ± 0.04 p= Not statistically significant | ||||
| Inosine | Inosine HC 0.28 ± 0.11 vs CRC 0.50 ± 0.35 (p<0.05) | ||||
| 1-Methladenosine | 1-Methyladenosine HC 2.04 ± 0.53 vs CRC 2.74 ± 0.80 (p<0.05) | ||||
| 1-Methylguanosine | 1-Methylguanosine HC 0.82 ± 0.24 vs CRC 1.44 ± 0.51 (p<0.05) | ||||
| 1-Methylinosine | 1-Methylinosine HC 1.25 ± 0.28 vs CRC 2.76 ± 1.94 (p<0.05) | ||||
| N2-methylguanosine | N2-methylguanosine HC 0.55 ± 0.14 vs CRC 0.63 ± 0.26 (p<0.05) | ||||
| N6-Methyladenosine | N6-Methyladenosine HC 0.04 ± 0.02 vs CRC 0.07 ± 0.05 (p<0.05) | ||||
| 2,2-Methylguanosine | 2,2-methylguanosine HC 1.25 ± 0.23 vs CRC 1.81 ± 0.55 (p<0.05) | ||||
| 3 methyluridine + 5-methyluridine | 3 methyluridine + 5-methyluridine HC 0.04 ± 0.06 vs CRC 0.13 ± 0.08 (p<0.05) | ||||
| Uridine | Uridine HC 0.30 ± 0.15 vs CRC 0.31 ± 0.23 p= Not statistically significant | ||||
| Laboratory: HPLC | |||||
| EZIMATIC ACTIVITY MARKERS | |||||
Niu et al (2012)29 | Arylsulfatase | 516 | Diagnostic Early detection: three groups | Arylsulfatase activity (U/L, 1U=1μmol/min) mean, SD | Specificity |
| Laboratory: Enzimatic Activity | No. of patients by sex, median age, range (y) | Male Group: | Sensibility | ||
| Group 1: CRC: No.= 119, 71 M, 63 (30-82) (y), 48 F, 66 (34-82) (y) | HC 0.17 ± 0.09 | VVP | |||
| Group 2: Benign tumor: No.= 97, 49 M, 57 (34-88) y, 48 F, 53 (30-82) (y) | Benign tumor 0.18 ± 0.11 | VPN | |||
| Group 3: HC: No.= 300, 137 M, 53 (30-85) (y), 163 F, 54 (30-85) (y) | CRC 0.45 ± 0.25 | ROC curve | |||
| comparison between groups (p <0.0001) | (see table 3 for detail) | ||||
| Female Group | |||||
| HC 0.12 ± 0.07 | |||||
| Benign tumor 0.19 ± 0.11 | |||||
| CRC 0.45 ± 0.35 (p <0.0001 for both groups) | |||||
Szajda et al (2009)30 | Hex | 58 | Diagnostic Early detection: three groups | Enzymatic activity (pKat/mL) Mean and DS | Specificity |
| HexA | No. of patients by sex, mean age ,range and SD (y) | Sensibility | |||
| HexB | Group 1: Total CRC subjects: No.= 38, 16 M, 22 F, 68.18 ± 14.63 (y) divided into two groups | ROC curve | |||
| Adenocarcinoma: No.= 32, sex not reported, age not reported | Control Group | (see table 3 for detail) | |||
| HEX 143.26 ± 58.86 | |||||
| HEX A 51.54 ± 34.45 | |||||
| HEX B 91.73 ± 34.09 | |||||
| Adenocarcinoma mucinosum: No.= 6, sex not reported, age not reported | (p=0.00643) | ||||
| Group 2: HC: No.= 20, 11 M, 9 F, 63.35 (51-78) ± 10.74 (y) | |||||
| Adenocarcinoma group | |||||
| HEX 376.55 ± 277.52 | |||||
| HEX A 185.55 ± 133.58 | |||||
| HEX B 191.70 ± 173.05 | |||||
| (p=0.86005) | |||||
| Adenocarcinoma mucinosum | |||||
| HEX 187.30 ± 136.14 | |||||
| HEX A 94.90 86.85 | |||||
| HEX B 92.40 ± 43.95 | |||||
| (p=0.87334) | |||||
| CEA | |||||
El-Masry et al (2007)79 | CEA | 298 | Eight groups | Not Reported differences between groups | Sensibility |
| No. of patients by group, sex, mean,SD (y) | PPV | ||||
| Group 1: Liver: No.= 20, 12 M, 8 F, 56.55 ± 6.85 (y) | NPV | ||||
| Group 2: Ampulla of Vater: No.= 11 M, 12 F, 55.83 ± 7.67 (y) | (see table 3 for detail) | ||||
| Group 3: Biliary tract (Hilar): No.= 9 M, 6 F, 51.67 ± 8.18 (y) | |||||
| Group 4: Pancreatic: No.= 38 M, 20 F, 54.33 ± 8.6 (y) | |||||
| Group 5: Gastric: No.= 17 M, 11 F, 53.04 ± 11.01 (y) | |||||
| Group 6: Esophagus: No.= 14, 9 M, 5 F, 57.79 ± 12.01 (y) | |||||
| Group 7: Colorectal: No.= 90, 55 M, 35 F, 50.8 ± 11.36 (y) | |||||
| Group 8: HC: No.= 50, 38 M, 12 F, 52 ± 8.1 (y) | |||||
| Umemori et al (2010)26 | 107 | Diagnostic Early detection: three groups | |||
| No. of patients by group, sex, median age and [IQR](y) | concentration (nmol/ g creatinine) mean and SD | Sensibility | |||
| N¹,N¹² - diacetylspermine | Group 1: CRC: No.= 33, 17 M, 16 F, 69.2 [56-84] (y) | N¹,N¹² - diacetylspermine HC 185 ±056 significant lower than cancer groups (p<0.01) | (see table 3 for detail) | ||
| N¹,N8 - diacetylspermidine | Group 2: Breast cancer : No.= 28, 1 M, 27 F, 61.3 [43-84] (y) | N¹,N8 - diacetylspermidine HC 522 ±.167 significant lower than cancer groups (p=0.01) | |||
| Laboratory: ELISA | Group 3: HC: No.= 46, 24 M, 22 F, 68.8 [46-86] (y) | ||||
Hiramatsu et al (2005)27 | N¹,N¹² - diacetylspermine | 434 | Diagnostic Early detection : four groups | Not Reported differences between groups | Specificity |
| Laboratory: ELISA | No. of patients by group, sex, range (y) | Sensibility | |||
| Group1: CRC: No.= 248, sex not reported, age not reported | (see table 3 for detail) | ||||
| Group 2: Breast cancer: No.= 83, sex not reported, age not reported | |||||
| Group 3: Bening gastrointestinal disease: No.= 51, sex not reported, age not reported | |||||
| Group 4: HC: No.= 52, 27 M, 25 F, (22-52) (y) | |||||
| OXIGEN REACTIVE SPECIES | |||||
| Three groups | |||||
| No. of patients by group, sex, mean,SD | Metabolites µmol/l mean, SD | ||||
Chandramathi et al (2008)25 | AOPP | 245 | Group 1: CRC: No.= 49, 30 M, 19 F, 60 ± 11 (y) | AOPP Malignant colorectal cancer 179.39±5.43 vs breast cancer 136.90±5.43 (p<0.05) vs HC 106.34±4.13 (p<0.001) | |
| MDA | Group 2: Breast cancer : No.= 101, 0 M, 101 F, 56 ± 12 (y) | MDA Malignant colorectal cancer 0.781± 0.0072 vs HC 0.579±0.029 (p<0.01) | |||
| H2O2 | Group 3: HC: No.= 95, 37 M, 58 F, 57 ± 11 (y) | H2O2 Malignant colorectal cancer 23.23± 2.16 vs breast cancer 17.65±1.18 (p<0.05) vs HC 17.28±0.83 (p<0.01) | |||
| FRAP | FRAP Malignant colorectal cancer 1530.20± 97.66 vs HC 17.28±0.83 (p<0.01) | ||||
| PROSTAGLANDINES | |||||
Davenport et al (2015)31 | PGE M | 1102 | Case control: three groups, all females | OR with C-reactive protein (see table 2 for detail) | |
| Laboratory: Liquid Chromatography Mass spectrometry | No. of patients by group, mean age and SD (y) | Mean ± SD levels of PGE-M (ng/g creatinine) | |||
| Total subjects: No.= 420, divided into two groups: | |||||
| Group 1: SSTA No.= 226, 57.5 ± 7.1 (y) | SSTA 2.4 ± 0.8 | ||||
| Group 2: MSTA No.= 198, 60 ± 6.5 (y) | MSTA 2.5 ± 0.7 | ||||
| Group 2: AA No.= 283, 58 ± 7.3 (y) | AA 2,6 ± 0,7 | ||||
| Group 4: HC: No.= 395 57,6 ±7,1 (y) | HC: 2.3 ± 0,8 | ||||
Bezawada et al (2014)33 | PGE M | 840 | Case control: three groups, all females | PGE-M (ng/g creatinine) | OR (See table 2 for detail) |
| Laboratory: Liquid Chromatography Mass spectrometry | No. of patients by group, mean age and SD (y) | ||||
| Total Colorectal Adenoma subjects: No.= 420, divided into two groups: | Other findings: PGE-M rises with years (p=0.002) And smoking (p=0.02) | ||||
| Group 1: Low risk adenoma (<1 cm, tubular): No.= 130, 66.2 ± 6.5 (y) | Low Risk: 5.01 [3.71-7-09] | ||||
| Group 2: High risk adenoma (≥1 cm, tubulovillous, villous or high grade dysplasia): No.= 290, 66.8 ± 6.6 (y) | High Risk: 6.26 [3.89-8-61] | ||||
| Group 3: HC: No.= 420, 66.7± 6.6 (y) | HC: 5.57 [3.50-7-64] | ||||
| Differences among groups: p<0.001 | |||||
Shrubsole et al (2012)32 | PGE M | 1040 | Case Control: four groups | PGE-M (PGE-M ng/g creatinine) Median,[IQR] | OR |
| Laboratory: Liquid Chromatography Mass spectrometry | No. of patients by group, sex, mean age, range and SD (y) | (See table 2 for detail) | |||
| Group 1: AA: No.= 224, 159 M, 65 F 59.2 (40-75) ± 7.1 (y) | AA: 12.6 [8.4-21.4] (p<0.001) | ||||
| Group 2: MSTA No.=152, 120 M, 32 F, 58.9 (40-75) ± 6.7 (y) | MSTA: 13.2[7.9-21.9] (p<0.001) | ||||
| Group 3: SST: No.=300, 209 M, 91 F, 57.8 (40-75) ± 7.3 (y) | MSTA: 10.1[5.7-17.1] (p=39) | ||||
| Group 4: HC: No.= 364, 236 M, 128 F 57.6 (40-75) ± 7.1 (y) | HC: 10.1 [5.7-17.1] | ||||
| Other findings: Levels of PGE-M are associated with: level of education (p=0.001) caucasian race (p=0.02), academic medical center (p<0.001), current use of NSAID (p=0.03). current alcohol drinking (p=0.002), cigarette smoking (p<0.001), BMI (p=0.03), red meat intake (p<0.001), physically activity in last 10 years (p=0.002) | |||||
Johnson et al (2006)34 | PGE M | 228 | Diagnostic Early detection: five groups | PGE-M (PGE-M ng/g creatinine) Median, [IQR] | Specificity |
| Laboratory: Liquid Chromatography Mass spectrometry | No. of patients by group, sex, mean age, SD (y) | Sensibility | |||
| Group 1: CRC: No.= 58, M 32, F 26, 60.9 ± 10 (y) | CRC 15 [9.11 - 26.9] | ROC curve | |||
| Group 2: Large or multiple polyps: No.= 44, 33 M, 11 F, 59.6 ± 11.5 (y) | Large or multiple polyps 15.6 [7.69-22.9] | (see table 3 for detail) | |||
| Group 3: Small polyps: No.= 26,18 M, 8 F, 60.5 ± 7.2 (y) | Small polyps 9.69 [6.54-20.4] | ||||
| Group 4: Crohn disease No.= 28, 13 M, 15 F, 38.8 ± 11.7 (y) | Crohn disease 21.9 [17.4-49.1] | ||||
| Group 5: HC: No.= 72, 53 M, 19 F, 60.9 ± 7.5 (y) | HC 7.17 [4.69-15.9] | ||||
| In CRC PGE-M higher than large or multiple polyps (p<0.006) and HC (p<0.0004) | |||||
| In CRC and large or multiple polyps PGE-M higher than small polyps and HC (p<0.0001) | |||||
Cai et al (2006)35 | PGE M | 300 | Case Control (nested): three groups, all females | PGE-M (PGE-M ng/g creatinine) Mean, [IQR] | RR (see table 2 for detail) |
| Laboratory: Liquid Chromatography Mass spectrometry | No. of patients by group, mean age, range and SD (y) | CRC (all groups) : 11.6 [6.4-18.9] | |||
| Total CRC subjects : No.= 150, 60.3 (40-70) ± 8.3 (y), divided into | HC: 7.0[3.9-14.0] (p<0.001) | ||||
| Group 1: CC: No.= 88, age not reported | Colon cancer: 12.0[7.1-19.1] CI 95% 9.7-13.7 Vs HC (p=0.002) | ||||
| Group 2: RR No.= 62, age not reported | Rectal cancer: 11.0 [5.6-18.3] CI 95% 7.4-12.6 Vs HC (p=0.49) | ||||
| Group 3: HC: No.= 150, 60.1 (40-70) ± 8.5 (y) | |||||
LEGEND: [IQR] interquartile range, SD standard deviation, HC healthy controls
AA: Advanced adenoma, CRC: colorectal cancer, SSTA: single small tubular adenoma, MMSA: Multiple small tubular adenoma, CC: colon cancer, RC: rectal cancer
Early Detection
| Reference, Year | Biomarkers | Parameters evaluated | Relation to diagnostic routine assays | |||||||||
|---|---|---|---|---|---|---|---|---|---|---|---|---|
| Rozalski et al (2015)76 | Urine | SE | SP | PPV | PNV | ROC Curve | 8-oxoGua in combination with 8-oxodGuo and 5-hmUra | |||||
| 8-oxodGuo | 33.9 | 94.4 | 0.63 (0.53-0.73) | SE | SP | ROC Curve | ||||||
| 8-oxoGua | 78.6 | 62.5 | 0.69 (0.60-0.78) | 78.6 | 75.0 | 0.77(0.69-0.89) | ||||||
| 5-hmUra | 48.2 | 79.2 | 0.66 (0.57-0.76) | |||||||||
| (8-oxoGua+8oxodGuo)/5-hmUra | 78.6 | 75.0 | 0.77 (0.69-0.86) | |||||||||
| Amiot et al (2014)23 | Urine | Wif-1 methylation in combination with fecal occult blood test | ||||||||||
| Wif-1 | 27.0 | 99.0 | 0.90 (0.84-0.94) | ROC Curve | ||||||||
| ALX-4 | 15.0 | 100 | 0.91 (0.87-0.95) | |||||||||
| Vimentin | 8.0 | 100 | ||||||||||
| Stool | Wif-1 methylation combined in urine or serum samples | |||||||||||
| Wif-1 | 19.0 | 99.0 | SE | SP | ROC curve | |||||||
| ALX 4 | 11.0 | 99.0 | 48.8 | 99 | 0.90 (0.84-0-94) | |||||||
| Vimentin | 33.0 | 100 | ||||||||||
| Blood | ||||||||||||
| Wif-1 | 33.0 | 99.0 | ||||||||||
| ALX-4 | 23.0 | 100.0 | ||||||||||
| Vimentin | 4.0 | 100 | ||||||||||
| Xiao et al (2014)22 | Urine Methylation NRDG4 | 72.6 | 85 | |||||||||
| Tissue Methylation NRDG4 | 81.0 | 91.7 | ||||||||||
| Paracarcinoma Methylation NRDG4 | 8.3 | |||||||||||
| Blood Methylation NRDG4 | 54.8 | 78.1 | ||||||||||
| Feces Methylation NRDG4 | 76.2 | 89.1 | ||||||||||
| Hsu et al (2013)24 | Urine | In combination with serum CEA | ||||||||||
| Adenosine | 69.0 | 81.0 | ||||||||||
| Cytidine | 35.0 | |||||||||||
| 3-methylcytidine | ||||||||||||
| 1-methyladenosine | 27.0 | |||||||||||
| Inosine | ||||||||||||
| 2-deoxyguanine | ||||||||||||
| Set of six nucleosides | 69.0 | 85.0 | ||||||||||
| Niu et al (2012)29 | Urine Arylsulfatase | M | 63.4 | 96.4 | 90.0 | 83.5 | 0.89(0.83-0.95) | |||||
| F | 81.3 | 95.1 | 83.0 | 94.5 | 0.87 (0.79-0.94) | |||||||
| Accuracy | M | 85.1 | ||||||||||
| F | 91.9 | |||||||||||
| Cheng et al (2012)105 | Urine | |||||||||||
| Citrate | 0.72 | |||||||||||
| Hippurate | 0.92 | |||||||||||
| P-cresol | 0.80 | |||||||||||
| 2-aminobutyrate | 0.75 | |||||||||||
| Myristate | 0.84 | |||||||||||
| Putrescine | 0.70 | |||||||||||
| Kynurenate | 0.88 | |||||||||||
| Total panel | 97.5 | 97.6 | 0.99 (0.97-1.00) | |||||||||
| Umemori et al (2010)26 | Urine | DiAcSpm in combination with | ||||||||||
| N¹,N¹²-diacetylspermine (DiAcspm) | 69.6 | SE | ||||||||||
| N¹,N8-diacetylspermidine (DiAcSpd) | 36.3 | DiacSpd | 75.7 | |||||||||
| Blood | CEA | 78.7 | ||||||||||
| CEA | 46.8 | CA 19-9 | 78.7 | |||||||||
| CA 19-9 | 15.6 | |||||||||||
| Hiramatsu et al (2005) 27 | Urine | DiAcSpm in combination with | ||||||||||
| N1,N12 - diacetylspermine (DiAcSpm) Blood | 75.8 | 96 | CEA | 39.5 | ||||||||
| CEA | CA 19-9 | 14.1 | ||||||||||
| CA 19-9 | ||||||||||||
| Szajda et al (2009)30 | Urine | |||||||||||
| Hex | 78.9 | 72.7 | 0.84 | |||||||||
| HexA | 73.6 | 63.9 | 0.67 | |||||||||
| HexB | 84.2 | 90.9 | 0.89 | |||||||||
| El-Masry et al (2007)79 | Urine | |||||||||||
| CEA (ELISA) | 64.4 | 79.5 | 52.2 | |||||||||
| CEA (SB-ELISA) | 76.7 | 86.3 | 65.0 | |||||||||
| Johnson et al (2006)34 | PGE-M¹ | A | 90.0 | 45.0 | 0.64 | |||||||
| M | 88.0 | 35.0 | 0.54 | |||||||||
| F | 92.0 | 78.0 | 0.84 | |||||||||
| PGE-M² | A | 88.0 | 53.0 | 0.70 | ||||||||
| M | 92.0 | 46.0 | 0.67 | |||||||||
| F | 83.0 | 86.0 | 0.84 | |||||||||
LEGEND: PGE-M¹: Cancer vs non cancer. PGE-M²: Cancer/large polyps small/no polyps. DiAcSpm: N¹,N¹²-diacetylspermine. DiAcSpd: N¹,N8-diacetylspermidine.
8-oxodGuo: 8-oxo-7,8-dihydro-2'-deoxyguanosine. 8-oxoGua: 8-oxo-7,8-dihydroguanine. 5-hmUra: 5-hydroxymethyluracil. A: All population, M: male, F: female
Prostaglandines: case control and case control nested studies
Reference, year | PGE-M (number of cases vs controls) | p-value | ||||||||
|---|---|---|---|---|---|---|---|---|---|---|
| Low PGE-M (<9.99 mg/mg creatinine) | High PGE-M (>9.99 mg/mg creatinine) | |||||||||
| CRP T1 | CRP T2 | CRP T3 | CRP T1 | CRP T2 | CRP T3 | |||||
| Davenport et al (2015) 31 | Single small tubular | 30 vs 34 | 43 vs 43 | 35 vs 41 | 29 vs 38 | 52 vs 38 | 54 vs 40 | 0.08 | ||
| OR (95% CI) | 1* | 0.78 (0.34-1.76) | 0.46 (0.18-1.13) | 0.66 (0.25-1.69) | 0.99 (0.42-2.34) | 0.99 (0.44-2.29) | ||||
| Multiple small tubular | 8 vs 34 | 13 vs 43 | 17 vs 41 | 14 vs 38 | 24 vs 38 | 29 vs 40 | 0.90 | |||
| OR (95% CI) | 1* | 1.48 (0.35-6.37) | 1.39 (0.41-4.73) | 1.10 (0.27-4.53) | 1.98 (0.52-7.56) | 3.00 (0.70-12.86) | ||||
| Advanced | 13 vs 34 | 21 vs 43 | 21 vs 41 | 21 vs 38 | 39 vs 38 | 51 vs 40 | ||||
| OR (95% CI) | 1* | 1.96 (0.61-6.32) | 1.29 (0.43-3.86) | 1.35 (0.40-4.51) | 4.16 (1.32-13.11) | 5.31 (1.55-18.18) | 0.08 | |||
| Multiple or small tubular or advanced | 21 vs 34 | 34 vs 43 | 38 vs 41 | 35 vs 38 | 63/38 | 80 vs 40 | 0.25 | |||
| OR (95% CI) | 1* | 1.67 (0.65-4.29) | 1.23 (0.51-2.96) | 1.22 (0.47-3.17) | 3.04 (1.21-7.64) | 3.72 (1.42-9.72) | ||||
Quartiles PGE-M (number of cases vs controls) | ||||||||||
Bezawada et al (2014)33 | Q1 | Q2 | Q3 | Q4 | ||||||
All Adenoma | 84 vs 105 | 117 vs 105 | 94 vs 103 | 125 vs 107 | ||||||
| OR (95% CI) | 1* | 1.38 (0.90-2.10) | 1.13 (0.73-1.73) | 1.40 (0.92-2.14) | 0.26 | |||||
Low Risk Adenoma | 27 vs 105 | 48 vs 105 | 28 vs 103 | 27 vs 107 | ||||||
| OR (95% CI) | 1* | 1.63 (0.92-2.89) | 1.02 (0.55-1.90) | 0.91 (0.48-1.72) | 0.30 | |||||
High risk adenoma | 57 vs 105 | 69 vs 105 | 66 vs 103 | 98 vs 107 | ||||||
| OR (95% CI) | 1* | 1.23 (0.75-2.0) | 1.19 (0.73-1.94) | 1.66 (1.04-2.67) | 0.04 | |||||
Non regular aspirin or NSAID users | 21 vs 38 | 33 vs 42 | 36 vs 45 | 48 vs 31 | ||||||
| OR (95% CI) | 1* | 2.01 (0.90-4.51) | 1.69 (0.76-3.76) | 2.08 (0.93-4.65) | 0.18 | |||||
Regular aspirin or NSAID users | 36 vs 67 | 36 vs 63 | 30 vs 58 | 50 vs 66 | ||||||
| OR (95% CI) | 1* | 0.86 (0.45-1.65) | 0.89 (0.46-1.73) | 1.41 (0.76-2.61) | 0.18 | |||||
BMI ≥ 25 | 30 vs 47 | 42 vs 52 | 37 vs 51 | 58 vs 60 | ||||||
| OR (95% CI) | 1* | 1.21 (0.61-2.41) | 1.10 (0.54-2.21) | 1.36 (0.69-2.67) | 0.43 | |||||
BMI ≤ 25 | 27 vs 58 | 27 vs 53 | 29 vs 52 | 40 vs 47 | ||||||
| OR (95% CI) | 1* | 1.11 (0.54-2.31) | 1.43 (0.70-2.93) | 2.07 (1.04-4.13) | 0.02 | |||||
Past o current smokers | 33 vs 52 | 36 vs 51 | 35 vs 54 | 47 vs 62 | ||||||
| OR (95% CI) | 1* | 1.28 (0.66-2.51) | 1.15 (0.58-2.27) | 1.35 (0.71-2.57) | 0.45 | |||||
Never smokers | 29 vs 53 | 32 vs 54 | 31 vs 49 | 50 vs 45 | ||||||
| OR (95% CI) | 1* | 1.22 (0.58-2.56) | 1.40 (0.66-3.00) | 2.23 (1.08-4.60) | 0.02 | |||||
High calcium ≥ 1068 mg/dl | 29 vs 54 | 33 vs 52 | 32 vs 49 | 48 vs 55 | ||||||
| OR (95% CI) | 1* | 1.28 (0.66-2.51) | 1.15 (0.58-2.27) | 1.35 (0.71-2.57) | 0.09 | |||||
Low calcium ≤ 1068 mg/dl | 28 vs 51 | 36 vs 53 | 34 vs 54 | 50 vs 52 | ||||||
| OR (95% CI) | 1* | 1.43 (0.70-2.91) | 1.17 (0.57-2.40) | 1.66 (0.82-3.38) | 0.24 | |||||
Shrubsole (2012)32 | Any advanced adenoma | 26 vs 90 | 51 vs 89 | 76 vs 90 | 69 vs 89 | |||||
| OR (95% CI)a | 1* | 1.64 (0.9-2.95) | 2.42 (1.37-4-28) | 2.17 (1.20-3.92) | 0.006 | |||||
| OR (95% CI)b | 1* | 1.56 (0.84-2.90) | 2.25 (1.23-4.09) | 1.84 (0.97-3.48) | 0.04 | |||||
Multiple small tubular adenoma | 16 vs 90 | 36 vs 89 | 44 vs 90 | 52 vs 89 | ||||||
| OR (95% CI)a | 1* | 2.13 (1.02-4.44) | 2.13 (1.03-4.40) | 2.57 (1.24-5.34) | 0.03 | |||||
| OR (95% CI)b | 1* | 2.59 (1.20-5.60) | 2.31(1.07-5.00) | 2.88(1.32-6.24) | 0.04 | |||||
Single small tubular adenoma | 66 vs 90 | 80 vs 89 | 73 vs 90 | 79 vs 89 | ||||||
| OR (95% CI)a | 1* | 1.14 (0.72-1.82) | 0.99 (0.61-1.61) | 1.11 (0.67-1.82) | 0.87 | |||||
| OR (95% CI)b | 1* | 1.16 (0.72-1.86) | 0.93 (0.56-1.53) | 1.04 (0.62-1.74) | 0.88 | |||||
Advanced or multiple adenoma | 42 vs 90 | 87 vs 89 | 120 vs 90 | 121 vs 89 | ||||||
| OR (95% CI)a | 1* | 1.84 (1.11-3.05) | 2.32 (1.41-3.81) | 2.34 (1.41-3.87) | 0.001 | |||||
| OR (95% CI) | 1* | 1.95 (1.15-3.30) | 2.31 (1.37-3.89) | 2.19 (1.28-3.76) | 0.008 | |||||
Male | 24 vs 34 | 59 vs 55 | 97 vs 68 | 95 vs 76 | ||||||
| OR (95% CI) | 1* | 1.52 (0.75-3.09) | 1.96 (1.01-3.83) | 1.58 (0.81-3.10) | 0.24 | |||||
Female | 18 vs 56 | 28 vs 34 | 23 vs 22 | 26 vs 13 | ||||||
| OR (95% CI) | 1* | 2.71 (1.14-6.42) | 2.33 (0.87-6.23) | 5.40 (1.78-16.41) | 0.006 | |||||
Never or former NSAID user | 23 vs 46 | 42 vs 41 | 50 vs 39 | 62 vs 39 | ||||||
| OR (95% CI) | 1* | 1.91 (0.90-4.04) | 2.19 (1.01-4.75) | 2.29 (1.03-5.09) | 0.06 | |||||
Current NSAID users | 15 vs 43 | 34 vs 47 | 53 vs 50 | 46 vs 49 | ||||||
| OR (95% CI) | 1* | 2.36 (1.06-5.28) | 2.96 (1.38-6.36) | 2.51 (1.14-5.54) | 0.04 | |||||
Nevers smokers | 15 vs 55 | 32 vs 50 | 30 vs 42 | 30 vs 33 | ||||||
| OR (95% CI) | 1* | 1.90 (0.86-4.20) | 1.91 (0.83-4.38) | 2.44 (1.01-4.20) | 0.03 | |||||
Former/ currentsmokers | 23 vs 34 | 43 vs 38 | 73 vs 47 | 80 vs 56 | ||||||
| OR (95% CI) | 1* | 1.98 (0.94-4.16) | 2.74 (1.36-5.54) | 2.09 (1.04-4.20) | 0.06 | |||||
Cai et al (2006)35 | All colorectal cancer | 14 vs 37 | 28 vs 38 | 47 vs 37 | 61 vs 38 | |||||
| RR (95% CI) | 1* | 2.5 (1.1-5.8) | 4.5 (1.9-10.9) | 5.6 (2.4-13.5) | <0.001 | |||||
Colon cancer | 7 vs 21 | 15 vs 22 | 29 vs 20 | 37 vs 25 | ||||||
| RR (95% CI) | 1* | 2.1 (0.7-6.5) | 4.8 (1.6-14.8) | 4.9 (1.7-14.7) | 0.009 | |||||
Rectalcancer | 7 vs 16 | 13 vs 16 | 18 vs 17 | 24 vs 13 | ||||||
| RR (95% CI) | 1* | 3.1 (0.8-11.6) | 4.1 (1.0-17.3) | 7.2 (1.7-3.7) | 0.048 | |||||
≤ 30 months | 6 vs 16 | 12 vs 23 | 26 vs 18 | 31 vs 18 | ||||||
| RR (95% CI) | 1* | 2.3 (0.6-8.9) | 5.4 (1.3-21.8) | 7.6 (1.8-32.0) | 0.035 | |||||
> 30 months | 8 vs 21 | 16 vs 15 | 21 vs 19 | 30 vs 20 | ||||||
| RR (95% CI) | 1* | 2.9 (1.0-9.1) | 3.6 (1.1-11.4) | 4.4 (1.5-13.3) | 0.012 | |||||
*reference category
a: adjusted for age, gender, race, educational attainment and study site
b: additionally adjusted for cigarette smoking, alcohol consumption, BMI, red meat intake and NSAID use.
Among the urinary markers explored to date, PGE-M has been examined in five studies involving more than 1000 patients. These data were subjected to a meta-analysis. Data reported as medians and interquartile ranges were transformed into mean and standard deviation (SD) as described by Pudar Hozo et al [38]. Participants were considered as healthy controls (HC) if adenoma/adenocarcinoma had been excluded by colonoscopy; as patients with low-risk adenoma (LRA) if they had a solitary adenoma <1cm in diameter; or as patients with high risk adenoma (HRA) if they had multiple lesions, adenomas >1cm in diameter, or lesions showing a high degree of dysplasia. Pools standardised mean differences were evaluated according to Cohen [39] and analysed with the random-effects model according to Der Simonian and Laird [40]. Quality assessment of case-control studies was conducted with the Newcastle-Ottawa scale [41]; the last item of outcome/exposure assessment was not used because it was not appropriate (Supplementary table S1).
Results
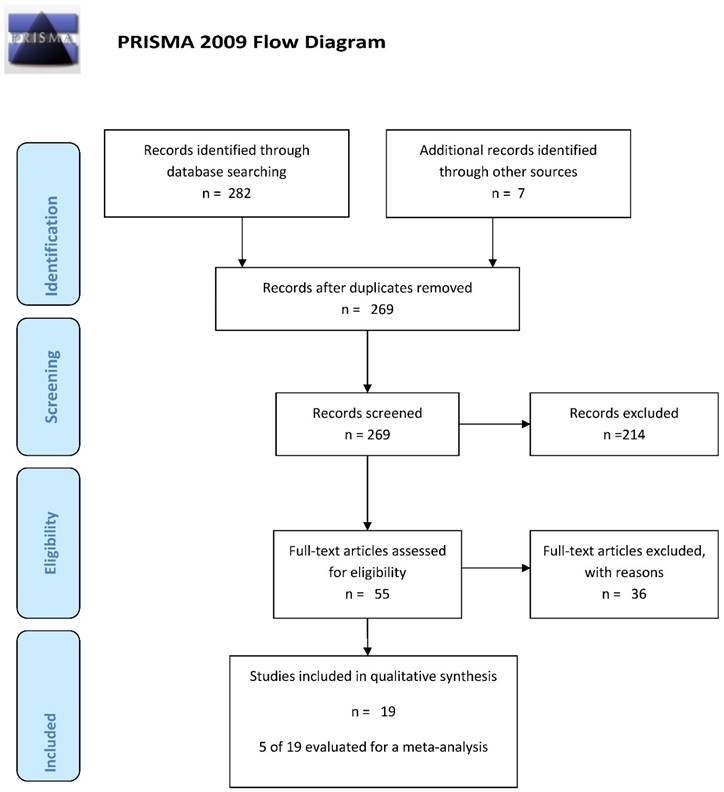
Search of the electronic databases according to the above-listed criteria found 282 papers; the manual search found 7 papers, totalling 289 papers. There were 25 duplicates (figure 1); 214 papers were excluded because 28 were conference posters, 54 were reviews, 84 regarded other subjects, 30 were animal, in vitro or laboratory technique studies, and 18 evaluated blood/serum/plasma or other tissues. Examination of the remaining 50 papers in the second stage of the PRISMA flow chart led to the exclusion of 31studies for the following reasons: 5 were reviews [1,19,42-44], one assessed animals [45], 5 involved laboratory technique validation [21, 46-49], one was a molecular biology study [50], 4 were survival analysis studies [51-54], 7 assessed the impact of dietary habits [57-61], 5 did not examine urine [62-66], one reported aggregate data for CRC, gastric cancer and pancreatic cancer [67], and finally 2 did not match the inclusion criteria [68,69].
Flow-chart of the search strategy
The general characteristics of these papers are reported in table 1. Since they assessed multiple biomarkers, they were grouped as follows.
Gene markers
A study of the methylation of vimentin, ALX-4, and Wif-1 genes [24] has found significant differences between CRC patients and HC only for the Wif-1gene (p<0.0001) (table 1). However, despite high SP values, SE was very low (table 2) [24].
Song and co-workers have described significantly different (p<0.0001) percent methylation of the vimentin gene in CRC patients and HC (table 1) [70].
As reported by Xiao and colleagues, NDRG4 methylation provided an SP that ranged from 78% (blood) to 91% (tissue), whereas SE ranged from 8% (paracarcinoma tissue) to 81% (carcinoma tissue) in table 2 [23].
Metabolism of nitrogenous bases
Several studies have assessed nitrogenous bases as disease markers. Rozalski and co-workers investigated 8-oxo-7,8-dihydro-2'-deoxyguanosine, 8-oxo-7,8-dihydroguanine, and 5-hydroxymethyluracil. Group data and the main findings are reported in table 1, whereas SP and SE values are listed in table 3 [71].
Hsu and colleagues examined cytidine, 1-methyladenosine, and adenosine, among other metabolites, and detected higher concentrations in CRC patients than in HC (respectively, p<0.01, p=0.01, and p<0.01; table 1). They also calculated SP and SE (table 2) [25]. Cheng et al found no differences in nitrogen metabolites among the groups, but described differences in the ROC curves (table 2) [72]. Feng and colleaguesmeasured13 metabolites in CRC patients and HC (table 1) and reported the ROC curve data (table 2) [73]. Zheng and co-workers assessed 13 urinary metabolites in CRC patients and HC and found that they were consistently higher in patients (table 1) [74].
Markers of enzyme activity
Niu and colleagues investigated arylsulphatase (ARS) activity in patients with CRC, patients with adenoma, and HC. Data stratification by gender highlighted significant differences among groups (p<0.0001). The SP, SE, PPV, PNV and ROC curve data are reported in table 2 [30].
Szajda and colleagues examined urinary hexosaminidase (HEX) activity in CRC patients and HC. They found higher HEX enzyme (HEX, HEX A and HEX B) activity in relation to Dukes' stages A (p=0.03668), C (p=0.02396) and D (P=0.00552). Moreover, the HEX B complex provided an SE of 84.2% and an SP of 90.9%, whereas the area under the curve (AUC) was 0.89. The other values for HEX A and the HEX complex are reported in table 2 [31].
Carcinoembryonic antigen
El-Masry and colleagues measure urinary carcinoembryonic antigen (CEA) in different malignant gastrointestinal diseases. The relevant SE, PPV, and PNV values are listed in table 2 [75].
Spermines
There are two papers on spermines [27, 28]. Umemori and co-workers examined N1,N12diacetylspermine (DiAcSpm) and N1, N8 diacetylspermidine (DiAcSpd) in various groups of subjects (table 1) and found that both were significantly higher in cancer patients than in HC (respectively p=0.01 and p<0.01). They also calculated the SE of the two markers (table 2) [27].
Hiramatsu et al. investigated HC and patients with CRC, breast cancer (BC), and benign gastrointestinal disease (table 1), but only calculated the SE and SP values of urinary spermines (table 2) [28].
Reactive oxygen species
These were investigated only by Chandramathi and colleagues in four groups of subjects. CRC patients showed significantly higher levels than BC patients and control subjects (table 1) [26].
Prostaglandins
There were five papers assessing urinary PGE-M: four compared patients with adenoma and HC [32-35] and two compared cancer patients and HC [35,36]. The general characteristics of the study populations and the differences among groups are reported in table 1; the SE and SP values are showed in table 2 and the risk estimates are reported in table 3.
Johnson and colleagues have assessed the possible role of PGE-M as an early diagnostic marker in five groups of subjects (table 1). PGE-M levels were higher in CRC patients than in those with multiple polyposis (p<0.006) and HC subjects (p<0.0004). Davenport and colleagues (table 3) devised a risk model where they considered urinary PGE-M as well as plasma C-reactive protein (CRP). Although none of the associations achieved statistical significance, the risk tended to increase in patients with poorly differentiated lesions on histopathology and higher levels of the two markers [35].
Bezawada and colleagues (table 3) found significant OR in HRA patients (p=0.04) having higher PGE-M levels compared with controls. In LRA patients, none of the risk estimates were significantly related to PGE-M levels (p=0.30). PGE-M values were not associated with a significant risk in smokers or in those who had stopped smoking(p=0.45). Adenoma patients with a body mass index (BMI) >25 (p=0.43) were not at significantly greater risk in relation to PGE-M levels compared with HC. In contrast, HRA patients with a BMI <25 were at greater risk than controls; the risk was double in case of higher PGE-M levels (p=0.02). Risk differences between cases and controls in relation to PGE-M levels were not affected by consumption of non-steroidal anti-inflammatory drugs (NSAID) (p=0.18) or by high or low calcium values (respectively p=0.09 and p=0.24) (table 3) [34].
In the paper by Shrubsole and co-workers, the risk assessment model, based on urinary PGE-M and histological type, was adjusted for age, gender, education, ethnicity, smoking habits, BMI, and consumption of alcohol, NSAID, and red meat (table 3). In patients with "any advanced adenoma", adjustment for gender, ethnicity, age, and education yielded increased and significant OR in Q3 and Q4, whereas the adjustment for cigarette smoking, BMI, and alcohol, red meat, and NSAID consumption involved an approximately twofold greater risk in the third quartile for cases compared with controls. Notably, in the group of "multiple small tubular adenoma" (MSTA) all risks were increased and significant after adjustment for all the confounding variables included in the model. The same was true of patients with "advanced or multiple adenoma "when they were not stratified by gender. Gender stratification involved very high OR in women with high PGE-M compared with HC in the fourth quartile (table 3). As regards NSAID consumption, a twofold greater risk was found among those who had never taken them in the third and fourth quartile of PGE-M, whereas among users the risk was increased in all PGE-M quartiles for cases compared with controls [33].
Cai and co-workers reported an increased risk with the increase in PGE-M levels in cases compared with controls for all CRC patients (p<0.001). Remarkably, in CRC patients with a disease duration >30 months, higher PGE-M levels were associated with an increased and significant risk (<30 months, p=0.35; >30 months, p=0.012) (table 3) [36].
PGE-M and meta-analysis
The present review highlights that PGE-M is the most frequently assessed marker. The studies published to date have examined the whole CRC spectrum, from benign adenoma to advanced cancer stages. Despite their limited amount, the samples analysed in the various papers were found to be sufficient for a meta-analysis, except for the study by Johnson and colleagues [35]. The present meta-analysis aims to assess whether differences in urinary PGE-M among patient groups are statistically significant. The following groups were compared: patients with a single small tubular adenoma (LRA); patients with advanced adenoma or adenoma showing a high degree of dysplasia (HRA); and patients with MSTA, though not all papers included the latter. The results of the comparisons are reported below.
LRA vs. HC. In this comparison the standard mean difference (SMD) was not significantly different (z=0.21; p=0.836); heterogeneity chi-squared was 2.90 (d.f.=3), p=0.408, and I-squared (change in SMD attributable to heterogeneity) was 0.0% and estimate of between-study variance tau-squared <0.0001 (Figure S2).
HRA vs. HC. This comparison yielded z=5.12; p<0.001, heterogeneity chi-squared=4.61 (d.f.=3), p=0.203, I-squared =34.9%, and estimate of between-study variance tau-squared=0.0049 (Figure S3).
HRA vs. LRA. The data found for this comparison were as follows: SMD z=5.83; p<0.001, heterogeneity chi-squared=0.48 (d.f.=3), p=0.924, I-squared =0.0%, and estimate of between-study variance tau-squared<0.001 (Figure S4).
MSTA vs. HC. The following data were obtained for this comparison: SMD z=1.00, p=0.316; heterogeneity chi-squared =6.71, p = 0.010, I-squared=85.1%; and estimate of between-study variance tau-squared=0.0565 (Figure S5).
CRC vs. HC.SMD z=5.09, p<0.001 and heterogeneity chi-squared=1.13 (d.f.=1), p=0.287, I-squared =34.2%, and estimate of between-study variance tau-squared=0.0031 (Figure S6).
Discussion
Research into diagnostic tests has provided a number of non-invasive assays for use in CRC screening that include DNA, RNA and protein biomarkers in faeces, blood, and urine [32,73-77].
Several urinary markers have been investigated, including epigenetic modifications, oxidatively modified DNA bases, nucleosides, enzyme activities, various metabolites (glycolysis, tricarboxylic acid[TCA] cycle, urea cycle, pyrimidine, polyamine and gut microbiota metabolism), oxidative indices, non-enzymatic antioxidants, CEA, and PG metabolites (especially PGE-M).
As regards epigenetic modifications, abnormal DNA methylation is an early event in carcinogenesis, and several abnormally hypermethylated genes have been identified in CRC patients [78-80]. Hypermethylation of CpG-rich sequences (CpG islands) in tumour suppressor genes has been reported in CRC neoplastic tissue and in premalignant lesions [81]. Since aberrant DNA methylation is found in stool, serum, urine, and other body fluids, such DNA could be used as a biomarker for cancer screening [82-84].
With reference to epigenetic markers, significant hypermethylation of the vimentin gene has been found in CRC patients compared with controls [70]. In a cross-sectional study, Amiot and colleagues measured the methylation levels of Wif1, ALX-4, and vimentin genes, selected from a panel of 63 genes, in urine, stool, and serum [24]. These markers showed a good specificity but a low sensitivity for early cancer detection (table 2).
Since oxidative stress related to chronic inflammation is associated with CRC etiology, Rozalski and colleagues assessed urinary excretion of oxidatively modified DNA bases/nucleoside (8-oxo-7,8-dihydroguanine, 8-oxo-7,8-dihydro-2'-deoxyguanosine and 5-hydroxymethyluracil) in HC, adenoma patients and CRC patients [71]. Although urinary DNA changes may reflect the oxidative stress/chronic inflammation found in CRC [85,86], its performance in early diagnosis is moderate [71].
The levels of advanced oxidative protein products (AOPP), hydrogen peroxide (H2O2), malondialdehyde (MDA; a marker of lipid peroxidation), and ferric reducing antioxidant power were determined in urine from BC and CRC patients [26], and AOPP, H2O2 and MDA were found to be significantly higher in CRC patients compared with control subjects and BC patients.
Urinary nucleosides have been tested as biological markers of malignancy in a variety of cancers [87-90], but very few studies have addressed CRC. An investigation into urinary nucleosides from CRC patients and HC [24] has found higher mean levels of adenosine, cytidine, 1-methyladenosine in patients, even though they provided low SE (range, 27-69%).
Feng and co-workers reported that the levels of 11 of 14 urinary nucleosides were higher in CRC than in HC subjects [73]. The SE of the urinary nucleosides (76.9%) was higher than those of CEA (38.5%), CA19-9 (40.4%), CA125 (15.4%), and AFP (17.3%).
A comparison of the urinary concentrations of 14 nucleosides in healthy subjects, patients with intestinal villous adenoma, and patients with CRC found that the concentrations of 12 nucleosides were significantly elevated in CRC patients, whereas only the concentrations of four nucleosides were higher in patients with intestinal villous adenoma compared with healthy subjects [25]. In CRC patients, the SE of urinary nucleosides was 71% compared with the 29% of CEA. Mean nucleoside concentrations were significantly lower in patients with intestinal villous adenoma than in CRC patients. Moreover, the level of 1-methylguanosine, pseudo-uridine, and 1-methyladenosinepositively correlated with tumour size and Dukes' stage.
The activity of several enzymes is altered in a number of cancers. Changes in the structure of membrane glycoconjugates and glycosidase and protease activity are important in tumorigenesis [91]. Significantly higher activities of lysosomal exoglycosidase shave been reported in human glioma and kidney cancer tissue and in serum and urine from patients with pancreatic cancer and colon cancer [69, 91-95]. Β-HEX, a lysosomal exoglycosidase, releases terminal N-acetyl hexosamines from GM2 gangliosides, oligosaccharides of glycoproteins, glycosaminoglycans, and other carbohydrate-containing macromolecules [93]. There are two major HEX isoenzymes: A (αβ), and B (ββ) [93]. Szajda and colleagues have described a significant increase in the concentration of HEX and in the activity of isoenzymes HEX A and HEX B in serum and urine from CRC patients [31] compared with HC. The SE of HEX, HEX A and HEX B was 78.9%, 73.6%, and 84.9%, respectively. No correlation was found between the activity of HEX, HEX A or HEX B and histological type, Dukes' stage, degree of cellular differentiation, tumour size, or gender.
Sulphatase family members share structural and functional similarities [96]. They catalyse the hydrolysis of sulpha bonds from different types of substrates, e.g. glycosaminoglycans, sulpholipids, and steroid sulphates. The two main ARS isoenzymes, A (ARSA) and B (ARSB), are soluble and are located in lysosomes. In a retrospective study, Niu and colleagues assessed morning urinary ARS activity as a marker of tumour progression in normal controls, subjects with benign CR tumours and CRC patients [30] and found significantly higher values in the latter group. Moreover, morning urinary ARS activity was fairly effective in distinguishing patients with CRC from those with benign CR tumour.
Several metabolic aberrations are associated with CRC, and significant metabolic changes have been described in CRC tissue [97]. Serum and urinary metabolomic studies have found that CRC is associated with dysregulated glycolysis, TCA cycle, urea cycle, and pyrimidine, polyamine and gut microbiota metabolism [98-100]. Cheng and co-workers have described a distinct urinary metabolic profile in CRC patients with altered levels of several metabolites derived from gut microbial-host co-metabolism as well as metabolites involved in the TCA cycle and tryptophan and polyamine metabolism. A panel of seven metabolite markers (citrate, hippurate, p-cresol,2-aminobutyrate, myristate, putrescine, and kynurenate), was able to discriminate CRC patients from their healthy counterparts, with an AUC 0.998 [72].
Polyamine compounds are low-molecular-weight organic cations involved in several biological processes including carcinogenesis. Among natural polyamines, the concentrations of diacetylated spermine and spermidine increase in urine from cancer patients [101-103]. Urinary DiAcSpm and DiAcSpd have been evaluated in BC and CRC patients in two studies [27, 28]. In Hiramatsu's study [28], urinary DiAcSpm was found to have a markedly higher SE (75.8%) compared with serum CEA (39.5%) and CA19-9 (14.1%) in CRC patients [26]; in Umemori's study [27], the SE of DiAcSpm and DiAcSpd in CRC patients was respectively 69.6% and 36.3%. DiAcSpm and DiAcSpd were higher than in controls even in early-stage CRC, and were highest in patients with stage IV disease [27].
CEA comprises a large family of cell-surface glycoproteins with common antigenic determinants residing in the protein portion of the molecule and is the most widely used tumour marker for CRC monitoring [104, 105]. El-Masry and co-workers have developed a Slot-Blot Enzyme Linked Immunosorbent Assay (SB-ELISA) based on anti-CEA monoclonal antibody as a simple, fast, inexpensive, and non-invasive immunodiagnostic technique for CEA detection in urine from patients with gastrointestinal tumours [75]. In CRC patients it provided higher SE, PPV and PNV (respectively 76.7%, 86.3%, and 65%) than the ELISA serum test, which showed 64.4% SE, 79.5% PPV, and 52.2 % PNV.
PGE-M seems to be the most interesting and promising urinary marker for CRC and adenoma risk assessment and for CRC screening. PGE-M is the main urinary metabolite of PGE2, probably the major mediator of the effects of cyclooxygenase-2 (COX-2) in colorectal carcinogenesis. COX-2 is abnormally expressed in most CR cancers and adenomas [105,106]. In addition, use of NSAID, such as COX-2 inhibitors, reduces CR adenoma recurrence and enhances its regression, confirming the role of the COX-2-related pathways in CR carcinogenesis [107-110].
Epidemiological studies have consistently shown a 40% to 50% reduction in CRC risk associated with NSAID use [111-113]. Clinical trials have demonstrated that anti-inflammatory agents can reduce the risk of developing colon polyps [114-116]. The chemo preventive effects of NSAID are thought to be largely mediated through their role in the inhibition of COX-2 and PG production [117-119].
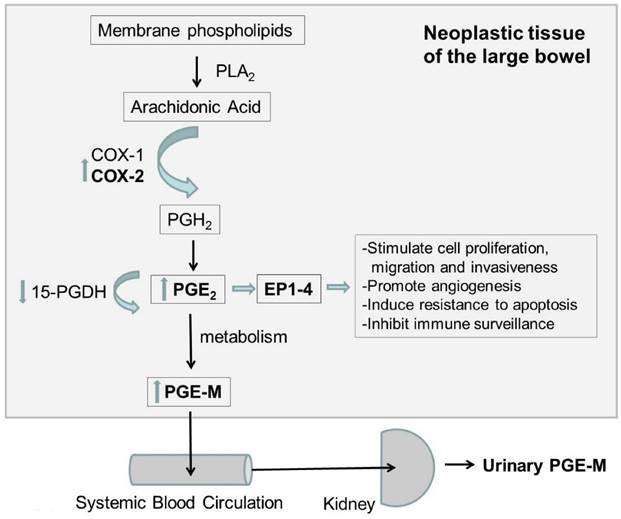
As illustrated in figure 2, COX-2 catalyses the conversion of arachidonic acid to PG H2, which is the precursor for several PG including PGE2. Most of the effects of COX-2 on tumour genesis appear to be related to PG2 overproduction. PGE2 is the most abundant PG detected in CR neoplasms and has been shown to inhibit apoptosis, stimulate angiogenesis, and increase cellular proliferation, cyclin, and migration [120-127]. PGE2 levels are elevated in CR neoplasms, and reduction in the expression of 15-Hydroxyprostaglandin dehydrogenase (15-PGDH), which degrades PGE2, is commonly found in CRC [120, 128-130]. PGE2 exerts its cellular effects by binding to its cognate receptor Prostaglandin E2 receptor 1-4 (EP1-4), which is overexpressed in all CRC tissues [123,130]. Given the critical role of PGE2 in CR carcinogenesis, it is conceivable that the main urinary metabolite of PGE2, PGE-M, can be a valuable risk assessment tool for CRC.
Diagram of the possible mechanism of PGE-M in CRC. PLA2: Phospholipases A2; COX-1 cyclooxygenase 1; COX-2: cyclooxygenase 2; PGH2: prostaglandine H2; PGE2 prostaglandine E2; PGE-M urinary metabolite of prostaglandin E2; 15-PGDH: 15-Hydroxyprostaglandin dehydrogenase; EP1-4: Prostaglandin E2 receptors 1-4
Increased urinary PGE2-M levels are associated with MSTA and advanced adenoma as well as CRC [32-36, 110-113]. Johnson and co-workers found significantly increased urinary PGE-M in patients with CRC and large CR polyps compared with subjects with normal colonoscopies or small polyps [35]. They also found that treatment with a selective COX-2 inhibitor, celecoxib, reduced PGE-M levels among rectal cancer patients.
In a prospective cohort study of Chinese women, baseline urinary PGE-M was more than 50% higher in CRC patients than in controls [36] and was associated with a strong risk for later CRC diagnosis.
In a case-control study of CR adenoma, patients with advanced adenoma or MSTA had more than 25% higher levels of PGE-M than controls, whereas differences in PGE-M between controls and cases with a single small tubular adenoma were not significant [35]. Subjects with the highest quartile level of PGE-M shared an approximately 2.5 greater risk of a diagnosis of advanced adenoma or MSTA compared with those with the lowest PGE-M values (OR=2.53, 95% confidence interval=1.54-4.14, p< 0.001).
In a recent, prospective, case-control study, Bezawada and co-workers have shown that urinary PGE-M is associated with an increased risk for advanced, large, and multiple adenoma. In addition, aspirin or NSAID use seemed to be more strongly associated with a lower risk of adenoma among individuals with high PGE-M levels than in those with low PGE-M [34].
In a matched case-control study, Davenport and colleagues evaluated both plasma CRP, a pro-inflammatory protein, and urinary PGE-M in four subjects groups: patients with a single small tubular adenoma, MSTA patients, patients with at least one advanced adenoma, and polyp-free controls. There was no apparent association between CRP level and the risk of single small tubular adenoma. A dose-response relationship with CRP was observed for risk of either MSTA or advanced adenoma. Combined analysis of CRP and PGE-M indicated that the risk of MSTA or advanced adenoma was greatest among subjects with high levels of both CRP and PGE-M than in those with low CRP and PGE-M.
Meta-analysis of the data from the five studies confirmed that PGE-M levels are strongly associated with an increased risk for MSTA, advanced adenoma, and CRC. The increase in urinary PGE-M in patients with CRC and large adenomas suggests that urinary PGE-M is a potentially useful biomarker for the detection of advanced CR neoplasms.
Subjects with MSTA or advanced adenoma are at greater risk of a recurrence compared with individuals with single small tubular adenoma [131,132]. The finding that PGE-M was related to MSTA or advanced adenoma and not to simple adenoma may reflect a more substantial effect of PGE2 on tumour progression than on carcinogenesis.
In conclusion, although colonoscopy remains the most effective diagnostic modality for CRC, it generally suffers from poor patient compliance, high cost, and possible complications. The development of more effective methods for early diagnosis, assessment of disease severity, and prognosis would meet all these problems. Growing evidence suggests that urinary screening tests have the potential to respond to these expectations. Particularly, PGE-M seems to be the most promising urinary marker for CRC early detection.
Supplementary Material
Supplementary tables and figures.
Competing Interests
The authors have declared that no competing interest exists.
References
1. Altobelli E, Lattanzi A, Paduano R. et al. Colorectal cancer prevention in Europe: Burden of disease and status of screening programs. Prev Med. 2014;62:132-41
2. Altobelli E, D'Aloisio F, Angeletti PM. Colorectal cancer screening in countries of European Council outside of the EU-28. World J Gastroenterol. 2016;22(20):4946-4957
3. Ferlay J, Soerjomataram I, Dikshit R. et al. Cancer incidence and mortality worldwide: sources, methods and major patterns in GLOBOCAN 2012. Int J Cancer. 2015;136(5):E359-386
4. 2014: assess Your Risk for Colorectal Cancer; Revised 25 march 2016. American Society of Colon and Rectal Surgeons. http://www.fascrs.org/patients/treatments_and_screenings/assess_your_risk_for_colorectal_cancer/screening/
5. El-Shami K, Oeffinger KC, Erb NL. et al. American Cancer Society Colorectal Cancer Survivorship Care Guidelines. CA Cancer J Clin. 2015;65(6):428-455
6. Garborg K. Colorectal Cancer Screening. Surg Clin North Am. 2015;95(5):979-989
7. Brenner H, Altenhofen L, Stock C. et al. Incidence of colorectal adenomas: birth cohort analysis among 4.3 million participants of screening colonoscopy. Cancer Epidemiol Biomarkers Prev. 2014;23(9):1920-197
8. Rubenstein JH, Enns R, Heidelbaugh J. et al. Clinical Guidelines Committee. American Gastroenterological Association Institute Guideline on the Diagnosis and Management of Lynch Syndrome Gastroenterology. 2015;149(3):777-82
9. Samadder NJ, Smith KR, Hanson H. et al. Increased Risk of Colorectal Cancer Among Family Members of All Ages, Regardless of Age of Index Case at Diagnosis. Clin Gastroenterol Hepatol. 2015;13(13):2305-11.e1 -2
10. Sebastian S, Hernández V, Myrelid P. et al. Colorectal cancer in inflammatory bowel disease: results of the 3rd ECCO pathogenesis scientific workshop (I). J Crohns Colitis. 2014;8(1):5-18
11. Cannon J. Colorectal Neoplasia and Inflammatory Bowel Disease. Surg Clin North Am. 2015;95(6):1261-1269
12. Parian A, Koh J, Limketkai BN. et al. Association between serrated epithelial changes and colorectal dysplasia in inflammatory bowel disease. Gastrointest Endoscopy. 2015:5107 (15) 03204-6
13. Lansdorp-Vogelaar I, van Ballegooijen M, Zauber AG. et al. Effect of rising chemotherapy costs on the cost savings of colorectal cancer screening. J Natl Cancer Inst. 2009;101(20):1412-1422
14. Brenner H, Hoffmeister M, Stegmaier C. et al. Risk of progression of advanced adenomas to colorectal cancer by age and sex: estimates based on 840,149 screening colonoscopies. Gut. 2007;56(11):1585-1589
15. Kuntz KM, Lansdorp-Vogelaar I, Rutter CM. et al. A systematic comparison of microsimulation models of colorectal cancer: the role of assumptions about adenoma progression. Med Decis Making. 2011;31(4):530-539
16. Stryker SJ, Wolff BG, Culp CE. et al. Natural history of untreated colonic polyps. Gastroenterology. 1987;93(5):1009-1013
17. Winawer SJ, Zauber AG, Ho MN. et al. Prevention of colorectal cancer by colonoscopic polypectomy. The National Polyp Study Workgroup. N Engl J Med. 1993;329(27):1977-1981
18. Vernon S. Participation in colorectal cancer screening: a review. J Natl Cancer Inst. 1997;89:1406-1422
19. Hundt S, Haug U, Brenner H. Blood markers for early detection of colorectal cancer: a systematic review. Cancer Epidemiol Biomarkers Prev. 2007;16:1935-1953
20. Rawson JB, Bapat B. Epigenetic biomarkers in colorectal cancer diagnostics. Expert Rev Mol Diagn. 2012;12:499-509
21. Ma Y, Zhang P, Wang F. et al. Searching for consistently reported up-and down-regulated biomarkers in colorectal cancer: a systematic review of proteomic studies. Mol Biol Rep. 2012;39:8483-8490
22. Berger BM, Ahlquist DA. Stool DNA screening for colorectal neoplasia: biological and technical basis for high detection rates. Pathology. 2012;44:80-88
23. Xiao W, Zhao H, Dong W. et al. Quantitative detection of methylated NRDG4 gene as a candidate biomarker for diagnosis of colorectal cancer. Oncol Lett. 2015;9:1383-1387
24. Amiot A, Mansour H, Baumgaertner I. et al. The detection of the methylated Wif-1 gene is more accurate than a fecal occult blood test for colorectal cancer screening. PLoS One. 2014;9(7):e99233
25. Hsu WY, Chen CJ, Huang YC. et al. Urinary nucleosides as biomarkers of breast, colon, lung, and gastric cancer in Taiwanese. PLoS One. 2013;8(12):e81701
26. Chandramathi S, Suresh K, Anita ZB. et al. Comparative assessment of urinary oxidative indices in breast and colorectal cancer patients. J Cancer Res Clin Oncol. 2009;135(2):319-323
27. Umemori Y, Ohe Y, Kuribayashi K. et al. Evaluating the utility of N1, N12 - dyacetilspermine and N1, N8 - dyacetilspermidine in urine as tumour markers for breast and colorectal cancers. Clin Chim Acta. 2010;411:1894-1899
28. Hiramatsu K, Takahashi K, Yamaguchi T. et al. N(1),N(12)-Diacetylspermine as a sensitive and specific novel marker for early- and late-stage colorectal and breast cancers. Clin Cancer Res. 2005;11(8):2986-2990
29. Kawakita M, Hiramatsu K, Yanagiya M. et al. Determination of N¹,N¹²-diacetylspermine in urine: a novel tumor marker. Methods Mol Biol. 2011;720:367-378
30. Niu R, Jing H, Chen Z. et al. Differentiating malignant colorectal tumor patients from benign colorectal tumor patients by assaying morning urinary arylsulfatase activity. Asia Pac J Clin Oncol. 2012;8(4):362-367
31. Szajda SD, Borzym-Kluczyk M, Snarska J. et al. N-acetyl-beta-D-hexosaminidase and its isoenzymes A and B in bloodserum and urine, as a potential colon cancermarkers. Hepato-gastroenterol. 2009;56(94-95):1287-9128
32. Davenport JR, Cai Q, Ness RM. et al. Evaluation of pro-inflammatory markers plasma C-reactive protein and urinary prostaglandin-E2 metabolite in colorectal adenoma risk. Mol Carcinog. 2016;55(8):1251-1261
33. Shrubsole M, Cai Q, Wen W. et al. Urinary prostaglandin E2 metabolite and risk for colorectal adenoma. Cancer Prev Res. 2012;5:336-342
34. Bezawada N, Song M, Wu K. et al. Urinary PGE-M levels are associated with risk of colorectal adenomas and chemopreventive response to anti-inflammatory drugs. Cancer Prev Res (Phila). 2014;7(7):758-765
35. Johnson JC, Schmidt CR, Shrubsole MJ. et al. Urine PGE-M: a metabolite of Prostaglandin E2 as a potential biomarker of advanced colorectal neoplasia. Gastroenterol Hepatol. 2006;4:1358-1365
36. Cai Q, Gao YT, Chow WH. et al. Prospective study of urinary prostaglandin E2 metabolite and colorectal cancer risk. Clin Oncol. 2006;24(31):5010-506
37. Moher D, Liberati A, Tetzlaff J. et al. PRISMA Group Preferred Reporting Items for Systematic Reviews and Meta-Analyses: The PRISMA Statement. PLoS Med. 2009;6(6):e1000097
38. Hozo SP, Djulbegovic B, Hozo I. Estimating the mean and variance from the median, range, and the size of a sample. BMC Med Res Methodol. 2005:20 5:13
39. Cohen J. Statistical Power Analysis for the Behavioral Sciences. Hillsdale, New Jersey: Lawrence Erlbaum Associates: Routledge. 1988
40. DerSimonian R, Laird N. Meta-analysis in clinical trials. Control Clin Trials. 1986;7:177-188
41. The Newcastle-Ottawa Scale (NOS) for assessing the quality of nonrandomised studies in meta-analyses. Wells GA, et al. http://www.ohri.ca/programs/clinical_epidemiology/nsgen.pdf
42. Colbert Maresso K, Vilar E, Hawk ET. Urinary PGE-M in colorectal cancer: predicting more than risk? Cancer Prev Res (Phila). 2014;7(10):969-972
43. Warren AD, Kwong GA, Wood DK. et al. Point-of-care diagnostics for non-communicable diseases using synthetic urinary biomarkers and paper microfluidics. Proc Natl AcadSci U S A. 2014;111(10):3671-3676
44. Altobelli E, Marzioni D, Lattanzi A. et al. HtrA1: Its future potential as a novel biomarker for cancer. Oncol Rep. 2015;34(2):555-566
45. Manna SK, Tanaka N, Krausz KW. et al. Biomarkers of coordinate metabolic reprogramming in colorectal tumors in mice and humans. Gastroenterology. 2014;146(5):1313-24
46. Arasaradnam RP, McFarlane MJ, Ryan-Fisher C. et al. Detection of colorectal cancer (CRC) by urinary volatile organic compound analysis. PLoS One. 2014;9(9):e108750
47. Xiao Q, Moore SC, Boca SM. et al. Sources of variability in metabolite measurements from urinary samples. PLoS One. 2014;9(5):e95749
48. Silva CL, Passos M, Câmara JS. Investigation of urinary volatile organic metabolites as potential cancer biomarkers by solid-phase microextraction in combination with gas chromatography-mass spectrometry. Br J Cancer. 2011;105(12):1894-1904
49. Wang W, Feng B, Li X. et al. Urinary metabolic profiling of colorectal carcinoma based on online affinity solid phase extraction-high performance liquid chromatography and ultra- performance liquid chromatography-mass spectrometry. Mol Biosyst. 2010;6(10):1947-1955
50. Wong YH, Chen RH, Chen BS. Core and specific network markers of carcinogenesis from multiple cancer samples. J Theor Biol. 2014;362:17-34
51. Lin Y.-S, Chiu F.-C, Lin J. et al. Association of albuminuria and cancer mortality. Cancer Epidemiol Biomarkers Prev. 2010;19(11):2950-2957
52. Melichar B, Kalábová H, Krčmová LK. et al. Urinary neopterin concentrations during combination therapy with cetuximab in previously treated patients with metastatic colorectal carcinoma. In Vivo. 2014;28(5):953-959
53. Dziaman T, Banaszkiewicz Z, Roszkowski K. et al. 8-Oxo-7,8-dihydroguanine and uric acid as efficient predictors of survival in colon cancer patients. Int J Cancer. 2014;134(2):376-383
54. Uysal M, Bozcuk H, SezginGöksu S. et al. Basal proteinuria as a prognostic factor in patients with metastatic colorectal cancer treated with bevacizumab. Biomed Pharmacother. 2014;68(4):409-412
55. Cross AJ, Major JM, Rothman N. et al. Urinary 1-methylhistidine and 3-methylhistidine, meat intake, and colorectal adenoma risk. Eur J Cancer Prev. 2014;23(5):385-390
56. Pierre F, Peiro G, Taché S. et al. New marker of colon cancer risk associated with heme intake: 1,4-dihydroxynonane mercapturic acid. Cancer Epidemiol Biomarkers Prev. 2006;15(11):2274-2279
57. Vogtmann E, Xiang YB, Li HL. et al. Cruciferous vegetables, glutathione S-transferase polymorphisms, and the risk of colorectal cancer among Chinese men. Ann Epidemiol. 2014;24(1):44-49
58. Murff HJ, Shrubsole MJ, Cai Q. et al. Dietary intake of PUFAs and colorectal polyp risk. Am J Clin Nutr. 2012;95(3):703-712
59. Murff HJ, Shu XO, Li H. et al. A prospective study of dietary polyunsaturated fatty acids and colorectal cancer risk in Chinese women. Cancer Epidemiol Biomarkers Prev. 2009;18(8):2283-2291
60. Moy KA, Yuan JM, Chung FL. et al. Cancer Urinary total isothiocyanates and colorectal cancer: a prospective study of men in Shanghai, China. Cancer Epidemiol Biomarkers Prev. 2008;17(6):1354-1359
61. Sun CL, Yuan JM, Lee MJ. et al. Urinary tea polyphenols in relation to gastric and esophageal cancers: a prospective study of men in Shanghai, China. Carcinogenesis. 2002;23(9):1497-1503
62. Takawa M, Masuda K, Kunizaki M. et al. Validation of the histone methyltransferase EZH2 as a therapeutic target for various types of human cancer and as a prognostic marker. Cancer Sci. 2011;102(7):1298-1305
63. Ohtsuki Y, Kuroda N, Umeoka T. et al. KL-6 is another useful marker in assessing a micropapillary pattern in carcinomas of the breast and urinary bladder, but not the colon. Med Mol Morphol. 2009;42(2):123-127
64. Yoneda K, Iida H, Endo H. et al. Identification of Cystatin SN as a novel tumor marker for colorectal cancer. Int J Oncol. 2009;35(1):33-40
65. Al-Saleh I, Arif J, El-Doush I. et al. Carcinogen DNA adducts and the risk of colon cancer: case-control study. Biomarkers. 2008;13(2):201-216
66. Gazzaniga P, Nofroni I, Gandini O. et al. Tenascin C and epidermal growth factor receptor as markers of circulating tumoral cells in bladder and colon cancer. Oncol Rep. 2005;14(5):1199-1202
67. Saito J, Imamura Y, Itoh J. et al. ELISA measurement for urinary 3-hydroxyproline-containing peptides and its preliminary application to healthy persons and cancer patients. Anticancer Res. 2008;30(3):1007-1014
68. Su YH, Song J, Wang Z. et al. Removal of high-molecular-weight DNA by carboxylated magnetic beads enhances the detection of mutated K-ras DNA in urine. Ann N Y Acad Sci. 2008;1137:82-91
69. Waszkiewicz N, Zalewska-Szajda B, Szajda SD. et al. Lysosomal exoglycosidases and cathepsin D in colon adenocarcinoma. Pol Arch Med Wewn. 2012;22(11):551-556
70. Song BP, Jain S, Lin SY. et al. Detection of hypermethylated vimentin in urine of patients with colorectal cancer. J Mol Diagn. 2012;14(2):112-129
71. Rozalski R, Gackowski D, Siomek-Gorecka A. et al. Urinary 5-hydroxymethyluracil and 8-oxo-7,8-dihydroguanine as potential biomarkers in patients with colorectal cancer. Biomarkers. 2015;20(5):287-291
72. Cheng Y, Xie G, Chen T. et al. Distinct urinary metabolic profile of human colorectal cancer. J Proteome Res. 2012;11(2):1354-1363
73. Feng B, Zheng MH, Zheng YF. et al. Normal and modified urinary nucleosides represent novel biomarkers for colorectal cancer diagnosis and surgery monitoring. J Gastroenterol Hepatol. 2005;20(12):1913-1919
74. Zheng YF, Yang J, Zhao XJ. et al. Urinary nucleosides as biological markers for patients with colorectal cancer. World J Gastroenterol. 2005;11(25):3871-3876
75. El-Masry S, El-Sayed IH, Lotfy M. et al. Utility of slot-blot-ELISA as a new, fast, and sensitive immunoassay for detection of carcinoembryonic antigen in the urine samples of patients with various gastrointestinal malignancies. J Immunoassay Immunochem. 2007;28(2):91-105
76. Church TR, Wandell M, Lofton-Day C. et al. Prospective evaluation of methylated SEPT9 in plasma for detection of asymptomatic colorectal cancer. Gut. 2014;63(2):317-325
77. Imperiale TF, Ransohoff DF, Itzkowitz SH. et al. Multi target stool DNA testing for colorectal-cancer screening. N Engl J Med. 2014;370(14):1287-1297
78. Lenhard K, Bommer GT, Asutay S. et al. Analysis of promoter methylation in stool: a novel method for the detection of colorectal cancer. Clin Gastroenterol Hepatol. 2005;3(2):142-149
79. Lange CP, Campan M, Hinoue T. et al. Genome-scale discovery of DNA-methylation biomarkers for blood-based detection of colorectal cancer. PLoS One. 2012;7(11):e50266
80. Cassinotti E, Melson J, Liggett T. et al. DNA methylation patterns in blood of patients with colorectal cancer and adenomatous colorectal polyps. Int J Cancer. 2012;131(5):1153-1157
81. Heyn H, Esteller M. DNA methylation profiling in the clinic: applications and challenges. Nat Rev Genet. 2012;13(10):679-692
82. Grady WM, Rajput A, Lutterbaugh JD. et al. Detection of aberrantly methylated hMLH1 promoter DNA in the serum of patients with microsatellite unstable colon cancer. Cancer Res. 2001;61(3):900-902
83. Shivapurkar N, Gazdar AF. DNA methylation based biomarkers in non-invasive cancer screening. Curr Mol. Med. 2010;10(2):123-132
84. Lange CP, Laird PW. Clinical applications of DNA methylation biomarkers in colorectal cancer. Epigenomics. 2013;5(2):105-108
85. Olinski R, Gackowski D, Rozalski R. et al. Oxidative DNA damage in cancer patients: a cause or a consequence of the disease development? Mutat Res. 2003;531(1-2):177-190
86. Guina T, Biasi F, Calfapietra S. et al. Inflammatory and redox reactions in colorectal carcinogenesis. Ann N Y Acad Scil. 2015;1340:95-103
87. Xu G, Schmid HR, Lu X. et al. Excretion pattern investigation of urinary normal and modified nucleosides of breast cancer patients by RP-HPLC and factor analysis method. Biomed Chromatogr. 2000;14(7):459-463
88. Zheng YF, Xu GW, Liu DY. et al. Study of urinary nucleosides as biological marker in cancer patients analyzed by micellar electrokinetic capillary chromatography. Electrophoresis. 2002;23(24):4104-4109
89. Kim KR, La S, Kim A, Kim JH. et al. Capillary electrophoretic profiling and pattern recognition analysis of urinary nucleosides from uterine myoma and cervical cancer patients. J Chromatogr B Biomed Sci Appl. 2001;754(1):97-106
90. La S, Cho JH, Kim JH, Kim KR. Capillary electrophoretic profiling and pattern recognition analysis of urinary nucleoside from thyroid cancer patients. Anal Chim Acta. 2003;486:171-182
91. Zwierz K, Zalewska A, Zoch-Zwierz A. Isoenzymes of N-acetyl-beta-hexosaminidase. Acta Biochim Pol. 1999;46(3):739-751
92. Wielgat P, Walczuk U, Szajda S. et al. Activity of lysosomal exoglycosidases in human gliomas. J Neurooncol. 2006;80(3):243-249
93. Borzym-Kluczyk M, Radziejewska I, Olszewska E. et al. (2007) Statistical evaluation of the isoform patterns of N-acetyl-beta-hexosaminidase from human renal cancer tissue separated by isoelectrofocusing. Clin Biochem. 2007;40(5-6):403-406
94. Szajda SD, Snarska J, Jankowska A. et al. Cathepsin D and carcino-embryonic antigen in serum, urine and tissues of colon adenocarcinoma patients. Hepato-Gastroenterol. 2008;55(82-83):388-393
95. O'Dowd BF, Cumming DA, Gravel RA. et al. Oligosaccharide structure and amino acid sequence of the major glycopeptides of mature human beta-hexosaminidase. Biochemistry. 1988;27(14):5216-5226
96. Sardiello M, Annunziata I, Roma G. et al. Sulfatases and sulfatase modifying factors: an exclusive and promiscuous relationship. Hum Mol Genet. 2005;14(21):3203-3217
97. Ong ES, Zou L, Li S, Cheah PY. et al. Metabolic profiling in colorectal cancer reveals signature metabolic shifts during tumorigenesis. Mol Cell Proteomics. 2010 February 10
98. Qiu Y, Cai G, Su M, Chen T. et al. Serum metabolite profiling of human colorectal cancer using GC-TOFMS and UPLC-QTOFMS. J Proteome Res. 2009;8(10):4844-4850
99. Qiu Y, Cai G, Su M. et al. Urinary metabonomic study on colorectal cancer. J Proteome Res. 2010;9(3):1627-1634
100. Cheng Y, Xie G, Chen T. et al. Distinct urinary metabolic profile of human colorectal cancer. J Proteome Res. 2012;11(2):1354-1363
101. Coffino P. Regulation of cellular polyamines by antizyme. Nat Rev Mol Cell Biol. 2010:188-194
102. Kawakita M, Hiramatsu K. Diacetylated derivatives of spermine and spermidine as novel promising tumor markers. J Biochem. 2006;139:315-322
103. Russell DH, Levy CC, Schimpff SC. et al. Urinary polyamines in cancer patients. Cancer Res. 1971;31:1555-1558
104. Allende T, García Muñiz JL, Vizoso F. et al. Preoperative serum levels of the carcinoembryonic antigen (CEA) and prognosis in colorectal cancer. Rev. Exp.Med. 2001;20(5):358-364
105. Eberhart CE, Coffey RJ, Radhika A. et al. Up-regulation of cyclooxygenase 2 gene expression in human colorectal adenomas and adenocarcinomas. Gastroenterology. 1994;107(4):1183-1188
106. Arber N, Eagle CJ, Spicak J. et al. Celecoxib for the prevention of colorectal adenomatous polyps. N Engl J Med. 2006;355(9):885-895
107. Cole BF, Logan RF, Halabi S. et al. Aspirin for the chemoprevention of colorectal adenomas: meta-analysis of the randomized trials. J Natl Cancer Inst. 2009;101(4):256-266
108. Cuzick J, Otto F, Baron JA. et al. Aspirin and non-steroidal anti-inflammatory drugs for cancer prevention: an international consensus statement. Lancet Oncol. 2009;10(5):501-507
109. Bertagnolli MM, Eagle CJ, Zauber. et al. Five-year efficacy and safety analysis of the Adenoma Prevention with Celecoxib Trial. Cancer Prev Res (Phila). 2009;2(4):310-321
110. Thun MJ, Henley SJ, Patrono C. Non steroidalanti-inflammatory drugs as anticancer agents: Mechanistic, pharmacologic, and clinical issues. J Natl Cancer Inst. 2002;94:252-266
111. Chan TA. Nonsteroidal anti-inflammatory drugs, apoptosis, and colon-cancer chemoprevention. Lancet Oncol. 2002;3:166-174
112. Baron JA. Epidemiology of non-steroidal anti-inflammatory drugs and cancer. Prog Exp Tumor Res. 2003;37:1-24
113. Baron JA, Cole BF, Sandler RS. et al. A randomized trial of aspirin to prevent colorectal adenomas. N Engl J Med. 2003;348(10):891-899
114. Giardiello FM, Hamilton SR, Krush AJ. et al. Treatment of colonic and rectal adenomas with sulindac in familial adenomatous polyposis. N Engl J Med. 1993;328(18):1313-1316
115. Steinbach G, Lynch PM, Phillips RK. et al. The effect of celecoxib, a cyclooxygenase-2 inhibitor, in familial adenomatous polyposis. N Engl J Med. 2000;342(26):1946-19452
116. Wendum D, Masliah J, Trugnan G. et al. Cyclooxygenase-2 and its role in colorectal cancer development. Virchows Arch. 2004;445(4):327-333
117. Brown JR, DuBois RN. COX-2: A molecular target for colorectal cancer prevention. J Clin Oncol. 2005;23:2840-2855
118. Gupta RA, DuBois RN. Colorectal cancer prevention and treatment by inhibition of cyclooxygenase-2. Nat Rev Cancer. 2001;1:11-21
119. Rigas B, Goldman IS, Levine L. Altered eicosanoid levels in human colon cancer. J Lab Clin Med. 1993;122(5):518-523
120. Sheng H, Shao J, Morrow JD. et al. Modulation of apoptosis and Bcl-2expression by prostaglandin E2 in human colon cancer cells. Cancer Res. 1998;58(2):362-366
121. Salcedo R, Zhang X, Young HA. et al. Angiogenic effects of prostaglandin E2 are mediated by up-regulation of CXCR4 on human microvascular endothelial cells. Blood. 2003;102(6):1966-1977
122. Jones MK, Wang H, Peskar BM, et al (1999) Inhibition of angiogenesis by nonsteroidal anti-inflammatory drugs. insight into mechanisms and implications for cancer growth and ulcer healing. Nat Med. 1999;5(12):1418-2143
123. Chell SD, Witherden IR, Dobson RR. et al. Increased EP4 receptor expression in colorectal cancer progression promotes cell growth and anchorage independence. Cancer Res. 2006;66(6):3106-3113
124. Wang D, Buchanan FG, Wang H. et al. Prostaglandin E2 enhances intestinal adenoma growth via activation of the Ras-mitogen-activated protein kinase cascade. Cancer Res. 2005;65(5):1822-1829
125. Gustafsson A, Andersson M, Lagerstedt K. et al. Receptor andenzyme expression for prostanoid metabolism in colorectal cancer related to tumor tissue PGE2. Int J Oncol. 2010;36(2):469-478
126. Sheng H, Shao J, Washington MK. et al. Prostaglandin E2 increases growth and motility of colorectal carcinoma cells. J Biol Chem. 2001;276(21):18075-18081
127. Pugh S, Thomas GA. Patients with adenomatous polyps and carcinomas have increased colonic mucosal prostaglandin E2. Gut. 1994;35(5):675-678
128. Myung SJ, Rerko RM, Yan M. et al. 15-Hydroxyprostaglandindehydrogenase is an in vivo suppressor of colon tumorigenesis. Proc Natl Acad Sci. USA. 2006;103(32):12098-102
129. Backlund MG, Mann JR, Holla VR. et al. 15-Hydroxyprostaglandin dehydrogenase is down-regulated in colorectal cancer. J Biol Chem. 2005;280(5):3217-3223
130. Bos CL, Richel DJ, Ritsema T. et al. Prostanoids and prostanoid receptors in signal transduction. Int J Biochem Cell Biol. 2004;36(7):1187-1205
131. Saini SD, Kim HM, Schoenfeld P. Incidence of advanced adenomas at surveillance colonoscopy inpatients with a personal history of colon adenomas: a meta-analysis and systematic review. Gastrointest Endosc. 2006;64(4):614-626
132. de Jonge V, Sint Nicolaas J, van Leerdam ME. et al. Systematic literature review and pooled analyses of risk factors for finding adenomas at surveillance colonoscopy. Endoscopy. 2011;43(7):560-574
Author contact
![]() Corresponding author: Prof. Emma Altobelli - Department of Life, Health and Environmental Sciences, University of L'Aquila, Piazzale Salvatore Tommasi 1, 67100, Coppito (Aq), Italy. e-mail: emma.altobelliunivaq.it; phone: +39 0862434666; fax: +39 0862433425. Reprints to: Prof. Emma Altobelli - Department of Life, Health and Environmental Sciences, University of L'Aquila, Piazzale Salvatore Tommasi 1, 67100, Coppito (Aq), Italy.
Corresponding author: Prof. Emma Altobelli - Department of Life, Health and Environmental Sciences, University of L'Aquila, Piazzale Salvatore Tommasi 1, 67100, Coppito (Aq), Italy. e-mail: emma.altobelliunivaq.it; phone: +39 0862434666; fax: +39 0862433425. Reprints to: Prof. Emma Altobelli - Department of Life, Health and Environmental Sciences, University of L'Aquila, Piazzale Salvatore Tommasi 1, 67100, Coppito (Aq), Italy.