Impact Factor ISSN: 1837-9664

 Global reach, higher impact
J Cancer 2016; 7(12):1587-1598. doi:10.7150/jca.16012 This issue Cite
Research Paper
African American Race is an Independent Risk Factor in Survival from Initially Diagnosed Localized Breast Cancer
Robert Wieder1 ![]() , Basit Shafiq2, Nabil Adam2
, Basit Shafiq2, Nabil Adam2
1. Department of Medicine, Rutgers New Jersey Medical School and the New Jersey Medical School Cancer Center, Rutgers Biomedical and Health Sciences;
2. Rutgers Institute for Data Science, Learning, and Applications and the Center for Information Management, Integration, and Connectivity, Rutgers Newark.
Received 2016-4-29; Accepted 2016-6-4; Published 2016-7-18
Abstract
BACKGROUND: African American race negatively impacts survival from localized breast cancer but co-variable factors confound the impact.
METHODS: Data sets were analyzed from the Surveillance, Epidemiology and End Results (SEER) directories from 1973 to 2011 consisting of patients with designated diagnosis of breast adenocarcinoma, race as White or Caucasian, Black or African American, Asian, American Indian or Alaskan Native, Native Hawaiian or Pacific Islander, age, stage I, II or III, grade 1, 2 or 3, estrogen receptor or progesterone receptor positive or negative, marital status as single, married, separated, divorced or widowed and laterality as right or left. The Cox Proportional Hazards Regression model was used to determine hazard ratios for survival. Chi square test was applied to determine the interdependence of variables found significant in the multivariable Cox Proportional Hazards Regression analysis. Cells with stratified data of patients with identical characteristics except African American or Caucasian race were compared.
RESULTS: Age, stage, grade, ER and PR status and marital status significantly co-varied with race and with each other. Stratifications by single co-variables demonstrated worse hazard ratios for survival for African Americans. Stratification by three and four co-variables demonstrated worse hazard ratios for survival for African Americans in most subgroupings with sufficient numbers of values. Differences in some subgroupings containing poor prognostic co-variables did not reach significance, suggesting that race effects may be partly overcome by additional poor prognostic indicators.
CONCLUSIONS: African American race is a poor prognostic indicator for survival from breast cancer independent of 6 associated co-variables with prognostic significance.
Keywords: Breast Cancer, African American Race, Risk factor, confounding co-variables, survival.
Introduction
While the incidence of localized breast cancer remains consistently higher in Caucasian women than in African American women, the odds of survival remain lower in African Americans [1]. Survival disparities have been investigated extensively [1-4] but many of the results were confounded by co-varying factors that impact outcomes.
Studies have demonstrated that younger age [5-12], later stage [13], higher grade [13-15], ER and/or PR negative tumor staining [16-19] and single marital status [20] are associated with an unfavorable prognosis to patients who present with localized breast cancer. In this context, African American women are diagnosed with breast cancer at a younger age [13], higher stage [21, 22], with higher grade [23], higher rate of ER- and PR- cancers [21, 24, 25] and a higher incidence of single status than Caucasians [20, 21]. These factors are recognized by many as contributing significantly to the lower survival of African American women. However, these variables reflect characteristics from two broad categories that influence survival in breast cancer: social factors and biologic factors.
In fact, studies that controlled for some of these variables consistently demonstrated a worse outcome for African American Women [26]. African American women with localized disease had worse outcome when controlled for ER/PR status [22, 27, 28], grade and stage [23], age, stage, ER and Her2 [29, 30], stage and hormone receptor status in women under 50 [31]. Such results are commonly believed to be due to the impact of social differences between African Americans and Caucasians [26, 32]. These differences include comorbid conditions that co-vary with obesity and socioeconomic status [33, 34], delay in starting treatment [4, 35-38], inappropriate or undertreatment [39-43], lack of completion of adjuvant chemotherapy [44], delays in utilization of and adherence to hormonal therapy [45, 46] and participation in clinical trials [47, 48], for example.
However, when matched with Caucasian cohorts and after correcting for delays in chemotherapy initiation and completion of treatment, as well as other known predictors of outcome, African American women still had worse disease-specific survival [49]. Similarly, when controlled for decreased delivery of treatment, African American Women who participated in clinical trials had shorter survival than Caucasians in several reports [50-52]. These controlled studies suggest that additional biologic factors may play significant roles that could contribute to or even trump the impact of social factors on survival outcome in African American women with breast cancer. Many studies suggested that genetic differences in breast cancers between African American and Caucasian women contribute to their more aggressive behavior (reviewed by Daly and Olapade) [26]. A large number of genes are differentially expressed in tumors from African Americans compared to those from Caucasians [53]. This difference, as well as the diversity of gene expression, increases dramatically with stage, suggesting increased genomic instability with tumor progression in African Americans. [53]. Genes related to p53 and BRCA1 subnetworks, aurora B and polo-like kinase signal pathways and Resistin, related to type II diabetes and obesity, were notable by their increased expression [53]. The upregulation of BRCA1 networks is not associated with an increased incidence of BRCA1 or BRCA2 mutations, however, but African Americans have a significantly higher sequence variation than Caucasians in these genes [54]. While there are no significant differences in p53 mutation rates [55], specific p53 mutations may have a higher impact on survival of African American women whose tumors bear this mutation than on Caucasian women [56]. Tumors in African American patients had higher S-phase than those in Caucasians, suggesting additional genetic driver differences [55]. Differences in the tumor microenvironment may also lead to higher rates of basal breast cancer [57], vascularization and macrophage infiltration [58] in tumors from African American patients. Conspicuously, overexpression of Her2 was found to not have a significant difference between African Americans and Caucasians [27, 55].
Deconvoluting the contributions of age, stage, grade, ER, PR and marital status at the time of presentation with local disease in order to support either of the opposing arguments for social vs. biological causes of decreased survival in this population has been difficult. Such analyses have been challenging because data also suggest that these prognostic variables co-vary among each other. Limited studies of databases of varied sources and sizes have reported that younger patients with localized breast cancer have tumors of more advanced stage [7, 8], higher grade [7, 8], lower rate of ER and/or PR positive staining [7, 8] and are more often single than older patients at presentation [20]. Data have also suggested that the stage of localized disease at the time of diagnosis co-varies with grade [23, 59], ER and PR status [60] and marital status [20]. In addition, grade was also shown to co-vary with ER and PR status [60-62]. In one study, no association was found between ER or PR status and marital status in patients aged 65 or older but data for the overall population was not generated [20]. An unexplained higher incidence of left laterality has been observed in the presentation of breast cancer [63] but did not affect survival and was not associated with race [21, 63], presenting a good negative control in studying the effects of prognostic co-variates on race.
The purpose of this study is to test the hypothesis that breast cancers in African American women result in worse prognosis, regardless of the specific biologic or social impact of age, stage, grade, ER, PR or marital status using a comprehensive analysis of the SEER database.
Materials and Methods
Data and Patients
The study was approved by the Rutgers Biomedical and Health Sciences Institutional Review Board-Newark. We used the Surveillance, Epidemiology and End Results (SEER) database of the National Cancer Institute from 1973 to 2011 [64]. The total number of breast cancer cases reported in the SEER database is 1,307,298 cases.
We considered patients with ICD-O-3 diagnostic codes 8500 (840,116 cases), 8522 (72,486 cases), 8523 (53,169 cases), 8524 (3,035 cases) and 8543 (2,863 cases), for a total of 971,669 cases containing the description of adenocarcinoma of the breast. We restricted our analysis to race classifications defined by the United States Office of Management and Budget as White or Caucasian, Black or African American, Asian, American Indian or Alaskan Native, Native Hawaiian or other Pacific Islander for a total of 968,011 cases. Races classified as Other or Unknown totaled 3,658 and were not analyzed.
The data set was narrowed to include only patients who were newly diagnosed with stages I, II and III, who had a clear designation of tumor grade as 1, 2 or 3, who had a clear designation of estrogen receptor (ER) status as positive or negative, who had a clear designation of progesterone receptor (PR) status as positive or negative, whose age was designated, whose marital status was recorded as being single, married, separated, divorced or widowed, and whose breast cancer laterality was recorded as either right or left. For the purposes of analysis, ages were grouped into decades that included ages under 20 to 25 (20 years), 26-35 (30 years), 36-45 (40 years), 46-55 (50 years), 56-65 (60 years), 66-75 (70 years), 76-85 (80 years) and 86 and older (90+ years).
Statistical Analysis
We defined survival as the time from first diagnosis of breast cancer to death from any cause. We used the Kaplan-Meier method to generate survival curves and used a Log-rank test to compare survival curves [65]. We used Cox Proportional hazards regression analysis to determine hazard ratios for survival. The predictor variables were: race, age (in 10 years increments), stage, grade, ER status, PR status, marital status, and laterality. Caucasians were considered the base group for race, age 50 was the base group for age, stage I was the base group for stage, grade 1 was the base group grade, ER and PR positive status were considered the base groups for each hormone receptor category, respectively, single was the base group for marital status and right was the base group for laterality. Pearson Chi-square value (p-value) less than or equal to 0.05 was considered statistically significant. We analyzed the data for co-variations among all of the statistically significant predictor variables using the Chi-square test. To control the confounding effect of the predictor variable, we stratified the data by single predictor variable, three predictor variables, and four predictor variables. For each of these stratifications, we computed estimates of hazard ratios and associated 95% confidence intervals of African American versus Caucasian patients using the Cox Proportional Hazards Regression model. All statistical analyses were performed using R Version 3.1.1 and R Studio Version 0.98.1056 (The R Foundation, Vienna, Austria) statistical software.
Results
Population characteristics
A population of 413,437 patients with identified characteristics for all of the variables were analyzed (Table 1). Caucasians represented the vast majority of patients and African Americans were 11.3% as frequent as Caucasians. Stage I disease was most common and stage III was the least prevalent at of the cases. Grade 2 tumors were most prevalent, grade 3 tumors somewhat less frequent and grade 1 tumors were relatively infrequent. ER+ and PR+ tumors were most frequent, with 78% and 68% of the cases, respectively. Most patients were married in 60% of the samples, with single, divorced, and widowed patients being relatively infrequent in the 10-16% range, each. Separated patients represented about 1% of patients. The most common age group was 60 years at 27%, followed by the 50 year group at 23%, the 40, 70 and 80 year groups at 14-18% range each. Laterality had a consistent 2% edge of left sided malignancies.
Characteristics of SEER data patients with breast cancer
| Total | 1,307,298 | |
| Total cases for analysis | 968,011 | |
| Dataset analyzed | 413,437 | |
| Race or Ethnicity | % in category | |
| Caucasians | 341,210 | 82.5 |
| African Americans | 38,462 | 9.3 |
| Native Americans | 1,937 | 0.5 |
| Asians | 27,656 | 6.7 |
| Hawaiian/Pacific Islanders | 4,172 | 1.0 |
| Age grouping | ||
| 20 | 539 | 0.1 |
| 30 | 8,851 | 2.1 |
| 40 | 59,448 | 14.4 |
| 50 | 92,983 | 22.5 |
| 60 | 111,960 | 27.1 |
| 70 | 72,464 | 17.5 |
| 80 | 56,126 | 13.6 |
| 90+ | 11,066 | 2.7 |
| Stage | ||
| I | 205,540 | 49.7 |
| II | 151,959 | 36.8 |
| III | 55,938 | 13.5 |
| Grade | ||
| 1 | 77,777 | 18.8 |
| 2 | 177,756 | 43.0 |
| 3 | 157,904 | 38.2 |
| ER Status | ||
| + | 323,937 | 78.4 |
| - | 89,500 | 21.6 |
| PR Status | ||
| + | 281,703 | 68.1 |
| - | 131,734 | 31.9 |
| Marital Status | ||
| Single | 53,491 | 12.9 |
| Married | 247,073 | 59.8 |
| Separated | 3,868 | 0.9 |
| Divorced | 44,232 | 10.7 |
| Widowed | 64,773 | 15.7 |
| Laterality | ||
| Right | 203,686 | 49.3 |
| Left | 209,751 | 50.7 |
| Alive/Dead | ||
| Alive | 326,681 | 79.0 |
| Died of Cancer | 41,271 | 10.0 |
| Died of other reasons | 45,485 | 11.0 |
1. Race: Caucasian, African American, Native American, Asian, Hawaiian and Pacific Islander
2. Age at Diagnosis: excluding patient with unknown age
3. Stages : I, II, and III only
4. Grades : 1, 2, and 3 only
5. ER status: Positive and Negative only
6. PR status: Positive and Negative only
7. Marital Status: Single, Married, Separated, Divorced and Widowed only
8. Laterality : Right and Left only
Predictor Variables Affecting Survival from Stage I-III Breast Cancer
Table 2 demonstrated the factors that affected the hazard ratios for survival. Using Caucasian race as a base, African Americans and Native Americans had consistently and significantly higher hazard ratios while Asians and Hawaiian of Pacific Islanders had significantly lower hazard ratio than Caucasians
Cox Proportional hazards Regression Model for overall death after initial surgical diagnosis in women with stage I-III adenocarcinoma of the breast.
| Variables | Hazard Ratio (Confidence Intervals) | p (Pearson Chi Square) |
|---|---|---|
| Race (Caucasian as base) | ||
| African American | 1.36(1.34-1.39) | 0 |
| Native American | 1.40(1.27-1.53) | 3.68×10⁻¹² |
| Asian | 0.82(0.80-0.85) | 0 |
| Hawaiian or Pacific Islander | 0.72(0.65-0.79) | 7.14×10⁻¹¹ |
| Age (years, 50 years as base) | ||
| 20 | 1.32 (1.08-1.59) | 0.0056 |
| 30 | 1.24 (1.18-1.31) | 0 |
| 40 | 1.01 (0.98-1.04) | N.S.* |
| 60 | 1.40 (1.37-1.43) | 0 |
| 70 | 2.58 (2.52-2.65) | 0 |
| 80 | 5.17 (5.05-5.30) | 0 |
| 90 | 10.97 (10.62-11.35) | 0 |
| Stage (Stage I as base) | ||
| II | 1.53 (1.51-1.55) | 0 |
| III | 3.41 (3.35-3.48) | 0 |
| Grade (Grade 1 as base) | ||
| 2 | 1.20 (1.17-1.22) | 0 |
| 3 | 1.49 (1.46-1.53) | 0 |
| ER status (ER positive as base) | ||
| Negative | 1.27 (1.25-1.30) | 0 |
| PR status (PR positive as base) | ||
| Negative | 1.16 (1.14-1.18) | 0 |
| Marital status (single as base) | ||
| Married | 0.80 (0.78-0.81) | 0 |
| Separated | 1.08 (1.01-1.17) | 0.0361 |
| Divorced | 0.97 (0.94-1.00) | N.S. |
| Widowed | 1.05 (1.03-1.08) | 7.8 x 10⁻⁵ |
| Laterality (right as base) | ||
| Left | 1.01 (1.00-1.02) | N.S. |
*Not Significant
Compared to patients in the 50 year age group at diagnosis, patients in the 20, 30, 60, 70, 80 and 90+ age group had statistically significantly higher hazard ratios for survival. Patients in the 40 year age group did not have a significantly different hazard ratio for survival than ones in the 50 year group.
Patients diagnosed with stage II and III disease had higher hazard ratios for survival than patients with stage I disease. Patients with grade 2 and 3 disease had higher hazard ratios for survival than patients with grade 1 disease. Both ER- and PR- status conferred higher hazard ratios for survival than ER+ and PR+ status, respectively. Married patients had significantly lower hazard ratios for survival than patients who were single at the time of diagnosis. Being separated or widowed conferred slightly higher hazard ratios on survival compared to single status but being divorced did not have a statistically significant impact. Laterality did not impart differences in hazard ratios for survival.
Interdependence of Predictor Variables Affecting Survival from Stage I-III Breast Cancer
As discussed in the Introduction, correlations between some of the above factors have been reported in the literature. We analyzed the data for co-variations among all of these factors in our study population to validate the necessity for single variable analysis with respect to race. Table 3 and Tables S1-6 demonstrated significant co-variations between A) race and age, stage, grade, ER, PR and marital status, between B) age and stage, grade, ER, PR and marital status, between C) stage and grade, ER, PR and marital status, between D) grade and ER, PR and marital status, between E) ER and PR and marital status and between F) PR and marital status. There was no co-variation between race and laterality (data not shown).
Associations among co-variables in the dataset analyzed (+ indicates statistical significance Chi-Square analysis).
| Age | Stage | Grade | ER | PR | Marital Status | |
|---|---|---|---|---|---|---|
| A) Race | + | + | + | + | + | + |
| B) Age | + | + | + | + | + | |
| C) Stage | + | + | + | + | ||
| D) Grade | + | + | + | |||
| E) ER | + | + | ||||
| F) PR | + |
Hazard ratios for survival of African American vs. Caucasian patients stratified by single predictor variables
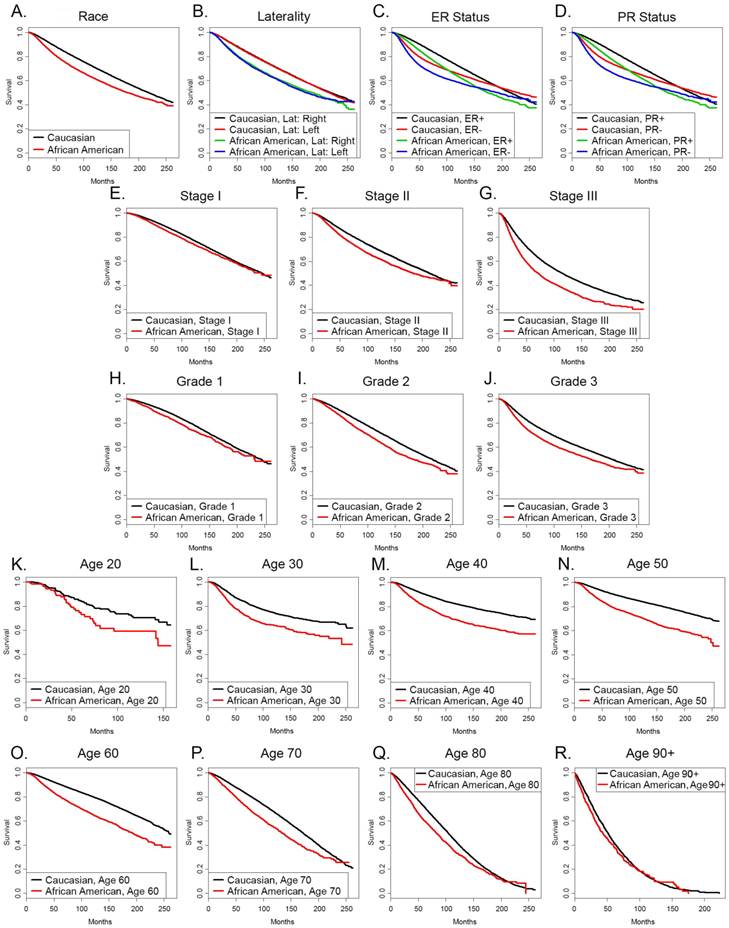
We stratified the groups by the individual categories and compared the hazard ratios for survival of African American patients with those of Caucasian patients. Table 4 demonstrates that the hazard ratios for survival of African Americans were significantly greater than those of Caucasian patients in all eight age groups stratified by deciles, in all three stages, all three grades, in patients with both ER+ and ER- tumors and PR+ and PR- tumors, in single, married, divorced, separated and widowed patients and patients with right sided and left sided tumors. The increased hazard ratios were evident in categories where African Americans were more frequent than their representation in the entire breast cancer data set analyzed of 0.113 times the number of Caucasians (bold values in right hand column), as well as categories where they were relatively underrepresented. Figure 1 depicts the Kaplan Meyer survival curves stratified by the different categories. Of interest, the ER+ and ER- survival curves and the PR+ and PR- survival curves intersect in both Caucasians and African Americans and deaths in the ER+ and PR+ populations eventually overtake the deaths in the ER- and PR- populations, respectively. However, this occurs at about 200 months in Caucasians and at about 160 months African Americans with the ER markers and 260 months and 220 months, respectively in the PR markers. Of note, survival curves for ER- Caucasian patients and ER+ African American patients intersect at 120 months, denoting that the long term outcome for Caucasians with ER- tumors was better than that of African Americans with ER+ tumors. The data were similar in the survival curves grouped by PR status.
Hazard ratio for death from all causes in African Americans vs. Caucasians after initial surgical diagnosis of breast cancer stratified by the single variables of age (10 yr. increments), stage, grade, ER status, PR status, marital status or laterality.
| Variables | Hazard Ratio (Confidence Intervals) | p (Pearson Chi Square) | Number of patients (Caucasian /African American) | Caucasians Percent in Category | African Americans Percent in category | African Americans/ Caucasians (Ratio to population) |
|---|---|---|---|---|---|---|
| All Patients | 1.37(1.34-1.40) | 0 | 341210/38462 | 0.113 | ||
| Age (10 year groupings) | ||||||
| 20 | 1.67 (1.09-2.56) | 0.0179 | 354/ 119 | 0.1 | 0.3 | 0.336 (2.97) |
| 30 | 1.64 (1.46-1.85) | < 10-6 | 6483/ 1382 | 1.9 | 3.6 | 0.213 (1.88) |
| 40 | 1.96 (1.85-2.07) | 0 | 45745/ 7141 | 13.4 | 18.6 | 0.156 (1.38) |
| 50 | 2.12 (2.02-2.23) | 0 | 74360/ 9727 | 21.8 | 25.3 | 0.131 (1.16) |
| 60 | 1.96 (1.87-2.05) | 0 | 92657/10163 | 27.2 | 26.4 | 0.110 (0.97) |
| 70 | 1.56 (1.48-1.64) | 0 | 62055/ 5519 | 18.2 | 14.3 | 0.089 (0.79) |
| 80 | 1.34 (1.25-1.41) | 0 | 49610/ 3690 | 14.5 | 9.6 | 0.074 (0.65) |
| 90 | 1.14 (1.03-1.25) | 0.0087 | 9946/ 721 | 2.9 | 1.9 | 0.072 (0.64) |
| Stage | ||||||
| I | 1.19 (1.14-1.24) | < 10-6 | 174851/14570 | 51.2 | 37.9 | 0.083 (0.73) |
| II | 1.31 (1.27-1.36) | 0 | 122530/16475 | 35.9 | 42.8 | 0.134 (1.19) |
| III | 1.49 (1.43-1.54) | 0 | 43829/ 7417 | 12.9 | 19.3 | 0.169 (1.50) |
| Grade | ||||||
| 1 | 1.29 (1.20-1.40) | < 10-6 | 67926/ 4272 | 19.9 | 11.1 | 0.063 (0.56) |
| 2 | 1.37 (1.32-1.42) | 0 | 149476/13492 | 43.8 | 35.1 | 0.090 (0.80) |
| 3 | 1.35 (1.31-1.39) | 0 | 123808/20698 | 36.3 | 53.8 | 0.167 (1.48) |
| ER status | ||||||
| + | 1.42 (1.38-1.46) | 0 | 272897/24422 | 80.0 | 63.5 | 0.089 (0.79) |
| - | 1.31 (1.26-1.35) | 0 | 68313/14040 | 20.0 | 36.5 | 0.206 (1.82) |
| PR status | ||||||
| + | 1.43 (1.38-1.47) | 0 | 237739/20501 | 69.7 | 53.3 | 0.086 (0.76) |
| - | 1.33 (1.29-1.37) | 0 | 103471/17961 | 30.3 | 46.7 | 0.174 (1.54) |
| Marital status | ||||||
| Single | 1.56 (1.49-1.63) | 0 | 38657/10605 | 11.3 | 27.6 | 0.274 (2.42) |
| Married | 1.57 (1.51-1.62) | 0 | 208943/15131 | 61.2 | 39.3 | 0.072 (0.64) |
| Separated | 1.43 (1.22-1.68) | 8.5 x 10⁻⁶ | 2699/ 868 | 0.8 | 2.3 | 0.322 (2.85) |
| Divorced | 1.39 (1.31-1.48) | 0 | 36026/ 5843 | 10.6 | 15.2 | 0.162 (1.43) |
| Widowed | 1.14 (1.10-1.19) | < 10-6 | 54885/ 6015 | 16.1 | 15.6 | 0.110 (0.97) |
| Laterality | ||||||
| Right | 1.46 (1.42-1.51) | 0 | 168235/18832 | 49.3 | 49.0 | 0.112 (0.99) |
| Left | 1.48 (1.43-1.52) | 0 | 172975/19630 | 50.7 | 51.0 | 0.113 (1.00) |
Ratio of African Americans to Caucasians in a category normalized to the ratio of African Americans to Caucasians in the population is indicated in bold if greater than 1.00.
Kaplan-Meyer survival curves of (A) the entire group of Caucasian and African American patients in our SEER dataset, or patients categorized by (B) laterality, (C) ER status, (D) PR status, (E) stage I, (F) stage II, (G) stage III, (H) grade 1, (I) grade 2, (J) grade 3, (K) age 20, (L) age 30, (M) age 40, (N) age 50, (O) age 60, (P) age 70, (Q) age 80, (R) age 90 and over.
Hazard ratios for survival of African American vs. Caucasian patients stratified by three predictor variables
The comparisons in Table 4 remained confounded by the additional variables shown to be significant in Table 2. To further refine the impact of race on survival, we compared the hazard ratios for survival between African Americans and Caucasians stratified by three predictor variables, age, stage and ER or age, stage and PR status (Table 5, Figure 2). Of the sixty categories, 56 were statistically significant. Differences in hazard ratios only in the 80 year old groupings in stage I ER+ and PR+ categories and in stage I and III ER- categories did not rise to statistical significance. Table S7 displays the numbers of patients in in each category. Each of the four categories of 80 year old groupings that were not statistically significant had well over 100 patients, suggesting that the lack of statistical significance was not due to low n values in the cells. The table displays categories where the frequency of African Americans was above 0.113 times that of Caucasians, the value for the breast cancer data set, in bold. Significant differences in hazard ratios were observed in both categories, where African Americans were relatively underrepresented and overrepresented.
Hazard ratio for death from all causes in African Americans vs. Caucasians after initial surgical diagnosis of breast cancer stratified by three variables: age, (10 yr. increments), stage, and ER status, or age, stage and PR status.
| Age | Stage | Hazard Ratio (Confidence Intervals) | p (Pearson Chi Square) | Hazard Ratio (Confidence Intervals) | p (Pearson Chi Square) | Hazard Ratio (Confidence Intervals) | p (Pearson Chi Square) | Hazard Ratio (Confidence Intervals) | p (Pearson Chi Square) |
|---|---|---|---|---|---|---|---|---|---|
| ER+ | ER- | PR+ | PR- | ||||||
| 40 | I | 2.16 (1.76-2.66) | < 10-6 | 1.58 (1.26-1.98) | 8.0 x 10⁻⁵ | 2.00 (1.60-2.49) | < 10-6 | 1.73 (1.40-2.14) | < 10-6 |
| 50 | I | 2.49 (2.14-2.89) | 0 | 1.49 (1.25-1.79) | 1.1 x 10⁻⁵ | 2.41 (2.05-2.84) | 0 | 1.71 (1.45-2.01) | < 10-6 |
| 60 | I | 1.69 (1.50-1.90) | 0 | 1.49 (1.28-1.73) | <10-6 | 1.77 (1.56-2.00) | 0 | 1.55 (1.36-1.78) | < 10-6 |
| 70 | I | 1.29 (1.16-1.43) | 2.1 x 10⁻⁶ | 1.37 (1.15-1.62) | 0.0003 | 1.31 (1.16-1.47) | 5.9 x 10⁻⁶ | 1.34 (1.17-1.54) | 3.9 x 10⁻⁵ |
| 80 | I | 1.10 (0.99-1.21) | N.S.* | 1.15 (0.95-1.39) | N.S. | 1.06 (0.95-1.18) | N.S. | 1.22 (1.05-1.40) | 0.0076 |
| 40 | II | 1.77 (1.56-2.02) | 0 | 1.45 (1.29-1.63) | <10-6 | 1.77 (1.54-2.02) | < 10-6 | 1.48 (1.33-1.66) | < 10-6 |
| 50 | II | 1.95 (1.75-2.18) | 0 | 1.36 (1.22-1.51) | <10-6 | 2.07 (1.84-2.33) | 0 | 1.40 (1.27-1.55) | < 10-6 |
| 60 | II | 1.70 (1.54-1.88) | 0 | 1.37 (1.23-1.52) | <10-6 | 1.77 (1.59-1.97) | 0 | 1.45 (1.32-1.60) | < 10-6 |
| 70 | II | 1.44 (1.30-1.60) | < 10-6 | 1.33 (1.16-1.52) | 2.9 x 10⁻⁵ | 1.40 (1.25-1.57) | < 10-6 | 1.44 (1.29-1.62) | < 10-6 |
| 80 | II | 1.22 (1.12-1.34) | 1.8 x 10⁻⁵ | 1.18 (1.02-1.36) | 0.0281 | 1.19 (1.08-1.32) | 0.0007 | 1.28 (1.14-1.45) | 3.9 x 10⁻⁵ |
| 40 | III | 1.71 (1.51-1.94) | 0 | 1.40 (1.24-1.57) | < 10-6 | 1.66 (1.45-1.89) | < 10-6 | 1.48 (1.32-1.65) | < 10-6 |
| 50 | III | 1.77 (1.58-1.98) | 0 | 1.40 (1.26-1.56) | < 10-6 | 1.79 (1.58-2.03) | 0 | 1.46 (1.32-1.62) | < 10-6 |
| 60 | III | 1.78 (1.60-1.98) | 0 | 1.49 (1.33-1.67) | < 10-6 | 1.95 (1.73-2.20) | 0 | 1.50 (1.35-1.66) | < 10-6 |
| 70 | III | 1.33 (1.17-1.52) | 1.3 x 10⁻⁵ | 1.28 (1.08-1.50) | 0.0037 | 1.32 (1.14-1.52) | 0.0002 | 1.32 (1.15-1.53) | 0.0001 |
| 80 | III | 1.41 (1.24-1.60) | < 10-6 | 1.18 (0.99-1.40) | N.S. | 1.40 (1.20-1.62) | 1.3 x 10⁻⁵ | 1.24 (1.08-1.43) | 0.0029 |
*Not Significant.
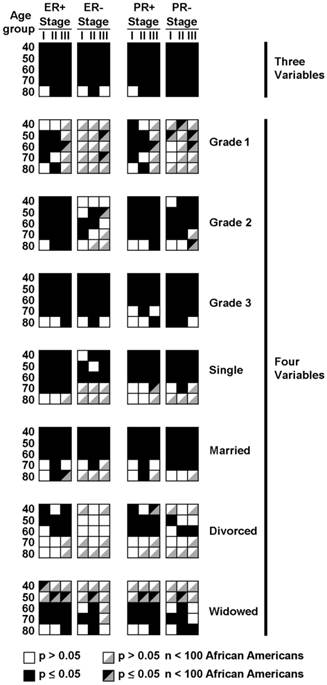
Distribution of cells demonstrating statistically significant differences in the hazard ratio for survival between African American and Caucasian patients with stage I-III breast cancer (black squares). Data are distributed segregated into columns and rows by three variables of estrogen receptor status (ER) or progesterone receptor status (PR) either positive (+) or negative (-), stage I-III and age categories.
Hazard ratios for survival of African American vs. Caucasian patients stratified by four predictor variables
To eliminate the additional confounding factors of grade and marital status, we further stratified the age, stage, and hormone status data by either grade (Table 6 and Figure 2) or by marital status (Tables 7a and 7b and Figure 2). A substantial fraction of groupings yielded significant differences. Many of the cells had few elements, some in the single digits, preventing real differences to be discernable (Tables S8 and S9a and S9b). We denoted individual groupings with an arbitrary cutoff of less than 100 African American patients as not analyzable, shown in Figure 2.
Hazard ratio for death from all causes in African Americans vs. Caucasians after initial surgical diagnosis of breast cancer stratified by four variables: age, (10 yr. increments), stage, grade and ER status, or age, stage, grade and PR status.
| Age | Stage | Hazard Ratio (Confidence Intervals) | p (Pearson Chi Square) | Hazard Ratio (Confidence Intervals) | p (Pearson Chi Square) | Hazard Ratio (Confidence Intervals) | p (Pearson Chi Square) | Hazard Ratio (Confidence Intervals) | p (Pearson Chi Square) |
|---|---|---|---|---|---|---|---|---|---|
| ER+ | ER- | PR+ | PR- | ||||||
| Grade 1 | |||||||||
| 40 | I | 1.88 (0.94-3.76) | N.S.* | 1.58 (0.19-12.9) | N.S. | 2.16 (1.08-4.32) | 0.0305 | 0.75 (0.10-5.78) | N.S. |
| 50 | I | 3.16 (2.26-4.43) | < 10-6 | 1.01 (0.23-4.41) | N.S. | 3.00 (2.08-4.31) | < 10-6 | 2.38 (1.12-5.08) | 0.0249 |
| 60 | I | 1.68 (1.29-2.18) | 0.0001 | 1.29 (0.52-3.24) | N.S. | 1.74 (1.31-2.31) | 0.0002 | 1.34 (0.76-2.36) | N.S. |
| 70 | I | 1.38 (1.13-1.68) | 0.0017 | 0.74 (0.32-1.70) | N.S. | 1.46 (1.18-1.82) | 0.0006 | 0.95 (0.61-1.48) | N.S. |
| 80 | I | 1.08 (0.89-1.30) | N.S. | 1.14 (0.36-3.66) | N.S. | 1.09 (0.88-1.36) | N.S. | 1.05 (0.72-1.54) | N.S. |
| 40 | II | 1.53 (0.72-3.22) | N.S. | 3.59 (0.97-13.3) | N.S. | 1.52 (0.39-3.36) | N.S. | 3.14 (1.03-9.57) | 0.0442 |
| 50 | II | 1.96 (1.29-2.99) | 0.0017 | 1.81 (0.73-4.49) | N.S. | 2.17 (1.42-3.32) | 0.0003 | 1.38 (0.58-3.30) | N.S. |
| 60 | II | 2.04 (1.49-2.78) | 8.0 x 10⁻⁶ | 1.80 (0.53-6.04) | N.S. | 2.64 (1.90-3.65) | < 10-6 | 0.63 (0.27-1.46) | N.S. |
| 70 | II | 1.21 (0.87-1.69) | N.S. | 1.00 (0.42-2.39) | N.S. | 1.15 (0.80-1.66) | N.S. | 1.21 (0.67-2.18) | N.S. |
| 80 | II | 1.60 (1.24-2.07) | 0.0003 | 0.80 (0.11-5.89) | N.S. | 1.61 (1.22-2.12) | 0.0007 | 1.41 (0.74-2.69) | N.S. |
| 40 | III | 1.24 (0.55-2.77) | N.S. | - | N.S. | 1.25 (0.55-2.81) | N.S. | - | N.S. |
| 50 | III | 1.69 (0.92-3.13) | N.S. | 8,07 (1.90-34.4) | 0.0047 | 1.57 (0.80-3.05) | N.S. | 4.46 (1.71-11.6) | 0.0022 |
| 60 | III | 3.09 (1.88-5.01) | 8.8 x 10⁻⁶ | 4.08 (0.88-19.0) | N.S. | 2.63 (1.46-4.73) | 0.0013 | 4.26 (1.88-9.67) | 0.0005 |
| 70 | III | 0.95 (0.44-2.05) | N.S. | 4.60 (1.13-18.7) | 0.0328 | 1.06 (0.46-2.43) | N.S. | 2.12 (0.72-6.24) | N.S. |
| 80 | III | 1.60 (0.97-2.64) | N.S. | 1.73 (0.38-7.92) | N.S. | 1.62 (0.95-2.77) | N.S. | 1.69 (0.60-4.73) | N.S. |
| Grade 2 | |||||||||
| 40 | I | 1.86 (1.34-2.56) | 0.0002 | 1.51 (0.92-2.47) | N.S. | 1.86 (1.33-2.62) | 0.0003 | 1.50 (0.96-2.35) | N.S. |
| 50 | I | 2.19 (1.75-2.75) | <10-6 | 1.43 (0.95-2.16) | N.S. | 2.23 (1.75-2.85) | < 10-6 | 1.55 (1.11-2.17) | 0.0104 |
| 60 | I | 1.77 (1.52-2.07) | <10-6 | 1.60 (1.22-2.11) | 0.0008 | 1.76 (1.48-2.09) | < 10-6 | 1.82 (1.46-2.27) | < 10-6 |
| 70 | I | 1.22 (1.05-1.42) | 0.0106 | 1.41 (1.02-1.93) | 0.0348 | 1.23 (1.04-1.45) | 0.0145 | 1.30 (1.02-1.66) | 0.0347 |
| 80 | I | 1.09 (0.96-1.25) | N.S. | 1.11 (0.81-1.52) | N.S. | 1.06 (0.91-1.23) | N.S. | 1.19 (0.96-1.48) | N.S. |
| 40 | II | 1.81 (1.47-2.22) | < 10-6 | 1.24 (0.90-1.73) | N.S. | 1.74 (1.39-2.18) | 1.2 x 10⁻⁶ | 1.37 (1.03-1.81) | 0.0296 |
| 50 | II | 2.30 (1.95-2.73) | 0 | 1.37 (1.02-1.83) | 0.0361 | 2.31 (1.93-2.77) | 0 | 1.61 (1.25-2.06) | 0.0002 |
| 60 | II | 1.67 (1.44-1.94) | < 10-6 | 1.35 (1.04-1.75) | 0.0248 | 1.68 (1.43-1.99) | < 10-6 | 1.51 (1.22-1.85) | 0.0001 |
| 70 | II | 1.36 (1.16-1.59) | 0.0001 | 1.29 (0.92-1.83) | N.S. | 1.33 (1.12-1.59) | 0.0015 | 1.38 (1.08-1.76) | 0.0098 |
| 80 | II | 1.16 (1.02-1.33) | 0.0283 | 0.99 (0.73-1.33) | N.S. | 1.14 (0.99-1.32) | N.S. | 1.18 (0.94-1.48) | N.S. |
| 40 | III | 1.80 (1.45-2.23) | < 10-6 | 1.16 (0.82-1.64) | N.S. | 1.69 (1.33-2.14) | 1.7 x 10⁻⁵ | 1.39 (1.04-1.86) | 0.0245 |
| 50 | III | 1.91 (1.58-2.30) | < 10-6 | 1.41 (1.01-1.97) | 0.0457 | 2.00 (1.64-2.44) | < 10-6 | 1.33 (1.01-1.75) | 0.0449 |
| 60 | III | 1.79 (1.51-2.14) | < 10-6 | 1.33 (0.99-1.81) | N.S. | 1.92 (1.58-2.35) | < 10-6 | 1.39 (1.10-1.76) | 0.0056 |
| 70 | III | 1.45 (1.18-1.78) | 0.0005 | 1.41 (0.92-2.16) | N.S. | 1.59 (1.27-2.00) | 5.1 x 10⁻⁵ | 1.15 (0.83-1.60) | N.S. |
| 80 | III | 1.40 (1.15-1.71) | 0.0009 | 1.35 (0.91-1.98) | N.S. | 1.29 (1.02-1.64) | 0.0331 | 1.50 (1.15-1.96) | 0.0031 |
| Grade 3 | |||||||||
| 40 | I | 2.16 (1.61-2.89) | < 10-6 | 1.56 (1.20-2.02) | 0.0008 | 1.76 (1.27-2.43) | 0.0006 | 1.77 (1.39-2.26) | 4.2 x 10⁻⁶ |
| 50 | I | 2.19 (1.70-2.82) | < 10-6 | 1.49 (1.22-1.83) | 0.0001 | 2.00 (1.51-2.64) | 1.4 x 10⁻⁶ | 1.62 (1.34-1.96) | < 10-6 |
| 60 | I | 1.37 (1.09-1.72) | 0.0066 | 1.45 (1.20-1.74) | 8.8 x 10⁻⁵ | 1.61 (1.27-2.03) | 8.3 x 10⁻⁵ | 1.34 (1.12-1.60) | 0.0014 |
| 70 | I | 1.29 (1.03-1.60) | 0.0258 | 1.41 (1.15-1.73) | 0.0011 | 1.24 (0.97-1.59) | N.S. | 1.42 (1.18-1.71) | 0.0003 |
| 80 | I | 1.09 (0.88-1.35) | N.S. | 1.16 (0.91-1.48) | N.S. | 1.00 (0.79-1.26) | N.S. | 1.26 (1.01-1.57) | 0.0375 |
| 40 | II | 1.66 (1.40-1.96) | < 10-6 | 1.47 (1.30-1.66) | <10-6 | 1.66 (1.40-1.97) | < 10-6 | 1.49 (1.32-1.68) | < 10-6 |
| 50 | II | 1.54 (1.31-1.80) | < 10-6 | 1.34 (1.20-1.51) | <10-6 | 1.67 (1.41-1.98) | < 10-6 | 1.33 (1.19-1.49) | < 10-6 |
| 60 | II | 1.54 (1.33-1.77) | < 10-6 | 1.36 (1.21-1.53) | <10-6 | 1.52 (1.30-1.78) | < 10-6 | 1.41 (1.27-1.58) | < 10-6 |
| 70 | II | 1.47 (1.27-1.70) | < 10-6 | 1.35 (1.16-1.57) | 7.4 x 10⁻⁵ | 1.40 (1.19-1.65) | 6.3 x 10⁻⁵ | 1.44 (1.26-1.65) | < 10-6 |
| 80 | II | 1.15 (0.99-1.33) | N.S. | 1.25 (1.06-1.47) | 0.0088 | 1.10 (0.93-1.30) | N.S. | 1.28 (1.11-1.48) | 0.0006 |
| 40 | III | 1.65 (1.41-1.92) | < 10-6 | 1.44 (1.26-1.63) | < 10-6 | 1.61 (1.37-1.90) | < 10-6 | 1.49 (1.31-1.68) | < 10-6 |
| 50 | III | 1.61 (1.39-1.87) | < 10-6 | 1.38 (1.23-1.56) | < 10-6 | 1.59 (1.34-1.88) | < 10-6 | 1.44 (1.29-1.61) | < 10-6 |
| 60 | III | 1.61 (1.40-1.85) | < 10-6 | 1.50 (1.33-1.70) | < 10-6 | 1.79 (1.53-2.09) | < 10-6 | 1.46 (1.30-1.64) | < 10-6 |
| 70 | III | 1.20 (1.01-1.42) | 0.0399 | 1.23 (1.03-1.47) | 0.0246 | 1.07 (0.88-1.30) | N.S. | 1.34 (1.14-1.57) | 0.0004 |
| 80 | III | 1.34 (1.12-1.60) | 0.0012 | 1.14 (0.93-1.38) | N.S. | 1.40 (1.14-1.72) | 0.0016 | 1.13 (0.96-1.34) | N.S. |
*Not Significant.
Hazard ratio for death from all causes in African Americans vs. Caucasians after initial surgical diagnosis of breast cancer stratified by four variables: age, (10 yr. increments), stage, marital status (single, married or separated) and ER status, or age, stage, marital status (single, married or separated) and PR status.
| Age | Stage | Hazard Ratio (Confidence Intervals) | p (Pearson Chi Square) | Hazard Ratio (Confidence Intervals) | p (Pearson Chi Square) | Hazard Ratio (Confidence Intervals) | p (Pearson Chi Square) | Hazard Ratio (Confidence Intervals) | p (Pearson Chi Square) |
|---|---|---|---|---|---|---|---|---|---|
| ER+ | ER- | PR+ | PR- | ||||||
| Single | |||||||||
| 40 | I | 2.45 (1.74-3.46) | < 10-6 | 1.28 (0.83-1.96) | N.S. | 2.24 (1.55-3.23) | 1.9 x 10⁻⁵ | 1.51 (1.01-2.24) | 0.0420 |
| 50 | I | 2.40 (1.80-3.20) | < 10-6 | 1.62 (1.11-2.35) | 0.0116 | 2.52 (1.85-3.44) | < 10-6 | 1.69 (1.21-2.37) | 0.0023 |
| 60 | I | 1.68 (1.28-2.21) | 0.0002 | 1.69 (1.18-2.43) | 0.0042 | 1.91 (1.44-2.54) | 8.5 x 10⁻⁶ | 1.67 (1.20-2.31) | 0.0021 |
| 70 | I | 1.33 (1.00-1.76) | 0.0480 | 1.31 (0.76-2.26) | N.S. | 1.36 (1.00-1.86) | N.S. | 1.24 (0.81-1.88) | N.S. |
| 80 | I | 0.87 (0.66-1.16) | N.S.* | 1.54 (0.86-2.74) | N.S. | 0.92 (0.67-1.26) | N.S. | 1.11 (0.72-1.71) | N.S. |
| 40 | II | 1.55 (1.24-1.93) | 0.0001 | 1.59 (1.29-1.97) | 1.4 x 10⁻⁵ | 1.56 (1.22-1.98) | 0.0003 | 1.52 (1.25-1.85) | 3.2 x 10⁻⁵ |
| 50 | II | 1.88 (1.51-2.34) | < 10-6 | 1.16 (0.93-1.45) | N.S. | 1.83 (1.45-2.30) | < 10-6 | 1.36 (1.10-1.68) | 0.0040 |
| 60 | II | 1.48 (1.19-1.84) | 0.0005 | 1.54 (1.21-1.96) | 0.0004 | 1.74 (1.37-2.20) | 3.9 x 10⁻⁶ | 1.48 (1.19-1.84) | 0.0004 |
| 70 | II | 1.40 (1.04-1.89) | 0.0281 | 1.31 (0.87-1.98) | N.S. | 1.37 (0.97-1.92) | N.S. | 1.42 (1.01-2.01) | 0.0464 |
| 80 | II | 1.26 (0.98-1.62) | N.S. | 1.26 (0.80-1.99) | N.S. | 1.22 (0.92-1.61) | N.S. | 1.39 (0.98-1.97) | N.S. |
| 40 | III | 1.52 (1.22-1.89) | 0.0002 | 1.28 (1.03-1.58) | 0.0236 | 1.60 (1.27-2.01) | 7.0 x 10⁻⁵ | 1.25 (1.02-1.53) | 0.0301 |
| 50 | III | 1.62 (1.30-2.00) | 1.1 x 10⁻⁵ | 1.41 (1.13-1.75) | 0.0020 | 1.82 (1.43-2.32) | 1.3 x 10⁻⁶ | 1.33 (1.09-1.62) | 0.0041 |
| 60 | III | 1.66 (1.32-2.09) | 1.8 x 10⁻⁵ | 1.55 (1.21-1.98) | 0.0005 | 1.91 (1.48-2.47) | < 10-6 | 1.50 (1.20-1.87) | 0.0003 |
| 70 | III | 1.44 (1.04-2.00) | 0.0296 | 1.32 (0.85-2.05) | N.S. | 1.56 (1.08-2.26) | 0.0177 | 1.22 (0.84-1.77) | N.S. |
| 80 | III | 0.91 (0.61-1.37) | N.S. | 1.54 (0.93-2.56) | N.S. | 0.94 (0.59-1.51) | N.S. | 1.29 (0.85-1.96) | N.S. |
| Married | |||||||||
| 40 | I | 1.83 (1.33-2.53) | 0.0002 | 1.61 (1.17-2.21) | 0.0034 | 1.63 (1.15-2.32) | 0.0061 | 1.74 (1.29-2.34) | 0.0003 |
| 50 | I | 2.65 (2.12-3.30) | 0 | 1.34 (1.02-1.75) | 0.0379 | 2.39 (1.86-3.07) | < 10-6 | 1.68 (1.32-2.13) | 2.0 x 10⁻⁵ |
| 60 | I | 1.64 (1.37-1.96) | < 10-6 | 1.45 (1.15-1.82) | 0.0014 | 1.63 (1.34-1.99) | < 10-6 | 1.61 (1.31-1.97) | 3.8 x 10⁻⁶ |
| 70 | I | 1.17 (0.96-1.42) | N.S. | 1.28 (0.97-1.68) | N.S. | 1.18 (0.95-1.46) | N.S. | 1.27 (1.00-1.60) | 0.0475 |
| 80 | I | 1.07 (0.86-1.32) | N.S. | 1.00 (0.67-1.50) | N.S. | 1.01 (0.80-1.27) | N.S. | 1.19 (0.87-1.63) | N.S. |
| 40 | II | 1.97 (1.65-2.35) | < 10-6 | 1.29 (1.09-1.54) | 0.0037 | 1.99 (1.66-2.39) | < 10-6 | 1.35 (1.14-1.60) | 0.0005 |
| 50 | II | 1.89 (1.59-2.24) | < 10-6 | 1.42 (1.22-1.66) | 7.0 x 10⁻⁶ | 2.04 (1.70-2.45) | < 10-6 | 1.43 (1.23-1.65) | 1.7 x 10⁻⁶ |
| 60 | II | 1.68 (1.44-1.97) | < 10-6 | 1.28 (1.08-1.51) | 0.0039 | 1.66 (1.40-1.97) | < 10-6 | 1.41 (1.21-1.64) | 9.2 x 10⁻⁶ |
| 70 | II | 1.43 (1.20-1.71) | 9.4 x 10⁻⁵ | 1.44 (1.16-1.80) | 0.0012 | 1.29 (1.05-1.58) | 0.0133 | 1.66 (1.37-2.01) | < 10-6 |
| 80 | II | 1.35 (1.11-1.63) | 0.0024 | 1.13 (0.85-1.51) | N.S. | 1.35 (1.10-1.66) | 0.0042 | 1.25 (0.97-1.60) | N.S. |
| 40 | III | 1.79 (1.49-2.14) | < 10-6 | 1.36 (1.14-1.62) | 0.0008 | 1.56 (1.28-1.91) | 1.1 x 10⁻⁵ | 1.58 (1.34-1.86) | < 10-6 |
| 50 | III | 1.66 (1.39-1.98) | < 10-6 | 1.46 (1.24-1.72) | 5.1 x 10⁻⁶ | 1.64 (1.36-1.99) | < 10-6 | 1.55 (1.33-1.81) | < 10-6 |
| 60 | III | 1.72 (1.45-2.05) | < 10-6 | 1.40 (1.17-1.68) | 0.0003 | 1.86 (1.54-2.25) | < 10-6 | 1.43 (1.22-1.69) | 1.9 x 10⁻⁵ |
| 70 | III | 1.25 (0.96-1.61) | N.S. | 1.15 (0.86-1.53) | N.S. | 1.17 (0.88-1.56) | N.S. | 1.34 (1.03-1.74) | 0.0291 |
| 80 | III | 1.43 (1.08-1.90) | 0.0125 | 1.31 (0.88-1.96) | N.S. | 1.39 (0.99-1.95) | N.S. | 1.33 (0.97-1.82) | N.S. |
*Not Significant.
Hazard ratios reached statistical differences in 6 of 10 and 7 of 10 stage I and II groupings with Grade 1 tumors in the ER+ and PR+ categories, respectively (Table 6 and Figure 2). There were too few elements in stage III groupings to analyze (Table S8 and Figure 2). ER- and PR- patients in the Grade 1 category were too few to support analysis, except in two of the PR- stage I groups. Most of the Grade 3 tumor categories had hazard ratios that were statistically significant. Thirteen of 15 each of ER+ and ER- categories were statistically significant and 11 of 15 PR+ and 14 of 15 PR- categories were significant. The few categories that did not reach statistical significance were all in the 70 and 80 year old groups. Grade 2 hormone receptor positive categories were also mostly significant, with 14 of 15 ER+ and 13 of 15 PR+ categories being significant. Only some of the 80 year age groupings failed to reach significance. Grade 2 ER- and PR- patient categories had fewer elements per category overall (Table S8) and data were more variable in the categories that did have sufficient n values.
We investigated whether differences in the hazard ratios for survival were significantly different in African American and Caucasian women by marital status. Single women had many categories in the 70 and 80 age groupings with very few values (Table S9a and Figure 2). In the Single categories with more than 100 African Americans, most of the differences were statistically significant in patients with both ER+ and ER- tumors and PR+ and PR- tumors (Table 7a and Figure 2). Married groupings had the most patients with only seven categories having less than 100 African American patients, all in the 70 and 80 year age groups (Table S9a and Figure 2). Of the remaining 53 categories, 44 had significant differences in the hazard ratios (Table 7a and Figure 2). All of the hazard ratios in the 40-60 year age groupings were statistically significant. There were relatively few patients in the Divorced subdivisions and 19 of the 60 categories had fewer than 100 African American Patients (Table S9b and Figure 2). Of the rest, most of the ER+ and PR+ hazard ratios in the 40-60 year category were significant but none in the ER+ and very few in the PR+ categories were significant (Table 7b and Figure 2). In the Widowed subdivision, none of the groupings in the 40-50 year age groupings had 100 or more African American Patients (Table S9b and Figure 2). In the remaining grouping, all but two 80 year old groupings were positive in both the ER+ and PR+ categories (Table 7b and Figure 2). In the hormone negative groupings, 4 of 7 and 5 of 9 groups with over 100 African American patients were significant in the ER- and PR- categories, respectively. Throughout the marital status subdivisions, significant differences were found in categories in which African Americans were both more frequently and less frequently represented than the general population (Table S9a and Table S9b and Figure 2). The data demonstrate that African American race is an independent predictor variable for surviving from localized breast cancer, independent of 6 associated co-variables with prognostic significance, in most circumstances. Of note, significant differences in the hazard ratios for survival were found in categories that have highly aggressive tumors, such as hormone negative grade 3 cancers and the least aggressive classifications of hormone positive, grade 1 cancers. The data point to additional factors, likely both genomic as well as social that contribute to differences in survival. To discern these factors, patients enrolled in clinical trials, stratified by predictor variable-directed eligibility criteria will need to have tumor tissue collected and made available to the broad scientific community for genomic sequencing and molecular studies to determine the root causes of the differences in survival.
Hazard ratio for death from all causes in African Americans vs. Caucasians after initial surgical diagnosis of breast cancer stratified by four variables: age, (10 yr. increments), stage, marital status (divorced or widowed) and ER status, or age, stage, marital status (divorced or widowed) and PR status.
| Age | Stage | Hazard Ratio (Confidence Intervals) | p (Pearson Chi Square) | Hazard Ratio (Confidence Intervals) | p (Pearson Chi Square) | Hazard Ratio (Confidence Intervals) | p (Pearson Chi Square) | Hazard Ratio (Confidence Intervals) | p (Pearson Chi Square) |
|---|---|---|---|---|---|---|---|---|---|
| ER+ | ER- | PR+ | PR- | ||||||
| Divorced | |||||||||
| 40 | I | 1.83 (1.03-3.24) | 0.0393 | 1.63 (0.83-3.22) | N.S. | 2.00 (1.12-3.55) | 0.0183 | 1.52 (0.78-2.98) | N.S. |
| 50 | I | 1.76 (1.20-2.58) | 0.0036 | 1.44 (0.98-2.13) | N.S. | 1.68 (1.12-2.50) | 0.0115 | 1.71 (1.18-2.47) | 0.0044 |
| 60 | I | 1.30 (0.99-1.72) | N.S.* | 1.19 (0.85-1.67) | N.S. | 1.47 (1.10-1.98) | 0.0096 | 1.12 (0.83-1.52) | N.S. |
| 70 | I | 0.96 (0.71-1.31) | N.S. | 1.50 (0.94-2.39) | N.S. | 0.92 (0.64-1.30) | N.S. | 1.38 (0.95-2.01) | N.S. |
| 80 | I | 0.95 (0.68-1.34) | N.S. | 1.84 (0.99-3.40) | N.S. | 0.94 (0.64-1.38) | N.S. | 1.49 (0.93-2.40) | N.S. |
| 40 | II | 1.08 (0.67-1.75) | N.S. | 1.24 (0.91-1.68) | N.S. | 1.22 (0.75-1.96) | N.S. | 1.15 (0.85-1.56) | N.S. |
| 50 | II | 1.53 (1.18-1.97) | 0.0013 | 1.11 (0.86-1.42) | N.S. | 1.53 (1.16-2.01) | 0.0027 | 1.19 (0.94-1.51) | N.S. |
| 60 | II | 1.54 (1.23-1.93) | 0.0001 | 1.12 (0.87-1.43) | N.S. | 1.52 (1.17-1.96) | 0.0014 | 1.25 (1.01-1.56) | 0.0438 |
| 70 | II | 1.28 (0.98-1.66) | N.S. | 0.86 (0.59-1.26) | N.S. | 1.30 (0.97-1.75) | N.S. | 0.97 (0.71-1.33) | N.S. |
| 80 | II | 1.04 (0.75-1.43) | N.S. | 1.0 (0.57-1.76) | N.S. | 1.11 (0.78-1.58) | N.S. | 0.92 (0.58-1.45) | N.S. |
| 40 | III | 1.70 (1.21-2.41) | 0.0025 | 1.31 (0.93-1.84) | N.S. | 1.75 (1.22-2.50) | 0.0023 | 1.28 (0.92-1.79) | N.S. |
| 50 | III | 1.68 (1.27-2.23) | 0.0003 | 1.17 (0.90-1.51) | N.S. | 1.72 (1.26-2.35) | 0.0006 | 1.27 (0.99-1.62) | N.S. |
| 60 | III | 1.57 (1.22-2.02) | 0.0004 | 1.51 (1.17-1.95) | N.S. | 1.66 (1.25-2.21) | 0.0005 | 1.49 (1.18-1.87) | 0.0007 |
| 70 | III | 1.00 (0.70-1.44) | N.S. | 1.50 (0.99-2.30) | N.S. | 0.97 (0.64-1.49) | N.S. | 1.39 (0.97-2.00) | N.S. |
| 80 | III | 1.21 (0.80-1.84) | N.S. | 0.75 (0.42-1.37) | N.S. | 1.13 (0.69-1.83) | N.S. | 0.92 (0.57-1.50) | N.S. |
| Widowed | |||||||||
| 40 | I | 5.68 (1.15-28.2) | 0.0335 | 2.38 (0.40-14.2) | N.S. | 4.30 (0.72-25.7) | N.S. | 2.86 (0.58-14.2) | N.S. |
| 50 | I | 1.54 (0.82-2.89) | N.S. | 1.55 (0.67-3.60) | N.S. | 1.66 (0.81-3.39) | N.S. | 1.30 (0.64-2.65) | N.S. |
| 60 | I | 1.54 (1.19-2.01) | 0.0012 | 1.12 (0.73-1.70) | N.S. | 1.55 (1.17-2.06) | 0.0025 | 1.24 (0.87-1.77) | N.S. |
| 70 | I | 1.26 (1.07-1.49) | 0.0061 | 1.34 (1.02-1.77) | 0.0362 | 1.28 (1.07-1.53) | 0.0071 | 1.31 (1.04-1.66) | 0.0221 |
| 80 | I | 1.09 (0.96-1.24) | N.S. | 1.02 (0.79-1.32) | N.S. | 1.05 (0.91-1.21) | N.S. | 1.15 (0.95-1.39) | N.S. |
| 40 | II | 1.85 (0.62-5.52) | N.S. | 0.90 (0.32-2.51) | N.S. | 1.17 (0.35-3.98) | N.S. | 1.53 (0.57-4.11) | N.S. |
| 50 | II | 2.40 (1.50-3.84) | 0.0003 | 1.84 (1.12-3.04) | 0.0167 | 2.95 (1.81-4.82) | 1.6 x 10⁻⁵ | 1.64 (1.02-2.63) | 0.0404 |
| 60 | II | 1.34 (1.04-1.71) | 0.0228 | 1.33 (1.01-1.75) | 0.0445 | 1.37 (1.04-1.80) | 0.0238 | 1.35 (1.05-1.73) | 0,0180 |
| 70 | II | 1.33 (1.13-1.57) | 0.0007 | 1.36 (1.09-1.70) | 0.0067 | 1.31 (1.09-1.57) | 0.0039 | 1.41 (1.16-1.71) | 0.0005 |
| 80 | II | 1.12 (0.99-1.27) | N.S. | 1.23 (1.01-1.50) | 0.0366 | 1.08 (0.94-1.24) | N.S. | 1.29 (1.10-1.51) | 0.0014 |
| 40 | III | 0.98 (0.36-2.64) | N.S. | 0.82 (0.35-1.90) | N.S. | 1.21 (0.45-3.28) | N.S. | 0.81 (0.35-1.87) | N.S. |
| 50 | III | 2.40 (1.51-3.83) | 0.0002 | 0.91 (0.53-1.57) | N.S. | 2.09 (1.23-3.55) | 0.0064 | 1.09 (0.68-1.75) | N.S. |
| 60 | III | 1.92 (1.48-2.51) | 1.3 x 10⁻⁶ | 1.23 (0.88-1.72) | N.S. | 2.18 (1.61-2.96) | < 10-6 | 1.26 (0.94-1.67) | N.S. |
| 70 | III | 1.24 (1.01-1.51) | 0.0360 | 1.25 (0.95-1.66) | N.S. | 1.26 (1.01-1.58) | 0.0403 | 1.20 (0.95-1.53) | N.S. |
| 80 | III | 1.50 (1.27-1.78) | 2.1 x 10⁻⁶ | 1.16 (0.92-1.45) | N.S. | 1.51 (1.24-1.84) | 3.9 x 10⁻⁵ | 1.23 (1.02-1.48) | 0.0286 |
*Not Significant.
Discussion
This study demonstrates, for the first time, that African American race is an independent predictor variable for survival compared to Caucasian race in women with a diagnosis of localized breast cancer when controlled for 6 associated co-variables with prognostic significance. Significant differences in hazard ratios for survival were present in every age decile from 40 to 80+ years, every stage, every tumor grade, ER+ and ER- tumors, PR+ and PR- tumors, in single, married, divorced and widowed categories and in right and left sided breast tumors. The study is also the first to demonstrate definitively in a large cohort that categories of age, stage, grade, ER, PR and marital status that significantly co-varied with race, co-varied among themselves. We also confirmed that correlations between ER and PR status and marital status were not statistically significant in women 65 years and older (data not shown), as previously reported [20], but they were highly significant when the entire population was considered (Table 3 and Table S5).
To eliminate the confounding effects of age stage and ER or PR status, data were initially subdivided into these three variables for analysis. Significant hazard ratio differences were found in 93% of cells with these 3 variable subdivisions with both ER+ and PR+ and ER- and PR- tumors (Figure 2, three variables, Table 5). All of the cells in which differences were not statistically significant were in the 80 year age groupings, suggesting that advanced age may diminish the impact of racial differences on hazard ratios for survival. When stratifying the two populations by age, the eldest categories of the patients had the smallest, albeit statistically significant, differences in the hazard ratios for survival (Table 4 and Figure 1).
To eliminate the additional confounding effects of grade and marital status, the data were further subdivided into cells specific for grade and marital status (Figure 2, four variables, Table 6 and Tables 7a and 7b). As a consequence of these stratifications, there were some subdivisions with very few elements (Tables S8 and S9a and S9b, Table 2). Specifically, many of the cells in ER- and PR- grade 1 tumor and stage III ER+ and PR+ grade 1 tumor subdivisions, elderly patients in the single, married or divorced status subdivisions, and widowed status in the 40 and 50 year old classifications had very few elements. There were a few others sporadically distributed with few elements as well. We did not include these subdivisions in our conclusions when they contained an arbitrary cutoff of less than 100 African American patients. When the sparsely populated groupings were removed from the analysis, the data demonstrated that the hazard ratio for survival was statistically significant between African Americans and Caucasians in most categories, regardless of age, stage, grade, ER or PR status or marital status, or whether African Americans were more frequently or less frequently represented in the category than in the undissected data set. Some conspicuous exceptions included the oldest patients with grade 3 tumors, and some categories with ER- and PR- tumors, where the defining variable may itself have posed significant enough of a risk for shorter survival, where the genomic or social factors attributable to race did not further enhance the predictor variable.
Once age, stage, grade, ER and PR status and marital status are excluded from cited reasons for survival differences between African American and Caucasian women, what remain are treatment differences [2, 4, 66] due to a variety of social obstacles, and biological differences [3]. Attributions to social differences include comorbidities [3, 66], socioeconomic factors, including access to care [67, 68], treatment differences [43], psychological attitudes and health literacy affecting acceptance and compliance with therapy [66]. Attributions to biologic differences stem from observations of only modest cancer-specific survival differences between African American and Caucasian patients treated comparably for similar-stage cancer [3], differences in tumor biology not captured by hormone status and grade [69] and differences in disease response [70]. African American patients matched with Caucasian cohorts and controlled for decreased delivery of treatment in clinical trials had lower survival rates than Caucasians in some studies [50-52], but not all accounts [71]. This suggests, there are other biologic factors in some subset of patients not explained by currently understood molecular differences. The current study strongly supports a proposition that molecular definition of tumor differences will have to be done between matched cohorts lacking confounding variables. It will direct the obligate specificity of follow up investigations necessary to determine whether social or genomic tumor differences, or both, contribute to decreased survival in African Americans with localized breast cancer in specific categories of disease, age or marital grouping.
Supplementary Material
Supplementary tables.
Acknowledgements
Support: 3U10CA128506 and Rutgers I-DSLA and Rutgers University-Newark Chancellor's Seed Fund.
Ethical Standards
Experiments comply with the current laws of the country in which they were performed.
Competing Interests
The authors declare that they have no competing interests.
References
1. DeSantis C, Ma J, Bryan L. et al. Breast cancer statistics, 2013. CA: A Cancer Journal for Clinicians. 2014;64:52-62
2. Wheeler SB, Reeder-Hayes KE, Carey LA. Disparities in breast cancer treatment and outcomes: biological, social, and health system determinants and opportunities for research. Oncologist. 2013;18:986-93
3. Bach PB, Schrag D, Brawley OW. et al. Survival of blacks and whites after a cancer diagnosis. JAMA. 2002;287:2106-13
4. Silber JH, Rosenbaum PR, Clark AS. et al. Characteristics associated with differences in survival among black and white women with breast cancer. JAMA. 2013;310:389-97
5. Adami HO, Malker B, Holmberg L. et al. The relation between survival and age at diagnosis in breast cancer. New Eng J Med. 1986;315:559-63
6. de la Rochefordiere A, Asselain B, Campana F. et al. Age as prognostic factor in premenopausal breast carcinoma. Lancet. 1993;341:1039-43
7. Albain KS, Allred DC, Clark GM. Breast cancer outcome and predictors of outcome: are there age differentials? J Natl Cancer Inst Mongr. 1994;16:35-42
8. Nixon AJ, Neuberg D, Hayes DF. et al. Relationship of patient age to pathologic features of the tumor and prognosis for patients with stage I or II breast cancer. J Clin Oncol. 1994;12:888-94
9. Chung M, Chang HR, Bland KI. et al. Younger women with breast carcinoma have a poorer prognosis than older women. Cancer. 1996;77:97-103
10. Dubsky PC, Gnant MF, Taucher S. et al. Young age as an independent adverse prognostic factor in premenopausal patients with breast cancer. Clin Breast Cancer. 2002;3:65-72
11. Han W, Kim SW, Park IA. et al. Young age: an independent risk factor for disease-free survival in women with operable breast cancer. BMC Cancer. 2004;4:82
12. Aebi S, Castiglione M. The enigma of young age. Ann Oncol. 2006;17:1475-77
13. Liu P, Li X, Mittendorf EA. et al. Comparison of clinicopathologic features and survival in young American women aged 18-39 years in different ethnic groups with breast cancer. British J of Cancer. 2013;109:1302-1309
14. Henson DE, Ries L, Freedman L. et al. Relationship among outcome, stage of disease, and histologic grade for 22,616 cases of breast cancer. Cancer. 1991;68:2142-49
15. Schwartz AM, Henson DE, Chen D. et al. Histologic grade remains a prognostic factor for breast cancer regardless of the number of positive lymph nodes and tumor size: a study of 161708 cases of breast cancer from the SEER Program. Archives of Pathology & Laboratory Medicine. 2014;138:1048-52
16. Fisher B, Redmond C, Fisher ER. et al. Relative worth of estrogen and progesterone receptor and pathologic characteristics of differentiation as indicators of prognosis in node-negative breast cancer patients: findings from National Surgical Adjuvant Breast and Bowel Protocol B-06. J Clin Oncol. 1988;6:1076-87
17. Alexieva-Figusch J, van Putten WL, Blankenstein MA. et al. The prognostic value and relationships of patient characteristics, estrogen and progestin receptors, and site of relapse in primary breast cancer. Cancer. 1988;61:758-68
18. Clark GM, McGuire WL. Steroid receptors and other prognostic factors in primary breast cancer. Semin Oncol. 1988;15(2suppl1):20-25
19. Molino A, Turazza M, Bonetti A. et al. Estrogen and progesterone receptors in breast cancer: correlation with clinical and pathological features and with prognosis. Oncology. 1992;49:82-88
20. Osborne C, Ostir GV, Du X. et al. The influence of marital status on the stage at diagnosis, treatment, and survival of older women with breast cancer. Breast Cancer Research & Treatment. 2005;93:41-47
21. Woods SE, Luking R, Atkins B. et al. Association of race and breast cancer stage. J National Medical Association. 2006;98:683-86
22. Iqbal J, Ginsburg O, Rochon PA. et al. Differences in breast cancer stage at diagnosis and cancer-specific survival by race and ethnicity in the United States. JAMA. 2015;313:165-73
23. Henson DE, Chu KC, Levine PH. Histologic grade, stage, and survival in breast carcinoma: comparison of African American and Caucasian women. Cancer. 2003;98:908-17
24. Setiawan VW, Monroe KR, Wilkens LR. et al. Breast cancer risk factors defined by estrogen and progesterone receptor status: the multiethnic cohort study. American Journal of Epidemiology. 2009;169:1251-9
25. Stark A, Kleer CG, Martin I. et al. African ancestry and higher prevalence of triple-negative breast cancer: findings from an international study. Cancer. 2010;116:4926-32
26. Daly B, Olopade OI. A perfect storm: How tumor biology, genomics, and health care delivery patterns collide to create a racial survival disparity in breast cancer and proposed interventions for change. CA: a Cancer Journal for Clinicians. 2015;65:221-38
27. Carey LA, Perou CM, Livasy CA. et al. Race, breast cancer subtypes, and survival in the Carolina Breast Cancer Study. JAMA. 2006;295:2492-502
28. Menashe I, Anderson WF, Jatoi I. et al. Underlying causes of the black-white racial disparity in breast cancer mortality: a population-based analysis. Journal of the National Cancer Institute. 2009;101:993-1000
29. Adams SA, Butler WM, Fulton J. et al. Racial disparities in breast cancer mortality in a multiethnic cohort in the Southeast. Cancer. 2012;118:2693-9
30. Sparano JA, Wang M, Zhao F. et al. Race and hormone receptor-positive breast cancer outcomes in a randomized chemotherapy trial. Journal of the National Cancer Institute. 2012;104:406-14
31. Chu KC, Lamar CA, Freeman HP. Racial disparities in breast carcinoma survival rates: separating factors that affect diagnosis from factors that affect treatment. Cancer. 2003;97:2853-60
32. Gerend MA, Pai M. Social determinants of Black-White disparities in breast cancer mortality: a review. Cancer Epidemiology, Biomarkers & Prevention. 2008;17:2913-23
33. Tammemagi CM, Nerenz D, Neslund-Dudas C. et al. Comorbidity and survival disparities among black and white patients with breast cancer. JAMA. 2005;294:1765-72
34. McKenzie F, Jeffreys M. Do lifestyle or social factors explain ethnic/racial inequalities in breast cancer survival? Epidemiologic Reviews. 2009;31:52-66
35. Fedewa SA, Ward EM, Stewart AK. et al. Delays in adjuvant chemotherapy treatment among patients with breast cancer are more likely in African American and Hispanic populations: a national cohort study 2004-2006. Journal of Clinical Oncology. 2010;28:4135-41
36. Gwyn K, Bondy ML, Cohen DS. et al. Racial differences in diagnosis, treatment, and clinical delays in a population-based study of patients with newly diagnosed breast carcinoma. Cancer. 2004;100:1595-604
37. Vandergrift JL, Niland JC, Theriault RL. et al. Time to adjuvant chemotherapy for breast cancer in National Comprehensive Cancer Network institutions. Journal of the National Cancer Institute. 2013;105:104-12
38. Balasubramanian BA, Demissie K, Crabtree BF. et al. Black Medicaid beneficiaries experience breast cancer treatment delays more frequently than whites. Ethnicity & Disease. 2012;22:288-94
39. Smith K, Wray L, Klein-Cabral M. et al. Ethnic disparities in adjuvant chemotherapy for breast cancer are not caused by excess toxicity in black patients. Clinical Breast Cancer. 2005;6:260-6 discussion 267-9
40. Bickell NA, Wang JJ, Oluwole S. et al. Missed opportunities: racial disparities in adjuvant breast cancer treatment. Journal of Clinical Oncology. 2006;24:1357-62
41. Bickell NA, LePar F, Wang JJ. et al. Lost opportunities: physicians' reasons and disparities in breast cancer treatment. Journal of Clinical Oncology. 2007;25:2516-21
42. Griggs JJ, Culakova E, Sorbero ME. et al. Social and racial differences in selection of breast cancer adjuvant chemotherapy regimens. Journal of Clinical Oncology. 2007;25:2522-7
43. Freedman RA, He Y, Winer EP. et al. Trends in racial and age disparities in definitive local therapy of early-stage breast cancer. J Clin Oncol. 2009;27:713-19
44. Lipscomb J, Gillespie TW, Goodman M. et al. Black-white differences in receipt and completion of adjuvant chemotherapy among breast cancer patients in a rural region of the US. Breast Cancer Research & Treatment. 2012;133:285-96
45. Reeder-Hayes KE, Meyer AM, Dusetzina SB. et al. Racial disparities in initiation of adjuvant endocrine therapy of early breast cancer. Breast Cancer Research & Treatment. 2014;145:743-51
46. Partridge AH, Wang PS, Winer EP. et al. Nonadherence to adjuvant tamoxifen therapy in women with primary breast cancer. Journal of Clinical Oncology. 2003;21:602-6
47. Simon MS, Du W, Flaherty L. et al. Factors associated with breast cancer clinical trials participation and enrollment at a large academic medical center. Journal of Clinical Oncology. 2004;22:2046-52
48. Gross CP, Filardo G, Mayne ST. et al. The impact of socioeconomic status and race on trial participation for older women with breast cancer. Cancer. 2005;103:483-91
49. Nurgalieva ZZ, Franzini L, Morgan RO. et al. Impact of timing of adjuvant chemotherapy initiation and completion after surgery on racial disparities in survival among women with breast cancer. Medical Oncology. 2013;30:419
50. Hershman DL, Unger JM, Barlow WE. et al. Treatment quality and outcomes of African American versus white breast cancer patients: retrospective analysis of Southwest Oncology studies S8814/S8897. Journal of Clinical Oncology. 2009;27:2157-62
51. Hassett MJ, Griggs JJ. Disparities in breast cancer adjuvant chemotherapy: moving beyond yes or no. Journal of Clinical Oncology. 2009;27:2120-1
52. Albain KS, Unger JM, Crowley JJ. et al. Racial disparities in cancer survival among randomized clinical trials patients of the Southwest Oncology Group. Journal of the National Cancer Institute. 2009;101:984-92
53. Stewart PA, Luks J, Roycik MD. et al. Differentially expressed transcripts and dysregulated signaling pathways and networks in African American breast cancer. PLoS ONE [Electronic Resource]. 2013;8(12):e82460
54. Nanda R, Schumm LP, Cummings S. et al. Genetic testing in an ethnically diverse cohort of high-risk women: a comparative analysis of BRCA1 and BRCA2 mutations in American families of European and African ancestry. JAMA. 2005;294:1925-33
55. Elledge RM, Clark GM, Chamness GC. et al. Tumor biologic factors and breast cancer prognosis among white, Hispanic, and black women in the United States. Journal of the National Cancer Institute. 1994;86:705-12
56. Shiao YH, Chen VW, Scheer WD. et al. Racial disparity in the association of p53 gene alterations with breast cancer survival. Cancer Research. 1995;55:1485-90
57. Barcellos-Hoff MH. Does microenvironment contribute to the etiology of estrogen receptor-negative breast cancer? Clinical Cancer Research. 2013;19:541-8
58. Martin DN, Boersma BJ, Yi M. et al. Differences in the tumor microenvironment between African-American and European-American breast cancer patients. PLoS ONE [Electronic Resource]. 2009;4(2):e4531
59. Chen ST, Lai HW, Tseng HS. et al. Correlation of histologic grade with other clinicopathological parameters, intrinsic subtype, and patients' clinical outcome in Taiwanese women. Japanese Journal of Clinical Oncology. 2011;41:1327-35
60. Caldarella A, Buzzoni C, Crocetti E. et al. Invasive breast cancer: a significant correlation between histological types and molecular subgroups. Journal of Cancer Research & Clinical Oncology. 2013;139:617-23
61. Callagy G, Cattaneo E, Daigo Y. et al. Molecular classification of breast carcinomas using tissue microarrays. Diagnostic Molecular Pathology. 2003;12:27-34
62. Lacroix M, Toillon RA, Leclercq G. Stable 'portrait' of breast tumors during progression: data from biology, pathology and genetics. Endocrine-Related Cancer. 2004;11:497-22
63. Weiss HA, Devesa SS, Brinton LA. Laterality of breast cancer in the United States. Cancer Causes & Conctrol. 1996;7:539-43
64. Surveillance Epidemiology, End Results Program (SEER). http://seer.cancer.gov/. Accessed May 2. 2014
65. Bland JM, Altman DG. Survival probabilities (the Kaplan-Meier method). BMJ. 1998;317:1572-80
66. Yasmeen S, Chlebowski RT, Xing G. et al. Severity of comorbid conditions and early-stage breast cancer therapy: linked SEER-Medicare data from 1993 to 2005. Cancer Medicine. 2013;2:526-36
67. Gerend MA, Pai M. Social determinants of black-white disparities in breast cancer mortality: A review. Cancer Epidemiol Biomarkers Prev. 2008;17:2913-23
68. Maloney N, Koch M, Erb D. et al. Impact of race on breast cancer in lower socioeconomic status women. Breast J. 2006;12:58-62
69. Bowen RL, Stebbing J, Jones LJ. A review of the ethnic differences in breast cancer. Pharmacogenomics. 2006;7:935-42
70. Caudle AS, Gonzalez-Angulo AM, Hunt KK. et al. Predictors of tumor progression during neoadjuvant chemotherapy in breast cancer. J Clin Oncol. 2010;28:1821-28
71. Cross CK; Harris J; Recht A. Race, socioeconomic status, and breast carcinoma in the U.S: what have we learned from clinical studies. Cancer. 2002;95:1988-99
Author contact
![]() Corresponding author: Robert Wieder, MD, PhD. Rutgers New Jersey Medical School, 205 South Orange Avenue, Cancer Center H1216, Newark, NJ 07103. Tel. 973-972-4871 Fax. 973-972-2668 e-mail. wiederrorutgers.edu.
Corresponding author: Robert Wieder, MD, PhD. Rutgers New Jersey Medical School, 205 South Orange Avenue, Cancer Center H1216, Newark, NJ 07103. Tel. 973-972-4871 Fax. 973-972-2668 e-mail. wiederrorutgers.edu.