Impact Factor ISSN: 1837-9664

 Global reach, higher impact
J Cancer 2016; 7(8):965-972. doi:10.7150/jca.15073 This issue Cite
Research Paper
Association between Perioperative Blood Transfusion and Oncologic Outcomes after Curative Surgery for Renal Cell Carcinoma
Yong Hyun Park1, Yong-June Kim2, Seok Ho Kang3, Hyeon Hoe Kim4, Seok-Soo Byun5, Ji Youl Lee1, Sung-Hoo Hong1 ![]()
1. Department of Urology, Seoul St. Mary's Hospital, The Catholic University, Seoul, Korea
2. Department of Urology, Chungbuk National University College of Medicine, Cheongju, Korea
3. Department of Urology, Korea University School of Medicine, Seoul, Korea
4. Department of Urology, Seoul National University College of Medicine, Seoul, Korea
5. Department of Urology, Seoul National University Bundang Hospital, Seongnam, Korea
Received 2016-1-24; Accepted 2016-3-21; Published 2016-5-12
Abstract
Purpose: We aimed to elucidate the association between perioperative blood transfusion (PBT) and the prognosis of patients undergoing curative surgery for renal cell carcinoma (RCC).
Methods: In all, 3,832 patients with RCC who had undergone curative surgery were included in this study from a multicenter database. PBT was defined as the transfusion of packed red blood cells within seven days before surgery, during surgery, or within the postoperative hospitalization period. The association of PBT with oncologic outcomes was evaluated using univariate and multivariate Cox regression analyses, and regression adjustment with propensity score matching.
Results: Overall, 11.7% (447/3,832) of patients received PBT. Patients receiving PBT were significantly older at diagnosis, and had lower BMI, higher comorbidities, worse ECOG performance status, and more initial symptoms. Moreover, higher pathologic TNM stage, larger mass size, higher nuclear grade, more sarcomatoid differentiation, and more tumor necrosis were all observed more frequently in patients who received PBT. In univariate analysis, relapse-free survival, cancer-specific survival, and overall survival rates were worse in patients who received PBT; however, these factors became insignificant in the matched pairs after propensity score matching. On multivariate Cox regression analysis and regression adjustment with propensity score matching, significant prognostic effects of PBT on disease relapse, cancer-specific mortality, and all-cause mortality were not observed.
Conclusions: This multicenter database analysis demonstrates no significant prognostic association between PBT and oncologic outcomes in patients with RCC.
Keywords: renal cell carcinoma, perioperative blood transfusion, prognosis
Introduction
Renal cell carcinoma (RCC) is considered an immunogenic tumor [1]. RCC exhibits prominent tumor-infiltrating immune cells consisting of cytotoxic T cells, helper T cells, and dendritic cells, among others [2]. Spontaneous regression of metastatic lesions after nephrectomy also supports its interactions with the host immune system [3]. Thus, several immunotherapeutic approaches including immunotherapy and vaccine therapy have been investigated to date.
The induced immunosuppressive effect of perioperative blood transfusion (PBT) was first described in 1974 in a report of prolonged survival of mismatched renal allografts in patients who had been transfused [4]. The immunosuppressive effect of PBT has led to concerns about its adverse effects on the postoperative outcomes of cancer patients [5]. Since the first study reported a higher recurrence rate in transfused patients after colon cancer surgery [6], numerous studies have addressed the effect of PBT on subsequent recurrence or survival in several solid tumors [7-11]. With regard to RCC, some studies have suggested that PBT was significantly associated with poor prognosis after radical or partial nephrectomy [12, 13], however, other studies failed to find such an association [14, 15]. This controversy might stem from the limitations of these studies, which used small sample sizes from single institutions with different policies for PBT.
In light of these controversial findings, we explored the association between PBT and the oncologic outcomes of patients undergoing curative surgery for RCC, controlling for known clinicopathologic predictors.
Materials and Methods
Data source and study population
We used clinical data derived from the KORCC (KOrean Renal Cell Carcinoma) database, a nationwide multicenter database in 7 hospitals in Korea. Included in the KORCC database were 4,055 patients who had undergone radical or partial nephrectomy for RCC in one of the participating hospitals. Clinical data were reviewed and collected in the form of a standardized electronic case report that included the following: (1) preoperative data, including age, gender, body mass index (BMI), previous medical history, Eastern Cooperative Oncology Group (ECOG) performance status, American Society of Anesthesiologists (ASA) status classification system, and symptoms at diagnosis; (2) preoperative laboratory findings; (3) surgical data, including the operative method, operative time, estimated blood loss, and PBT; (4) pathologic data, including TNM stage, histologic subtype, Fuhrman's nuclear grade, mass size, sarcomatoid differentiation, and necrosis; and (5) postoperative follow-up data, including disease relapse, death, and cause of death. PBT was defined as the transfusion of packed red blood cells within seven days before surgery, during surgery, or within the postoperative hospitalization period, and transfusion of other blood products, including fresh frozen plasma or platelets, were not included. TNM staging followed the 7th TNM classification of the Union for International Cancer Control (UICC) and the American Joint Committee on Cancer (AJCC) guidelines [16], and histological subtypes followed the UICC/AJCC and Heidelberg recommendations [17]. Vital status and cause of death was determined by reviewing the patient's medical records and/or by reviewing the Korea National Statistical Office database. After approval by the Institutional Review Boards of the Catholic University of Korea, Seoul St. Mary's Hospital, we performed a retrospective analysis of 3,832 patients with available information regarding PBT.
Statistical analysis
Differences between groups were evaluated using the Wilcoxon signed rank-sum test for continuous variables and the chi-square test for categorical variables. The association between variables and PBT was evaluated using logistic regression analysis. Oncologic outcomes measured included relapse-free survival, cancer-specific survival, and overall survival rates. Relapse-free survival and cancer-specific survival rates were calculated using the cumulative incidence method with consideration of a competing risk of non-RCC-related death. Overall survival was analyzed using the Kaplan-Meier method. Associations between PBT and oncologic outcomes were analyzed using a proportional hazards model for the subdistribution of a competing risk in disease relapse and cancer-specific mortality, and Cox proportional hazard regression models in all-cause mortality.
The estimated propensity score for PBT was obtained from the fit of a logistic regression model for which we considered 34 known clinically important variables, some of which are listed in Tables 1, 2, and 3. The logistic model used to estimate the propensity score yielded a c-statistic of 0.862. One-to-one matching was performed using the Greedy matching method, and the balance of the patients according to the PBT was evaluated using the standardized difference and significance testing (Wilcoxon signed rank-sum test and Cochran Mantel-Haenzel test for pair-matched data) after propensity score matching.
Baseline demographics of all patients and patients analyzed with propensity score matching
| Variables | All patients (n=3832) | Standardized difference (%) | p-value | PS-matched patients (n=732) | Standardized difference (%) | p-value | ||||
|---|---|---|---|---|---|---|---|---|---|---|
| Overall | No transfusion (n=3385) | Transfusion (n=447) | Overall | No transfusion (n=366) | Transfusion (n=366) | |||||
| Age (yr) | -22.9 | <0.0001 | -4.4 | 0.5027 | ||||||
| Mean (SD) | 55.5 (12.7) | 55.2 (12.7) | 58.1 (12.9) | 58.2 (12.8) | 58.5 (12.4) | 57.9 (13.2) | ||||
| Median (IQR) | 56.0 (47.0-65.0) | 55.0 (47.0-65.0) | 59.0 (49.0-68.0) | 59.0 (49.0-68.5) | 59.0 (50.0-68.0) | 59.0 (48.0-69.0) | ||||
| Gender (%) | 0.1334 | 0.6935 | ||||||||
| Male | 2747 (71.7) | 2440 (72.1) | 307 (68.7) | -7.5 | 495 (67.6) | 250 (68.3) | 245 (66.9) | -2.9 | ||
| Female | 1085 (28.3) | 945 (27.9) | 140 (31.3) | 7.5 | 237 (32.4) | 116 (31.7) | 121 (33.1) | 2.9 | ||
| BMI (%) | <0.0001 | 0.9697 | ||||||||
| < 18.5 | 96 (2.5) | 75 (2.2) | 21 (4.7) | 13.8 | 24 (3.3) | 11 (3.1) | 13 (3.6) | 3.0 | ||
| 18.5-22.9 | 1176 (30.8) | 992 (29.4) | 184 (41.5) | 25.5 | 279 (38.6) | 139 (38.5) | 140 (38.7) | 0.4 | ||
| 23.0-24.9 | 1038 (27.2) | 929 (27.6) | 109 (24.6) | -6.8 | 183 (25.3) | 90 (24.9) | 93 (25.7) | 1.8 | ||
| >25.0 | 1504 (39.4) | 1375 (40.8) | 129 (29.1) | -24.7 | 237 (32.8) | 121 (33.5) | 116 (32.0) | -3.2 | ||
| Comorbidity (%) | ||||||||||
| DM | 534 (14.0) | 440 (13.0) | 94 (21.1) | 21.6 | <0.0001 | 160 (21.9) | 86 (23.5) | 74 (20.3) | -7.8 | 0.2773 |
| Hypertension | 1441 (37.7) | 1248 (36.9) | 193 (43.3) | 12.9 | 0.0093 | 305 (21.9) | 151 (41.3) | 154 (42.2) | 1.9 | 0.8206 |
| CKD | 212 (5.6) | 161 (4.8) | 51 (11.5) | 24.6 | <0.0001 | 78 (10.7) | 39 (10.7) | 39 (10.7) | -0.1 | 0.9013 |
| Smoking (%) | 0.7700 | 0.5649 | ||||||||
| Non-smoker | 2175 (71.5) | 1965 (71.7) | 210 (29.8) | -4.2 | 352 (72.4) | 177 (73.4) | 175 (71.4) | -4.5 | ||
| Ex-smoker | 260 (8.6) | 232 (8.5) | 28 (9.3) | 3.0 | 34 (7.0) | 18 (7.5) | 16 (6.5) | -3.7 | ||
| Current smoker | 607 (20.0) | 544 (19.9) | 63 (20.9) | 2.7 | 100 (20.6) | 46 (19.1) | 54 (22.0) | 7.3 | ||
| ASA score (%) | <0.0001 | 0.9904 | ||||||||
| 1 | 1821 (48.7) | 1654 (49.8) | 167 (39.9) | -20.0 | 291 (42.4) | 146 (42.8) | 145 (42.0) | -1.6 | ||
| 2 | 1733 (46.3) | 1525 (45.9) | 208 (49.6) | 7.5 | 332 (48.4) | 163 (47.8) | 169 (49.0) | 2.4 | ||
| 3 | 182 (4.9) | 140 (4.2) | 42 (10.0) | 22.8 | 61 (8.9) | 31 (9.1) | 30 (8.7) | -1.4 | ||
| 4 | 6 (0.2) | 4 (0.1) | 2 (0.5) | 6.6 | 2 (0.3) | 1 (0.3) | 1 (0.3) | 0 | ||
| ECOG PS (%) | <0.0001 | 0.9468 | ||||||||
| 0 | 2000 (53.8) | 1826 (55.5) | 174 (40.3) | -30.9 | 301 (42.7) | 151 (42.8) | 150 (42.6) | -0.3 | ||
| 1 | 1100 (29.6) | 961 (29.2) | 139 (32.2) | 6.4 | 225 (31.9) | 113 (32.0) | 112 (31.8) | -0.4 | ||
| 2 | 546 (14.7) | 449 (13.7) | 97 (22.5) | 23.0 | 143 (20.3) | 69 (19.6) | 74 (21.0) | 3.7 | ||
| 3 | 70 (1.9) | 50 (1.5) | 20 (4.6) | 18.1 | 34 (4.8) | 19 (5.4) | 15 (4.3) | -5.2 | ||
| 4 | 5 (0.1) | 3 (0.1) | 2 (0.5) | 7.1 | 2 (0.3) | 1 (0.3) | 1 (0.3) | 0 | ||
| Initial symptoms (%) | <0.0001 | 0.8071 | ||||||||
| None | 2970 (78.9) | 2721 (81.9) | 249 (56.3) | -57.5 | 444 (61.2) | 224 (61.5) | 220 (60.8) | -1.16 | ||
| Localized | 733 (19.5) | 565 (17.0) | 168 (38.0) | 48.4 | 251 (34.6) | 126 (34.6) | 125 (34.5) | -0.2 | ||
| Generalized | 62 (1.7) | 37 (1.1) | 25 (5.7) | 25.4 | 31 (4.3) | 14 (3.9) | 17 (4.7) | 4.2 | ||
Values are expressed as numbers, mean (standard deviation), and median (interquartile range).
Statistical analysis was performed using the Wilcoxon signed rank sum test and the Cochran Mantel-Haenszel test for pair-matched data.
ECOG PS: Eastern Cooperative Oncology Group Performance Status; ASA: American Society of Anesthesiologists; BMI: body mass index; DM: diabetes mellitus; CKD: chronic kidney disease
Surgical outcomes of all patients and patients analyzed with propensity score matching
| Variables | All patients (n=3832) | Standardized difference (%) | p-value | PS-matched patients (n=732) | Standardized difference (%) | p-value | ||||
|---|---|---|---|---|---|---|---|---|---|---|
| Overall | No transfusion (n=3385) | Transfusion (n=447) | Overall | No transfusion (n=366) | Transfusion (n=366) | |||||
| Type of surgery (%) | <0.0001 | 0.5479 | ||||||||
| Radical | 2246 (58.6) | 1869 (55.2) | 377 (84.3) | 66.9 | 599 (81.8) | 302 (82.5) | 297 (81.2) | -3.5 | ||
| Partial | 1569 (40.9) | 1501 (44.3) | 68 (15.2) | -67.2 | 127 (17.4) | 60 (16.4) | 67 (18.3) | 5.1 | ||
| Partial → Radical | 17 (0.4) | 15 (0.4) | 2 (0.5) | 0.2 | 6 (0.8) | 4 (1.1) | 2 (0.5) | -6.0 | ||
| Surgical approach (%) | <0.0001 | 0.9324 | ||||||||
| Open | 2435 (64.9) | 2120 (62.6) | 365 (81.7) | 43.4 | 576 (78.7) | 287 (78.4) | 289 (79.0) | 1.3 | ||
| Laparoscopy | 691 (18.0) | 639 (18.9) | 52 (11.6) | -20.3 | 101 (13.8) | 53 (14.5) | 48 (13.1) | -3.9 | ||
| HALS | 220 (5.7) | 202 (6.0) | 18 (4.0) | -8.9 | 33 (4.5) | 16 (4.4) | 17 (4.6) | 1.3 | ||
| Robot | 436 (11.4) | 424 (12.5) | 12 (2.7) | -37.8 | 22 (3.0) | 10 (2.7) | 12 (3.3) | 3.2 | ||
| Preop. Hb≥12.0 g/dL (%) | 3175 (83.7) | 2944 (87.8) | 231 (52.7) | -82.9 | <0.0001 | 426 (59.8) | 213 (60.2) | 213 (59.5) | -1.4 | >0.9999 |
| Preop. Alb≥3.5 g/dL (%) | 3517 (94.3) | 3177 (96.0) | 340 (80.7) | -49.1 | <0.0001 | 589 (85.7) | 295 (86.3) | 294 (85.2) | -2.9 | 0.7140 |
| Preop. Ca<10.0 mg/dL (%) | 3232 (89.9) | 2891 (90.5) | 341 (84.8) | -17.3 | 0.0004 | 583 (88.7) | 298 (90.3) | 285 (87.2) | -9.9 | 0.4142 |
| Operation time (min) | 84.79 | <0.0001 | 59.9 | <0.0001 | ||||||
| Mean (SD) | 165.8 (65.3) | 158.2 (55.70) | 225.6 (97.6) | 193.8 (82.5) | 170.1 (65.9) | 217.4 (90.3) | ||||
| Median (IQR) | 155.0 (120.0-200.0) | 150.0 (120.0-190.0) | 210.0 (160.0-270.0) | 180.0 (135.0-240.0) | 160.0 (120.0-210.0) | 205.0 (160.0-260.0) | ||||
| Blood loss (ml) | 102.6 | <0.0001 | 92.1 | <0.0001 | ||||||
| Mean (SD) | 359.3 (577.7) | 249.2(227.9) | 1207.7 (1301.4) | 733.9 (931.7) | 335.9 (315.1) | 1106.8 (1141.2) | ||||
| Median (IQR) | 200.0 (100.0-400.0) | 200.0 (100.00-300.0) | 850.0 (400.0-1400.0) | 400.0 (200.0-900.0) | 300.0 (150.0-400.0) | 800.0 (400.0-1300.0) | ||||
Values are expressed as numbers, mean (standard deviation), and median (interquartile range).
Statistical analysis was performed using the Wilcoxon signed rank sum test and the Cochran Mantel-Haenszel test for pair-matched data.
All statistical analyses were performed using the software package SAS Enterprise Guide 5.1 (SAS Institute, Inc, Cary, North Carolina) or R software version 2.15.3 (R Foundation for Statistical Computing, Vienna, Austria; www.r-project.org). A value of p < 0.05 was considered statistically significant.
Results
Baseline demographics
Of 3,832 patients undergoing curative surgery for RCC, 447 patients (11.7%) received PBT. Baseline demographics for these patients, as well as for the patients who did not receive PBT, can be found in Table 1. Before propensity score matching, patients in the transfusion group were significantly older, and had lower BMI, higher comorbidities, worse ECOG performance status, and more initial symptoms. Matching of patients according to a propensity score resulted in a cohort that consisted of 366 patients in the non-transfusion group and of 366 patients in the transfusion group. Standardized differences for all measured variables except operation time and blood loss were <10%, suggesting substantial balance across the groups (Table 1, 2, and 3). In the propensity-matched cohort, baseline demographics were not significantly different between the non-transfusion and transfusion groups.
Surgical outcomes
Surgical outcomes according to the PBT are presented in Table 2. Patients in the transfusion group received more radical nephrectomies via more open approaches compared with the non-transfusion group. Patients in the transfusion group had lower preoperative hemoglobin levels, lower preoperative albumin levels, and higher preoperative corrected calcium levels. In addition, patients in the transfusion group had longer operation times and more blood loss. However, matched pairs showed similar surgical outcomes except for operation time and blood loss.
Pathologic outcomes
In the unmatched patients, the pathologic TNM stage was significantly higher in patients who received PBT. Likewise, a larger mass size, a higher nuclear grade, more sarcomatoid differentiation, and more tumor necrosis were all observed more frequently in patients who received PBT. However, after propensity score matching, all these pathologic variables were equivalent between the matched groups (Table 3).
Pathologic outcomes of all patients and those analyzed with Propensity score matching
| Variables | All patients (n=3832) | Standardized difference (%) | p-value | PS-matched patients (n=732) | Standardized difference (%) | p-value | ||||
|---|---|---|---|---|---|---|---|---|---|---|
| Overall | No transfusion (n=3385) | Transfusion (n=447) | Overall | No transfusion (n=366) | Transfusion (n=366) | |||||
| pT stage (%) | <0.0001 | 0.9573 | ||||||||
| 1a | 2086 (54.4) | 1973(58.29) | 113(25.28) | -71.0 | 214 (29.2) | 104 (28.4) | 110 (30.1) | 3.6 | ||
| 1b | 791 (20.6) | 737(21.77) | 54(12.08) | -26.1 | 109 (14.9) | 56 (15.3) | 53 (14.5) | -2.3 | ||
| 2a | 240 (6.3) | 203(6.00) | 37(8.28) | 8.9 | 74 (10.1) | 39 (10.7) | 35 (9.6) | -3.7 | ||
| 2b | 99 (2.6) | 70(2.07) | 29(6.49) | 22.0 | 54 (7.4) | 28 (7.7) | 26 (7.1) | -2.1 | ||
| 3a | 473 (12.3) | 338(9.99) | 135(30.20) | 52.1 | 207 (28.3) | 103 (28.1) | 104 (28.4) | 0.6 | ||
| 3b | 69 (1.8) | 35(1.03) | 34(7.61) | 32.8 | 39 (5.3) | 17 (4.6) | 22 (6.0) | 6.1 | ||
| 3c | 12 (0.3) | 0(0.00) | 12(2.68) | 23.5 | 0 (0) | 0 (0) | 0 (0) | -3.8 | ||
| 4 | 62 (1.6) | 29(0.86) | 33(7.38) | 33.3 | 35 (4.8) | 19 (5.2) | 16 (4.4) | 3.6 | ||
| LN metastasis (%) | 143 (3.7) | 78 (2.3) | 65 (14.5) | 45.2 | <0.0001 | 73 (10.0) | 35 (9.6) | 38 (10.4) | 2.7 | 0.6911 |
| Synchronous metastasis (%) | 277 (7.2) | 163 (4.8) | 114 (25.5) | 60.2 | <0.0001 | 142 (19.4) | 69 (18.9) | 73 (19.9) | 2.8 | 0.6976 |
| Mass size (cm) | 98.3 | <0.0001 | 0.63 | 0.7888 | ||||||
| Mean (SD) | 45.9 (31.8) | 41.7 (27.0) | 77.9 (44.5) | 69.7 (40.0) | 69.6(39.4) | 69.8 (40.6) | ||||
| Median (IQR) | 37.0 (23.0-60.0) | 35.0 (22.0-55.0) | 75.0 (40.0-108.0) | 65.0 (37.0-100.0) | 60.0 (38.0-95.0) | 65.0 (35.0-100.0) | ||||
| Histologic subtype (%) | 0.2084 | 0.2918 | ||||||||
| Clear cell | 3200 (83.5) | 2836 (83.8) | 364 (81.4) | -6.2 | 612 (83.6) | 311 (85.0) | 301 (82.2) | -7.4 | ||
| Non-clear cell | 632 (16.5) | 549 (16.2) | 83 (18.6) | 6.2 | 120 (16.4) | 55 (15.0) | 65 (17.8) | 7.4 | ||
| Fuhrman's nuclear grade (%) | <0.0001 | 0.6276 | ||||||||
| 1 | 154 (4.7) | 145 (5.0) | 9 (2.3) | -14.1 | 17 (2.8) | 8 (2.6) | 9 (2.9) | 1.6 | ||
| 2 | 1572 (47.7) | 1462 (50.2) | 110 (28.7) | -45.2 | 210 (34.3) | 104 (34.3) | 106 (34.3) | -0.1 | ||
| 3 | 1330 (40.3) | 1158 (39.8) | 172 (44.8) | 10.2 | 283 (46.2) | 140 (46.2) | 143 (46.3) | 0.2 | ||
| 4 | 241 (7.3) | 148 (5.1) | 93 (24.2) | 56.2 | 102 (16.7) | 51 (16.8) | 51 (16.5) | -0.9 | ||
| Sarcomatoid differentiation (%) | 66 (2.2) | 46 (1.7) | 20 (6.7) | 25.4 | <0.0001 | 24 (4.8) | 12 (4.8) | 12 (4.7) | -0.2 | 0.1573 |
| Necrosis (%) | <0.0001 | 0.6050 | ||||||||
| No | 2277 (88.1) | 2114 (89.9) | 163 (69.4) | -52.8 | 299 (75.9) | 148 (74.4) | 151 (77.4) | 7.2 | ||
| Microscopic | 105 (4.1) | 97 (4.1) | 8 (3.4) | -3.8 | 12 (3.1) | 6 (3.0) | 6 (3.1) | 0.4 | ||
| Macroscopic | 204 (7.9) | 140 (6.0) | 64 (27.2) | 59.7 | 83 (21.1) | 45 (22.6) | 38 (19.5) | -7.7 | ||
Values are expressed as numbers, mean (standard deviation), and median (interquartile range).
Statistical analysis was performed using the Wilcoxon signed rank sum test and the Cochran Mantel-Haenszel test for pair-matched data.
PS: propensity score; LN: lymph node
Predictive factors for PBT
Table 4 shows the logistic regression model that predicted the patients who received PBT. The odds ratio of PBT increased significantly with age at diagnosis. Patients with lower preoperative hemoglobin levels and higher ASA scores were more likely to receive PBT. Patients who underwent surgery via a laparoscopic approach received less PBT. Finally, tumor stage and Fuhrman's nuclear grade were significantly associated with increased PBT.
Predictive factors for perioperative blood transfusion
| Variables | Odds ratio | 95% CI | p-value |
|---|---|---|---|
| Age (yr) | |||
| ≤ 65 | Reference | ||
| > 65 | 1.219 | 0.984-1.644 | 0.082 |
| Preop. Hb | |||
| <12.0 g/dL | 3.197 | 2.169-4.964 | <0.001 |
| ≥12.0 g/dL | Reference | ||
| ASA score | |||
| 1 | Reference | ||
| 2 | 5.334 | 0.271-10.487 | 0.271 |
| 3 | 14.253 | 2.774-26.251 | 0.016 |
| 4 | 16.283 | 3.881-30.082 | <0.001 |
| Surgical approach | |||
| Open | Reference | ||
| Laparoscopy* | 0.679 | 0.516-0.842 | 0.016 |
| pT stage | |||
| 1 | Reference | ||
| 2 | 1.238 | 0.599-2.559 | 0.564 |
| 3 | 2.497 | 1.141-5.461 | 0.022 |
| 4 | 5.336 | 2.481-11.477 | <0.001 |
| LN metastasis | 1.637 | 0.944-2.840 | 0.079 |
| Synchronous metastasis | 1.641 | 1.040-2.589 | 0.033 |
| Fuhrman's nuclear grade | |||
| 1 | Reference | ||
| 2 | 1.016 | 0.769-3.466 | 0.137 |
| 3 | 1.879 | 1.162-3.038 | 0.011 |
| 4 | 2.292 | 1.172-3.466 | 0.010 |
| Lymphovascular invasion | 2..376 | 1.348-4.188 | 0.003 |
* Include laparoscopic, hand-assisted laparoscopic, and robotic surgery
ASA: American Society of Anesthesiologists; LN: lymph node; CI: confidence interval
Oncologic outcomes
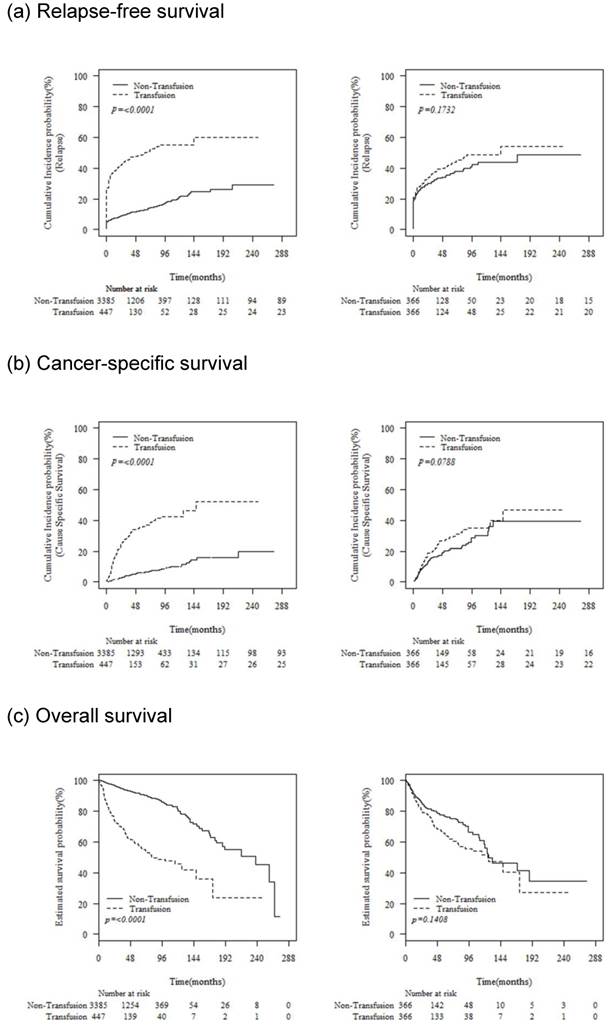
The median follow-up duration was 42 (interquartile range [IQR], 12-65) months. Before propensity score matching, relapse-free survival, cancer-specific survival, and overall survival rates were worse in patients who received PBT; however, these differences in the matched pairs became insignificant after propensity score matching (Fig. 1).
Oncologic outcomes associated with the receipt of perioperative blood transfusion before and after propensity score matching
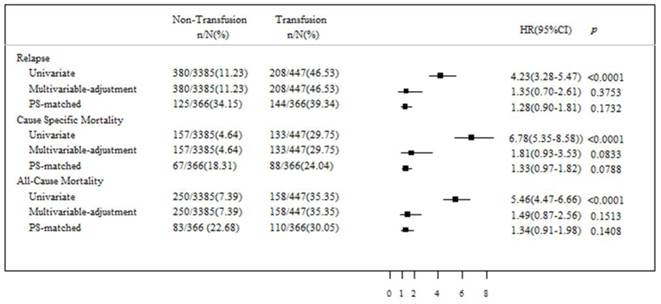
The unadjusted Cox proportional hazards regression analysis showed that PBT was significantly associated with disease relapse (hazard ratio [HR], 4.23; 95% confidence interval [CI], 3.28-5.47; p < 0.0001), cancer-specific mortality (HR, 6.78; 95% CI, 5.35-8.58; p < 0.0001), and all-cause mortality (HR, 5.46; 95% CI, 4.47-6.66; p < 0.0001) (Fig. 2). However, after risk adjustment in multivariable Cox regression analysis, a significant prognostic effect of PBT on disease relapse, cancer-specific mortality, and all-cause mortality could not be proven. Moreover, after adjustment of the data according to the propensity score analysis, PBT was not confirmed to be a statistically significant independent risk factor for disease relapse, cancer-specific mortality, or all-cause mortality.
Comparison of the association between perioperative blood transfusion and relapse, cancer-specific mortality, and all-cause mortality using multivariate Cox regression analysis, and regression adjustment with Propensity score matching.
Discussion
Whether PBT has an adverse effect on oncologic outcomes after curative surgery in patients with RCC still remains controversial. In our study, PBT was one of the significant prognostic factors for disease relapse, cancer-specific mortality, and all-cause mortality in the unadjusted analysis. Receipt of PBT was associated with poor preoperative general conditions and worse pathologic features. However, after adjusting for confounding variables using both multivariate Cox regression and propensity score matching analyses, our results indicate that PBT does not influence the prognosis of patients who received curative surgery for RCC. Thus, the negative association between PBT and poor prognosis might be due to the overall severity of the patients' illness requiring PBT, but not due to the PBT itself.
The adverse effect of PBT observed in several cancers is speculated to be a result of immunosuppression [4, 5] and the induction of angiogenesis [18, 19]. Many experimental studies show changes in immune function, including decreased Th1 and increased Th2 cytokine production, decreased numbers of CD4 helper cells and natural killer cells, and increased numbers of CD8 T cells [4, 5, 20]. Moreover, PBT may promote tumor proliferation by inducing angiogenesis [18, 19]. Patel et al. reported that PBT is associated with a significant increase in vascular endothelial growth factor and a decrease in endostatin, which might be associated with an elevation of in vitro angiogenesis [18]. Also, Nielsen et al. demonstrated that soluble vascular endothelial growth factor is present in various blood products used for transfusion [19]. However, their contribution to in vivo immunosuppression or angiogenesis remains speculative. The immune response is a complex biological phenomenon of cell-to-cell interactions mediated by many intercellular and intracellular molecules. It is also known that changes in human immune parameters after allogenic transfusion are not always consistent [21, 22] and that clinically significant immunosuppression is not universal.
Although RCC is considered to be an immunogenic tumor, limited studies comparing the prognosis of patients who underwent curative surgery for RCC with or without PBT have shown conflicting results. Similar to our study, several previous studies have demonstrated no statistically significant association between PBT and poor oncologic outcomes in patients with RCC [14, 15]. More recently, Linder et al. also reported that PBT was not associated with cancer-specific mortality (HR, 1.15; p = 0.31) or disease recurrence (HR, 1.04; p = 0.77), while the association of PBT with all-cause mortality (HR, 1.23; p = 0.02) was statistically significant [12]. A substantial weakness of these previous studies is their small sample size and lack of matching for confounding variables. Our study confirms the results from these previous studies in a large multicenter cohort using Propensity score analysis to minimize the biases from confounding factors between the groups.
Conversely, Soubra et al. reported that PBT was associated with greater cancer-specific mortality (HR, 1.315; p = 0.0069) and all-cause mortality (HR, 1.347; p < 0.0001) in 14,379 patients with RCC using the Surveillance, Epidemiology, and End Results-Medicare data set [13]. However, their study was limited in that there were many patients without information regarding clinically important pathologic variables, such as tumor stage (344 out of 1501 patients), and tumor grade (439 out of 1501 patients), which can lead to invalid and biased conclusions, even though they performed Propensity score matching.
We found that PBT is clearly associated with more aggressive disease and worse clinical features that, in themselves, are independent predictors of poor oncologic outcomes. Patients receiving PBT were significantly older, had more comorbidities, had worse ECOG performance status, and were more likely to have advanced disease. Results from previous studies support the association of PBT with adverse clinicopathologic parameters. Linder et al. found that patients receiving PBT were significantly older, with a higher frequency of symptomatic presentation, worse ECOG performance status, and more frequent adverse pathologic features [12]. Also, Soubra et al. demonstrated that the odds ratio of PBT increased with age, gender, tumor stage, surgical volume, and Charlson comorbidity index [13]. Taken together, our findings and those of others lead us to conclude that poor oncologic outcomes in patients who received PBT reflect patients' overall severity of illness.
The potential limitations of our study should be addressed. First, the retrospective nature of this study may have resulted in selection bias. Although we performed propensity score analysis to simulate randomization, there remained a possibility of uncontrolled confounding factors between the groups. However, for ethical reasons, it may be impossible to perform a randomized control trial in which patients are randomly assigned to receive PBT or not. Second, the transfusion strategy might have been influenced over time and according to the physicians' discretion. Moreover, the amount of PBT, which may affect patients' outcome in a dose-dependent manner, could not be evaluated due to its retrospective nature.
Conclusions
We found that receipt of PBT was associated with more aggressive disease and worse clinical features. After adjusting for confounding variables using both multivariate Cox regression and propensity score matching analyses, our results indicate that PBT does not influence the prognosis of patients who received curative surgery for RCC.
Acknowledgements
The statistical consultation was supported by a grant of the Korean Health Technology R&D Project, Ministry of Health & Welfare, Republic of Korea (HI14C1731).
Competing Interests
The authors have declared that no competing interest exists.
References
1. Yang JC, Childs R. Immunotherapy for renal cell cancer. Journal of clinical oncology: official journal of the American Society of Clinical Oncology. 2006;24:5576-83
2. Santoni M, Berardi R, Amantini C, Burattini L, Santini D, Santoni G. et al. Role of natural and adaptive immunity in renal cell carcinoma response to VEGFR-TKIs and mTOR inhibitor. International journal of cancer Journal international du cancer. 2014;134:2772-7
3. Ng CS, Novick AC, Tannenbaum CS, Bukowski RM, Finke JH. Mechanisms of immune evasion by renal cell carcinoma: tumor-induced T-lymphocyte apoptosis and NFkappaB suppression. Urology. 2002;59:9-14
4. Opelz G, Terasaki PI. Poor kidney-transplant survival in recipients with frozen-blood transfusions or no transfusions. Lancet. 1974;2:696-8
5. Gascon P, Zoumbos NC, Young NS. Immunologic abnormalities in patients receiving multiple blood transfusions. Annals of internal medicine. 1984;100:173-7
6. Burrows L, Tartter P. Effect of blood transfusions on colonic malignancy recurrent rate. Lancet. 1982;2:662
7. Choi JH, Chung HC, Yoo NC, Lee HR, Lee KH, Kim JH. et al. Perioperative blood transfusions and prognosis in patients with curatively resected locally advanced gastric cancer. Oncology. 1995;52:170-5
8. Donohue JH, Williams S, Cha S, Windschitl HE, Witzig TE, Nelson H. et al. Perioperative blood transfusions do not affect disease recurrence of patients undergoing curative resection of colorectal carcinoma: a Mayo/North Central Cancer Treatment Group study. Journal of clinical oncology: official journal of the American Society of Clinical Oncology. 1995;13:1671-8
9. Little AG, Wu HS, Ferguson MK, Ho CH, Bowers VD, Segalin A. et al. Perioperative blood transfusion adversely affects prognosis of patients with stage I non-small-cell lung cancer. American journal of surgery. 1990;160:630-2 discussion 3
10. Amato A, Pescatori M. Perioperative blood transfusions for the recurrence of colorectal cancer. The Cochrane database of systematic reviews. 2006 CD005033
11. Wang CC, Iyer SG, Low JK, Lin CY, Wang SH, Lu SN. et al. Perioperative factors affecting long-term outcomes of 473 consecutive patients undergoing hepatectomy for hepatocellular carcinoma. Annals of surgical oncology. 2009;16:1832-42
12. Linder BJ, Thompson RH, Leibovich BC, Cheville JC, Lohse CM, Gastineau DA. et al. The impact of perioperative blood transfusion on survival after nephrectomy for non-metastatic renal cell carcinoma (RCC). BJU international. 2014;114:368-74
13. Soubra A, Zabell JR, Adejoro O, Konety BR. Effect of Perioperative Blood Transfusion on Mortality for Major Urologic Malignancies. Clinical genitourinary cancer. 2014
14. Moffat LE, Sunderland GT, Lamont D. Blood transfusion and survival following nephrectomy for carcinoma of kidney. British journal of urology. 1987;60:316-9
15. Jakobsen EB, Eickhoff JH, Andersen JP, Ottesen M. Perioperative blood transfusion does not affect survival after operation for renal cell cancer. European urology. 1994;26:145-8
16. Edge SB, Compton CC. The American Joint Committee on Cancer: the 7th edition of the AJCC cancer staging manual and the future of TNM. Annals of surgical oncology. 2010;17:1471-4
17. Kovacs G, Akhtar M, Beckwith BJ, Bugert P, Cooper CS, Delahunt B. et al. The Heidelberg classification of renal cell tumours. The Journal of pathology. 1997;183:131-3
18. Patel HB, Nasir FA, Nash GF, Scully MF, Kakkar AK. Enhanced angiogenesis following allogeneic blood transfusion. Clinical and laboratory haematology. 2004;26:129-35
19. Nielsen HJ, Werther K, Mynster T, Brunner N. Soluble vascular endothelial growth factor in various blood transfusion components. Transfusion. 1999;39:1078-83
20. Refaai MA, Blumberg N. Transfusion immunomodulation from a clinical perspective: an update. Expert review of hematology. 2013;6:653-63
21. Rodey GE. Blood transfusions and their influence on renal allograft survival. Progress in hematology. 1986;14:99-122
22. Blumberg N, Heal JM. Transfusion and host defenses against cancer recurrence and infection. Transfusion. 1989;29:236-45
Author contact
![]() Corresponding author: Sung-Hoo Hong, M.D., Ph.D., Department of Urology, School of Medicine, The Catholic University of Korea, Seoul St. Mary's Hospital, 505 Banpo-dong, Seocho-gu, Seoul 137-040, Republic of Korea. TEL: +82-2-2258-6228; FAX: +82-2-599-7839; E-mail: toomeyac.kr
Corresponding author: Sung-Hoo Hong, M.D., Ph.D., Department of Urology, School of Medicine, The Catholic University of Korea, Seoul St. Mary's Hospital, 505 Banpo-dong, Seocho-gu, Seoul 137-040, Republic of Korea. TEL: +82-2-2258-6228; FAX: +82-2-599-7839; E-mail: toomeyac.kr