Impact Factor ISSN: 1837-9664

 Global reach, higher impact
J Cancer 2016; 7(4):367-376. doi:10.7150/jca.13695 This issue Cite
Research Paper
HYOU1, Regulated by LPLUNC1, Is Up-Regulated in Nasopharyngeal Carcinoma and Associated with Poor Prognosis
Yujuan Zhou1 #, Qianjin Liao1,2 #, Xiayu Li3, Hui Wang1, Fang Wei1,2, Jie Chen1, Jing Yang2, Zhaoyang Zeng1,2 ![]() , Xiaofang Guo2, Pan Chen1,2, Wenling Zhang2, Ke Tang2, Xiaoling Li2, Wei Xiong1,2, Guiyuan Li1,2
, Xiaofang Guo2, Pan Chen1,2, Wenling Zhang2, Ke Tang2, Xiaoling Li2, Wei Xiong1,2, Guiyuan Li1,2 ![]()
1. Key Laboratory of Translational Radiation Oncology, Hunan Province, Hunan Cancer Hospital and The Affiliated Cancer Hospital of Xiangya School of Medicine, Central South University, 283 Tongzipo Road, Changsha 410013, Hunan, China;
2. The Key Laboratory of Carcinogenesis of the Chinese Ministry of Health and The Key Laboratory of Carcinogenesis and Cancer Invasion of the Chinese Ministry of Education, Cancer Research Institute, Central South University, 110 Xiangya Road, Changsha 410078, Hunan, China;
3. Hunan Key Laboratory of Nonresolving Inflammation and Cancer, Disease Genome Research Center, The Third Xiangya Hospital, Central South University, 138 Tongzipo Road, Changsha 410013, Hunan, China.
# These authors contributed equally to this work.
Received 2015-8-30; Accepted 2015-12-3; Published 2016-1-12
Abstract
Objective: This study aims to investigate the roles and mechanisms of long palate, lung and nasal epithelium clone 1 (LPLUNC1) in nasopharyngeal carcinoma (NPC).
Methods: The two-dimensional fluorescence difference gel electrophoresis (2-D DIGE) and matrix-assisted laser desorption/ionization time of flight mass spectrometry (MALDI-TOF-TOF-MS/MS) was applied to identify differentially expressed proteins after over-expressing LPLUNC1 in NPC cells. The qRT-PCR and Western Blot were used to further validate differentially expression of Hypoxia up-regulated 1 (HYOU1). We also applied immunohistochemistry (IHC) to validate the expression of HYOU1 protein in NPC tissues.
Results: Totally 44 differentially expressed proteins were identified, among which 19 proteins were up-regulated and 25 proteins were down-regulated. Function annotation indicated that these proteins were involved in molecular chaperone, cytoskeleton, metabolism and signal transduction. It was shown that the expression of HYOU1 both at mRNA level and protein level was up-regulated significantly in NPC tissues, and HYOU1 protein expression was positively correlated with clinical staging and metastasis of NPC. Kaplan-Meier survival curves showed that high expression of HYOU1 protein in NPC patients had shorter progression-free survival (PFS) and overall survival (OS). COX multivariate regression analysis further indicated that over-expressed HYOU1 was one of the predictors for poor prognosis in NPC patients.
Conclusion: Through regulating proteins in different pathways, LPLUNC1 may inhibit the growth of NPC through participating in cell metabolism, proliferation, transcription and signaling transduction. HYOU1 can be regarded as potential molecular biomarker for progression and prognosis of NPC.
Keywords: Nasopharyngeal carcinoma, LPLUNC1, Proteomics, 2-D DIGE, MALDI-TOF-TOF-MS/MS, HYOU1.
Introduction
Nasopharyngeal carcinoma (NPC) is one type of malignancies with obvious regional differences [1, 2]. In China, the morbidity of NPC is higher in southern region, especially in the eastern part of Guangzhou and Guangxi, and the incidence rate is about 25-50/100000 [3]. The development and progression of NPC is a complicated process induced by multi-factors. It may be caused by EB virus infection [4, 5], environmental and dietary factors [6], genetic susceptibility [7, 8], and chronic inflammation [9]. Until now, it is still unclear about the molecular mechanisms of NPC.
Long palate, lung and nasal epithelium clone 1 (LPLUNC1) belongs to PLUNC family, which is also named BPI fold containing family B, member 1 (BPIFB1) [10]. LPLUNC1 gene encodes 484 amino acids and contains 2 BPI structural domain, which is a new member in BPI/PLUNC super family [11]. It was studied that LPLUNC1 expression showed tissue specificity in nasopharyngeal [12]. In our previous study, we found that LPLUNC1 was down-regulated in NPC tissues, which might play as a potential tumor suppressor gene [13]. Over-expressed LPLUNC1 can repress proliferation of NPC cells, arrest the cells in G0/G1 stage, and induce cell apoptosis [14, 15]. LPLUNC1 protein can inhibit proliferation of NPC cells induced by IL-6 through suppressing STAT3 signaling pathway [14]. Actually, the molecular mechanism of LPLUNC1 in NPC development is still unclear. To further investigate the roles and mechanisms of LPLUNC1 in NPC, we applied two-dimensional fluorescence difference gel electrophoresis (2-D DIGE) and matrix-assisted laser desorption/ionization time of flight mass spectrometry (MALDI-TOF-TOF-MS/MS) to analyze the changes of proteomics profiles after LPLUNC1 over-expression. It is necessary to identify down-stream genes regulated by LPLUNC1, which provides more valuable indications to understand LPLUNC1 function.
Hypoxia up-regulated 1 protein, also known as oxygen-regulated protein 150 (ORP150), is encoded by HYOU1 gene, which belongs to heat shock protein 70 (HSP70) family. Studies showed that ORP150 protein was over-expressed in many tumors, which was closely related to tumor invasion [16-18]. Increasing of ORP150 protein was correlated with poor prognosis [16], and highly expressed ORP150 inhibited apoptosis of tumor cells induced by drugs [15, 16]. However, the relationship between HYOU1 and cancer requires further investigation in NPC.
In this study, we applied proteomics technology to identify differentially expressed proteins in NPC cells after LPLUNC1 over-expression. The up-regulated 19 proteins and down-regulated 25 proteins were mainly involved in the biological processes including cell metabolism, proliferation, transcription, and signaling transduction, which provided more valuable clues to understand the roles of LPLUNC1 in NPC. HYOU1 was found to be regulated by LPLUNC1 as it was differentially expressed between over-expressed LPLUNC1 NPC cells and NPC cells. Subsequently, HYOU1 is identified to be significantly increased in NPC tissues, which may be regarded as a potential biomarker of malignant progression and poor prognosis in NPC.
Materials and Methods
Establishment of stably LPLUNC1-expressing NPC cells
The NPC cell lines including 5-8F, HNE2 and HONE1 were reserved by Cancer Research Institute of Central South University. After thawing, the cell lines were cultured in RPMI1640 medium containing 10% FBS in the environment of 95% humidity, 5% CO2 at 37 °C. The stably LPLUNC1-expressing NPC cells were established as our previous studies [11, 25]. Briefly, 5-8F, HNE2, HONE1 cells at 4×10⁵/ml were cultured overnight and transfected with vector pIRESneo3 (Clontech, USA) or pIRESneo3-LPLUNC1 (containing a full-length LPLUNC1 cDNA) using Lipofectamine 2000 according to the manufacturer's instruction (Invitrogen, USA). Subsequently, the cells were treated 1 mg/ml of G418 for the selection of positive clones. The LPLUNC1 expression in G418-resistant cells was characterized by quantitative real-time PCR and Western blot. Cell lines stably over-expressing LULUNC1 and cell lines with blank vector were labelled as 5-8F/LPLUNC1 and 5-8F/Vector, HNE2/LPLUNC1 and HNE2/Vector, HONE1/LPLUNC1 and HNOE1/Vector.
Collection of tumor samples
For preparing the NPC tissue microarray (TMA) to detect the protein expression by immunohistochemistry (IHC), we used 387 patients with NPC (256 cases) and non-tumor nasopharyngeal epithelium (NPE, 131 cases) from the Ear, Nose and Throat (ENT) department at Xiangya Hospital and the Second Xiangya Hospital (Changsha, PR China) during January 2002 to October 2004 to collect NPC tumor tissues. The clinicopathologic characteristics of these subjects were listed in Table 1. Among all of the NPC patients, we followed up 81 patients to do survival analysis. The time of following up was from 4 to 95 month, and average was 57 month. All biopsies were immediately fixed in 4% buffered paraformaldehyde, then routinely processed and embedded in paraffin.
The clinicopathologic characteristics of specimens.
| Specimens | Cases |
|---|---|
| NPE | 131 |
| Age (median 46.1 years) ≤ 48 | 66 |
| > 48 | 65 |
| Gender: male | 95 |
| female | 36 |
| NPC | 256 |
| Age (median 48.4 years) ≤ 48 | 125 |
| > 48 | 131 |
| Gender: male | 200 |
| female | 56 |
| Metastasis | 164 |
| No metastasis | 92 |
| Stages I | 28 |
| Stages II | 87 |
| Stages III | 89 |
| Stages IV | 52 |
NPE: non-tumor nasopharyngeal epithelium; NPC: nasopharyngeal carcinoma.
For the mRNA expression study, 36 NPC tissues and 15 NPE samples were obtained from patients in the Hunan Cancer Hospital (the Affiliated Cancer Hospital of Xiangya School Of Medicine, Changsha, China) in 2013. All tissue samples were quick frozen in liquid nitrogen and stored at -80°C until laser-capture micro-dissection (LCM). We used a LEICA CM 1900 (Leica, Solms, Germany) for frozen sections and the Leica AS LMD system (Leica) to obtain the pure tissues.
All of the individuals participating in this project signed the informed consent form and their name, sex, age, pathological diagnosis, tumor, nodal status, metastasis and tumor-node-metastasis classification were recorded.
Two-dimensional fluorescence difference gel electrophoresis (2-D DIGE)
The LPLUNC1-induced differentially expressed protein profile in NPC cells was characterized by 2-D DIGE analysis as described in our previous study [19]. Briefly, cells were collected after growth about 80% fusion, then 2-D DIGE lysate (30mM Tris-HCl, 2M Thiourea, 7M Urea, 4% CHAPS, pH 8.5 protease inhibitor cocktail) was added. Total proteins were extracted on ice, and then the impurities were removed based on the standard protocol of 2D clean-up kit (Bio-Rad, Hercules, California, USA). The BCA assay (Pierce, Beijing, China) was used to detect the protein concentration. Proteins were labelled with fluorescent dye Cy2, Cy3, and Cy5 respectively following the standard procedure of DIGETM kit (GE Healthcare, Piscataway, New Jersey, USA). The protein lysates were subjected to fluorescence dye labeling at a dye/protein ratio of 400 pmol/100 µg for 30 min. Then, 20 µg of proteins from each group were mixed with the same volume of DIGE 2×buffer (8 mol/l urea, 4% w/v CHAPS, 2% w/v DTT, 2% v/v pharmalytes, pH 3-10 for IEF). In addition, 20µg of individual samples were diluted in the rehydration solution (8 mol/l urea, 0.5% w/v CHAPS, 0.2% w/v DTT, 0.2% v/v pharmalyte, pH 3-10). Samples were loaded onto IPG strips (18 cm, pH 3-10, nonlinear, GE Healthcare, Piscataway, New Jersey, USA) for 2-D gel electrophoresis. Fluorescence images were acquired using the Ettan DIGE imager (GE Healthcare, Piscataway, New Jersey, USA), and DIGE gels were analyzed using the DIA (differential in-gel analysis) module of the DeCyder software (version 6.5; GE Healthcare, Piscataway, New Jersey, USA).The differentially expressed proteins were identified by comparing the relative expression (Cy3/Cy2 or Cy5/Cy2) based on the rules (|ratio≥1.2|, P≤0.05) after matching each spot. At the same time, to prepare gels to capture the spots of interest, 1000µg of protein was subjected to 2-D DIGE on IPG strips and stained with Coomassie brilliant blue.
Mass spectrometric analysis and protein identification
The protein spots of interest were excised and de-stained with 25 mmol/l ammonium bicarbonate/50% acetonitrile (CAN), and in-gel digestion was performed with 0.01 µg/µl trypsin (Promega, Madison, Wisconsin, USA) in 25 mmol/l ammonium bicarbonate for 15 h at 37°C. The hydrolysates were collected, and the tryptic peptides were extracted from the gel pieces sequentially with 5% TFA at 40°C for 1 h and then 2.5% TFA/50% ACN at 30°C for 1 h. The extracts were pooled, lyophilized and stored at -20°C until use. Gel pieces from a 'blank' region and from the BSA molecular mass marker were used as negative and positive controls, respectively.
Subsequently, the peptide mixtures were re-dissolved in 0.5% TFA, and 1 µl of peptide solution was mixed with an equal volume of matrix (4-hydroxy-a-cyanocinnamic acid in 30% ACN/ 0.1% TFA). Then, the peptides were spotted on the target plate. Individual protein peptides were identified by MALDI-TOF-TOF mass spectrometry on a 4700 Proteomics Analyser (Applied Biosystems, Foster City, California, USA). The mass spectra were used to examine human protein sequences in the Swiss-Prot database using the Mascot database search algorithm (version 1.9).
RNA isolation and qRT-PCR
Total RNA was extracted from NPC and NPE tissues using the Trizol extraction kit (Invitrogen) according to the manufacturer's instructions, and then reversely transcribed into cDNA using AMV reverse transcriptase (Promega, San Luis Obispo, CA, USA). The levels of target gene mRNA transcripts were determined by qRT-PCR using specific primers and a SYBR-green-containing PCR kit (GenePharma, Shanghai, China). The sequences of primers were forward 5'-CTTCCACATCAACTACGGCG-3' and reverse 5'-CTCTTCTGCGCTGTCCTCTA-3' for HYOU1 (235 bp); forward 5'-GAAGGTGAAGGTCGGAGTC-3' and reverse 5'-GAAGATGGTGATGGGATTTC-3' for GAPDH (226 bp). The relative levels of individual gene mRNA transcripts to control GAPDH were determined.
Western blotting
Total protein was extracted from NPC cells, and the levels of targeting proteins were determined by western blot assays using primary antibodies, including anti-HYOU1 (Abnova, Taibei, Taiwan) and anti-β-actin (Boster, Wuhan, China). The bound antibodies were detected by horseradish peroxidase-conjugated second antibodies and visualized using ECL (Pierce, Rockford, IL, USA). The relative levels of individual proteins to control β-actin were analyzed by ImagJ2 software (Madison, WI, USA).
Immunohistochemistry (IHC)
The expression of HYOU1 in individual NPC and non-tumor NPE specimens was characterized by IHC using the standard streptavidin/peroxidase staining method. For immunohistochemical staining, individual tissue sections at 4 uM were stained with polyclonal mouse anti-HYOU1 (1:500, Abnova, Taibei, Taiwan). Negative mouse serum was used instead of the primary antibody as negative control. A semi-quantitative scoring criterion for IHC was used in which the staining intensity and positive areas were recorded as previously described [20]. The intensity of anti-HYOU1 staining was scored by 0-3, according to the standards of 0 (no staining), 1 (weak staining), 2 (moderate staining) and 3 (strong staining). The percentage of the extent of reactivity was scored as follows: 0 (no positive tumor cells), 1 (<10% positive tumor cells), 2 (10-50% positive tumor cells) and 3 (>50% positive tumor cells). Next, the expression score was obtained by multiplying the intensity and reactivity rate values. Scores of < 4 were classified as low expression, and the remainders were classified as high expression. Individual samples were evaluated by at least two pathologists in a blinded manner, and those samples with inconsistent scores were further discussed and decided.
Statistical analysis
All analyses were performed using SPSS 15.0 program for Windows software package (SPSS, Chicago, IL, USA). Statistical significance among groups was determined by the One-way ANOVA and Student t-test. The chi-square test was used to determine whether two groups had distinct gene expression levels. Survival was estimated using the Kaplan-Meier method and compared by log-rank test. Multivariate logistic analyses using a stepwise Cox regression model after adjusting for baseline characteristics. A P-value of < 0.05 was considered statistically significant.
Results
Differential analysis of protein profiles
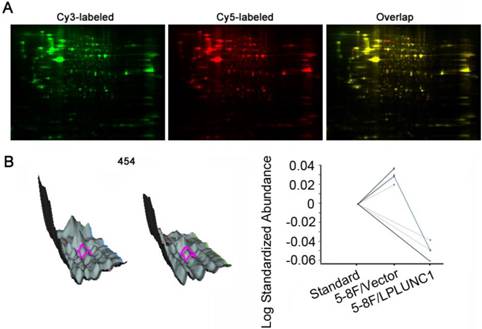
To identify the differentially expressed protein profiles between cells with LPLUNC1 overexpression and cells with LPLUNC1 normal expression, we isolated total proteins in 5-8F/LPLUNC1 and 5-8F/Vector by 2-D DIGE method. After Cy2, Cy3 and Cy5 three-channel image scanning, DeCyder 6.5 software was applied to analyze the matched points in different gel by the rules (t-test, P < 0.05), as shown in Fig. 1A. It was found that 52 proteins were selected as differentially expressed at fold change of 1.2, among which 23 proteins were up-regulated and 29 were down-regulated. Fig. 1B showed the 3D simulation and curves of point 454, and the expression were significantly decreased after LPLUNC1 over-expression (P = 0.00067). The results indicated that over-expressed LPLUNC1 can induce changes of proteomics profiles in NPC.
Comparative proteomic analyses of the 5-8F/LPLUNC1 (long palate, lung, nasal epithelium clone 1) and 5-8F/Vector using two-dimensional fluorescence difference gel electrophoresis (2D-DIGE). A) 2D-DIGE gel images, and differential protein spots detected by Decyder software. The pI ranges from 4 to 7 (left to right). B) Spot 454 three-dimensional simulation of protein (top) and its associated graph view (bottom) which indicating the average ratio of expression for spot 454 by using computational analysis with DeCyder 6.5 software.
Identification of differentially expressed proteins and functional classification
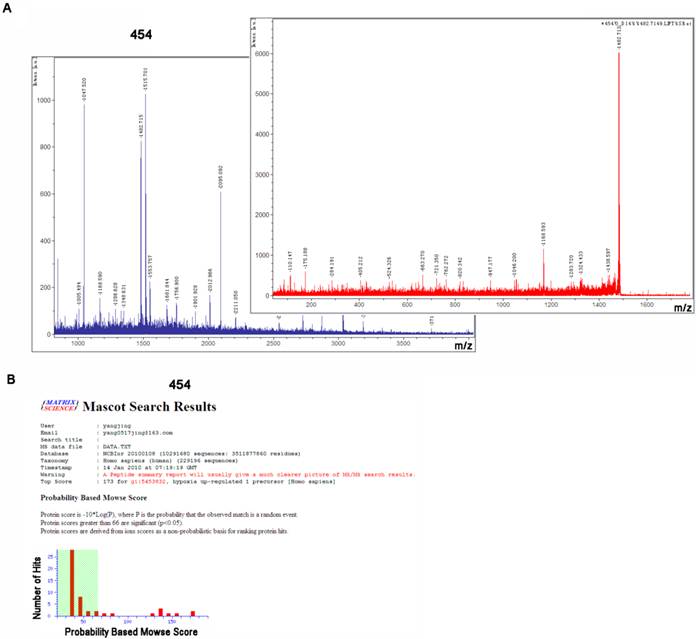
To identify above differentially expressed proteins, we applied mass spectrometry technology to compare the characters with known proteins. After cutting and in-gel digestion, we used MALDI-TOF/TOF-MS/MS to get peptide mass fingerprinting (PMF), and Mascot Distiller software was applied to calculate mass load ratio (m/z) values of peptide fragment through analyzing single isotope PMF. Through searching Mascot query system, SWISS-PROT and NCBInr protein databases, we identified the corresponding proteins. The PMF signals of 454 were shown in Fig. 2A, and the analyzed and searched results were shown in Fig. 2B. The corresponding protein included Hypoxia up-regulated 1 protein (HYOU1). In this study, we identified 44 proteins in 52 differentially expressed proteins, among which 19 proteins were up-regulated and 25 proteins were down-regulated, as shown in Table 2. Based on functional annotation in SWISS-PORT and NCBInr database, these differentially expressed proteins can be classified into five classes: (1) chaperone protein; (2) the cytoskeletal protein; (3) cell metabolism enzymes or proteins; (4) signal transduction molecules; (5) Other functional proteins. The results indicated that LPLUNC1 regulated the growth of NPC through participating in processes of cell metabolism, proliferation, transcription and signaling transduction.
Spot 454 was identified as hypoxia up-regulated 1 precursor (HYOU1) by using matrix-assisted laser desorption/ionization time of flight (MADLI-TOF/TOF), respectively. A) The peptide mass fingerprinting and LIFT analysis of spot 454, which was carried out using MADLI-TOF/TOF. B) Spot 454 was identified as HYOU1 through using Mascot search.
The different proteins identified by MALDI-TOF/TOF-MS/MS.
| Master No. | Accession number | Protein name | T-test | Av. Ratio | Mass weight | pI | Coverage (%) | Scores |
|---|---|---|---|---|---|---|---|---|
| 1758 | gi|27807361 | nuclease sensitive element binding protein 1 | 0.0062 | -3.19 | 35903 | 9.87 | 46 | 123 |
| 1714 | gi|48145673 | HNRPH1 | 0.023 | -2.54 | 49384 | 5.79 | 42 | 153 |
| 1744 | gi|27807361 | nuclease sensitive element binding protein 1 | 0.013 | -2.5 | 35903 | 9.87 | 53 | 177 |
| 1770 | gi|119581154 | keratin 17, isoform CRA_a | 0.014 | -2.34 | 48232 | 5 | 53 | 252 |
| 1771 | gi|4557701 | keratin 17 | 0.012 | -2.3 | 48361 | 4.97 | 65 | 323 |
| 1764 | gi|47939651 | KRT17 protein | 0.016 | -2.18 | 40520 | 4.9 | 41 | 87 |
| 2857 | gi|337518 | ribosomal protein | 0.01 | -2.18 | 21835 | 10.09 | 48 | 78 |
| 1558 | gi|62913980 | KRT8 protein | 0.029 | -1.84 | 41083 | 4.94 | 54 | 240 |
| 497 | gi|5032179 | Tripartite motif-containing 28 | 0.018 | -1.68 | 90261 | 5.52 | 34 | 235 |
| 2363 | gi|11056044 | pyrophosphatase 1 | 0.015 | -1.61 | 33095 | 5.54 | 36 | 106 |
| 1613 | gi|4504919 | keratin 8 | 0.00024 | -1.54 | 53671 | 5.52 | 73 | 535 |
| 2044 | gi|62738363 | Chain A, The 2.1 A Structure Of A Tumour Suppressing Serpin | 0.011 | -1.49 | 42259 | 5.72 | 35 | 127 |
| 1980 | gi|3646128 | thioredoxin-like protein | 0.0056 | -1.47 | 37751 | 5.25 | 54 | 165 |
| 2806 | gi|4507669 | tumor protein, translationally-controlled 1 | 0.041 | -1.44 | 19697 | 4.84 | 38 | 76 |
| 2045 | gi|55597035 | PREDICTED: gelsolin-like capping protein isoform 9 | 0.022 | -1.36 | 38779 | 5.88 | 47 | 188 |
| 1257 | gi|62897681 | calreticulin precursor variant | 0.0033 | -1.33 | 47061 | 4.3 | 20 | 66 |
| 2115 | gi|157834561 | Chain A, Aldehyde Reductase | 0.036 | -1.32 | 36761 | 6.34 | 36 | 80 |
| 1760 | gi|4557701 | keratin 17 | 0.04 | -1.3 | 48361 | 4.97 | 49 | 323 |
| 1982 | gi|119575505 | serpin peptidase inhibitor, clade B (ovalbumin), member 6, isoform CRA_c | 0.0042 | -1.29 | 44313 | 5.32 | 48 | 133 |
| 1991 | gi|6678271 | TAR DNA binding protein | 0.029 | -1.26 | 45053 | 5.85 | 36 | 118 |
| 1093 | gi|6470150 | BiP protein | 0.041 | -1.26 | 71002 | 5.23 | 18 | 71 |
| 1525 | gi|66361514 | Chain A, X-Ray Structure Of A Deletion Variant Of Human Glucose 6- Phosphate Dehydrogenase Complexed With Structural And Coenzyme Nadp | 0.0066 | -1.22 | 56688 | 6.69 | 43 | 187 |
| 2493 | gi|112696539 | immunoglobulin heavy chain variable region | 0.03 | -1.22 | 11149 | 8.91 | 64 | 88 |
| 2513 | gi|83754467 | Chain A, Molecular Basis For The Recognition Of Phosphorylated And Phosphoacetylated Histone H3 By 14-3-3 | 0.035 | -1.21 | 29413 | 4.97 | 53 | 200 |
| 454 | gi|5453832 | hypoxia up-regulated 1 precursor | 0.00067 | -1.2 | 111494 | 5.16 | 17 | 173 |
| 2011 | gi|48257132 | GLRX3 protein | 0.036 | 1.2 | 32823 | 5.36 | 49 | 131 |
| 1135 | gi|5729877 | heat shock 70kDa protein 8 isoform 1 | 0.033 | 1.21 | 71082 | 5.37 | 54 | 251 |
| 1383 | gi|67464392 | Chain A, Structure Of Human Muscle Pyruvate Kinase | 0.0049 | 1.21 | 60277 | 8.22 | 36 | 73 |
| 2265 | gi|190281 | protein phosphatase I alpha subunit (PPPIA) (EC 3.1.3.16) | 0.0034 | 1.22 | 35844 | 6.36 | 31 | 76 |
| 2577 | gi|4505773 | prohibitin | 0.014 | 1.22 | 29843 | 5.57 | 58 | 205 |
| 1495 | gi|220702506 | Chain A, TapasinERP57 HETERODIMER | 0.017 | 1.23 | 54541 | 5.61 | 60 | 262 |
| 1091 | gi|24234688 | heat shock 70kDa protein 9 precursor (HSPA9 ) | 0.045 | 1.25 | 73920 | 5.87 | 37 | 351 |
| 2264 | gi|109102505 | PREDICTED: similar to Serine/threonine-protein phosphatase PP1-beta catalytic subunit (PP-1B) isoform 1 | 0.021 | 1.25 | 34840 | 5.83 | 19 | 175 |
| 1130 | gi|167466173 | heat shock 70kDa protein 1B | 0.036 | 1.26 | 70294 | 5.48 | 46 | 187 |
| 1486 | gi|23308577 | phosphoglycerate dehydrogenase | 0.0063 | 1.26 | 57356 | 6.29 | 41 | 237 |
| 2261 | gi|31645 | glyceraldehyde-3-phosphate dehydrogenase | 0.013 | 1.33 | 36202 | 8.26 | 8 | 97 |
| 2559 | gi|5454052 | stratifin | 0.021 | 1.34 | 27871 | 4.68 | 60 | 202 |
| 1755 | gi|5031573 | ARP3 actin-related protein 3 homolog | 0.044 | 1.37 | 47797 | 5.61 | 31 | 80 |
| 2337 | gi|4502101 | annexin I | 0.048 | 1.38 | 38918 | 6.57 | 40 | 100 |
| 1940 | gi|4757756 | annexin A2 isoform 2 | 0.004 | 1.4 | 38808 | 7.57 | 37 | 106 |
| 2211 | gi|119602552 | hCG2036836 | 0.013 | 1.52 | 13613 | 8.63 | 56 | 71 |
| 1424 | gi|151567677 | Chain A, X-Ray Structure Of Human Thioredoxin Reductase 1 | 0.0037 | 1.55 | 57632 | 6.48 | 35 | 131 |
| 1431 | gi|49168498 | TXNRD1 | 0.017 | 1.67 | 55281 | 6.07 | 32 | 95 |
| 2151 | gi|4557976 | Chain A, Human Muscle Fructose 1,6-Bisphosphate Aldolase Complexed With Fructose 1,6-Bisphosphate | 0.002 | 1.95 | 39720 | 8.39 | 48 | 158 |
Validation of HYOU1
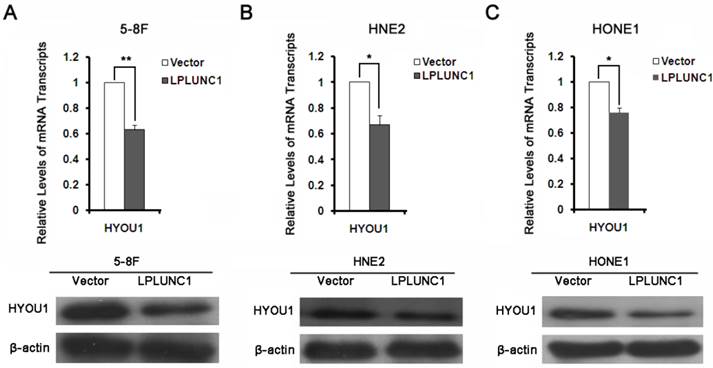
To validate the results from proteomics analysis, we selected HYOU1 for further validation by qRT-PCR and Western blot. It was shown that the expressions of HYOU1 was significantly down-regulated after over-expressing LPLUNC1 in 5-8F cell lines, which was consistent with mass spectrometry results (as shown in Fig. 3A). As shown in Fig. 3B and 3C, the expression of HYOU1 was also significantly down-regulated after over-expressing LPLUNC1 in HNE2 and HONE1 cells. All the results indicated that the identification based on proteomics was accurate and reliable.
The expression of HYOU1 proteins in NPC. A) Detection the expression of HYOU1 in 5-8F cell line over-expressed LPLUNC1 and its control cell lines by qRT-PCR and Western Blot. Compared with control, **P < 0.01. B) Detection the expression of HYOU1 in HNE2 cell line over-expressed LPLUNC1 and its control cell lines by qRT-PCR and Western Blot. Compared with control, **P < 0.01. C) Detection the expression of HYOU1 in HONE1 cell line over-expressed LPLUNC1 and its control cell lines by qRT-PCR and Western Blot. Compared with control, **P < 0.01.
Expression of HYOU1 in NPC tissues
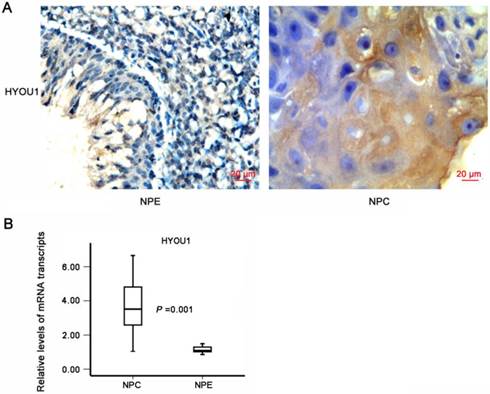
To further investigate the expressions and clinical associations of HYOU1 protein in NPC tissues, we applied NPC tissue microarray and IHC methods to detect the expressions. It was found that the expressions of HYOU1 protein significantly increased in NPC tissues than in normal nasopharyngeal epithelium (X2 =84.041, P = 0.000). As shown in Table 3, HYOU1 protein expression (171/256, 66.80%) was higher in NPC tissues, but only 23 out of 131 NPE specimens (17.56%) had a high expression of HYOU1. HYOU1 protein expression was positively correlated with clinical staging (P < 0.001) and metastasis (P = 0.004), while no significant association with gender (P = 0.405) and age (P = 0.583) was found. Fig. 4A showed a typical expression of HYOU1 protein in NPC tissues. We also applied laser capture microdissection (LCM) to ensure the purity of NPC tissues and normal nasopharyngeal tissues. We applied qRT-PCR to further detect expression of HYOU1 in mRNA level. It was shown that HYOU1 mRNA expression was also up-regulated significantly in NPC tissues (P < 0.001, as shown in Fig. 4B). All these results illustrated that high expression of HYOU1 may promote the development and progression of NPC.
Relationships between HYOU1 expression level and clinicopathologic characteristics.
| Characteristics | cases | HYOU1 | ||
|---|---|---|---|---|
| High | Low | P Value | ||
| Normal | 131 | 23 | 108 | |
| Age ≤ 48 | 66 | 12 | 54 | |
| > 48 | 65 | 11 | 54 | 0.850 |
| Gender: male | 95 | 17 | 78 | |
| Female | 36 | 6 | 30 | 0.869 |
| Tumor | 256 | 171 | 85 | |
| Age ≤ 48 | 125 | 87 | 38 | |
| > 48 | 131 | 84 | 47 | 0.583 |
| Gender: male | 200 | 131 | 69 | |
| Female | 56 | 40 | 16 | 0.405 |
| Metastasis | 164 | 127 | 37 | |
| No metastasis | 92 | 44 | 48 | 0.000 |
| Stages I + II | 115 | 66 | 49 | |
| Stages III + IV | 141 | 105 | 36 | 0.004 |
The expression of HYOU1 in nasopharyngeal carcinoma tissues. A) The expression of HYOU1 in normal tissues and nasopharyngeal carcinoma tissues by IHC detection (magnification×400, scale bars 20 µm). B) qRT-PCR analysis of the relative expression levels of HYOU1 in 36 NPC specimens and 15 NPE specimens; data were normalised according to β-actin. Differences between groups were analysed using the chisquare test (HYOU1: P = 0.001).
Association of poor prognosis with expression of HYOU1
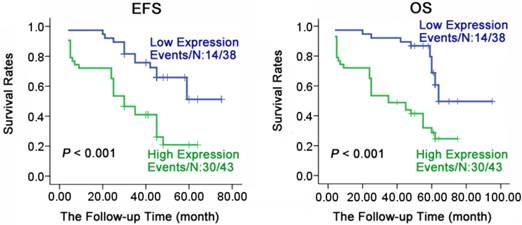
To understand the relationship of prognosis with expression of HYOU1 in NPC, we applied Kaplan-Meier method to do survival analysis for 81 patients (follow up from 4 to 95 months, average 57 months). As shown in Fig. 5, HYOU1 protein expression was closely related to overall survival (OS) and progression free survival (PFS). PFS (36.8% vs 69.8%, X2 =13.618, P < 0.001) and OS (36.8% vs 69.8%, X2 =15.660, P < 0.001) in NPC patients with low expression of HYOU1 protein was significantly better than patients with high expression. As shown in Table 4, we found that the age, gender, clinical staging and metastasis had no significant association with PFS or OS of patients through COX multi-factor regression, while HYOU1 protein expression was significantly related to the PFS and OS. For example, NPC patients who had high expression of HYOU1 protein, had a shorter PFS and OS. PFS HR was 2.602 (P = 0.007), and OS HR was 2.507 (P = 0.010). In summary, we can conclude that highly expressed HYOU1 is a potential biomarker of poor prognosis in NPC patients.
Expression levels of HYOU1 were significantly correlated with the survival of NPC patients. Kaplan-Meier estimated progression-free survival (PFS) and overall survival (OS) for NPC patients according to the expression levels of HYOU1 protein in 81 NPC patients. P values were obtained by using the log-rank test. N, The number of cases; Events, the number of cases, who had recurrent tumor or died during the follow-up period. P values were obtained by using the log-rank test. N, The number of cases; Events, the number of cases, who had recurrent tumor or died during the follow-up period.
Cox regression analyses of the various factors associated with PFS and OS in NPC patients.
| Variables | progression-free survival | overall survival | ||||
|---|---|---|---|---|---|---|
| HR | 95% CI | P | HR | 95% CI | P | |
| Gender (Female/Male) | 0.539 | 0.229-1.270 | 0.157 | 0.516 | 0.215-1.237 | 0.138 |
| Age (≤ 48/> 48) | 0.748 | 0.396-1.414 | 0.372 | 0.672 | 0.354-1.276 | 0.224 |
| Stage (I + II/ III + IV) | 2.028 | 0.684-6.015 | 0.202 | 2.289 | 0.815-6.430 | 0.116 |
| Metastasis No metastasis | 0.427 | 0.138-1.323 | 0.140 | 0.438 | 0.152-1.262 | 0.126 |
| HYOU1 (High/Low) | 2.602 | 1.295-5.225 | 0.007 | 2.507 | 1.251-5.022 | 0.010 |
Note: HR, hazard ratio; 95% CI, 95% confidence interval.
Discussion
As the traditional two-dimensional gel electrophoresis runs on different gels, the difference between gels is difficult to distinguish system error with sample difference, which limits its application. 2D-DIGE can isolate and analyze multiple samples on same piece of gel to eliminate systematic errors, which is particularly suitable in proteomics difference research. At the same time, 2D-DIGE technology adds a third fluorescent color as an internal standard, which can effectively reduce the system error and greatly improve the accuracy, reliability and reproducibility of quantitative results [21]. In this study, we obtained differentially expressed protein profiles by 2-D DIGE and MALDI-TOF/TOF-MS mass spectrometry technologies in NPC 5-8F cells before and after LPLUNC1 over-expression. Western blot and qRT-PCR were also applied to validate some differential proteins in mRNA level and protein level. The results were fully consistent with mass spectrometry, which indicated the accuracy and reliability of proteomics analysis.
In current study, 44 differentially expressed proteins were identified between 5-8F/LPLUNC1 and 5-8F/Vector NPC cells, which were mainly involved in molecular chaperone, cytoskeleton, metabolism and signal transduction. Among the identified proteins, stratifin (14-3-3σ), annexin I (ANXA1) and prohibitin that were frequently identified in quantitative proteomics were demonstrated to be associated with the progression of NPC [22], and may be regarded as the potential biomarkers of NPC [22, 23]. Stratifin, annexin I and prohibitin were significantly decreased in NPC, which were associated with the poor survival of NPC patients [19, 24, 25]. Up-regulated stratifin and annexin I can significantly suppress the capabilities of cell proliferation, adhesion, migration, and invasion in NPC cells, which also enhanced the radiosensitiza tion of NPC cells [26-28]. In addition, numerous studies have shown that stratifin, annexin I and prohibitin are aberrantly expressed in a wide spectrum of tumors, and their abnormal expressions play a crucial role in tumor growth and progression [23, 29, 30]. In our study, stratifin and annexin I and prohibitin were up-regulated by LPLUNC1, which might be involved in the inhibitory roles of LPLUNC1 in NPC. However, the possible mechanisms and intrinsic relationships of them should be further elucidated in NPC.
HYOU1 was identified as differentially expressed genes in NPC cells after overexpressing LPLUNC1 by proteomic techniques. It was studied that LPLUNC1 was highly expressed with nasopharyngeal tissue specificity [12]. In our previous study, we found that LPLUNC1 was down-regulated in NPC tissues, which might play as a potential tumor suppressor gene [13]. Over-expressed LPLUNC1 can repress proliferation of NPC cells, arrest the cells in G0/G1 stage, and induce cell apoptosis [14, 15]. This suggests that LPLUNC1 can inhibit the growth of NPC cells through regulating protein expressions of HYOU1. It is also shows HYOU1 may play important roles in the development of NPC.
HYOU1 protein is known as oxygen-regulated protein 150 (ORP150). Under hypoxia, ORP150 protein can be accumulated in the endoplasmic reticulum to protect cells from hypoxia interference, while inhibition of ORP150 expression can accelerate cell apoptosis [31]. It is reported that ORP150 protein was up-regulated in prostate cancer [32], bladder cancer [33] and breast cancer [16], colorectal cancer [17] and other tumors[34], and high expression of ORP150 was positively correlated with high invasion and poor diagnosis[18]. Over-expressed ORP150 protein can significantly inhibit the tumor cell apoptosis induced by anti-tumor drugs [31, 35], and promote the resistance of tumor cells to chemotherapy [21]. Decreased expression of HYOU1 can significantly inhibit proliferation of tumor cells and postpone tumor progression [32]. However, considering the current evidence, the role of HYOU1 expression in different tumors is unclear, also is unclear in NPC patients. In this study, we examined the relationship between alterations in HYOU1 expression and the prognosis of patients with NPC.
We found that the expression of HYOU1 was significantly increased in NPC tissues either in protein level or mRNA level, which positively correlated with the clinical stage and metastasis in NPC. The results suggested that HYOU1 played important roles in development and progression of NPC. Survival analysis showed over-expressed HYOU1 in NPC patients had poor prognosis, with a shorter PFS and OS. COX multivariate regression analysis showed high expressions of HYOU1 protein is an important biomarker associated with poor prognosis in NPC patients.
In summary, applying quantitative proteomics analysis, 44 differentially expressed proteins were identified to be regulated by LPLUNC1, among which 19 were up-regulated and 35 were down-regulated. Through regulating these differentially expressed proteins, LPLUNC1 may regulate the growth of NPC through participating in cell metabolism, proliferation, transcription and signal transduction , which provides valuable clues for further study of LPLUNC1 function. Based on further investigation, we found that HYOU1 was significantly up-regulated in NPC tissues. HYOU1 may be regarded as biomarkers of malignant progression and poor prognosis, even potential novel targets for diagnosis and treatment of NPC. However, the function of HYOU1 in NPC need to be further elucidated in vivo and in vitro.
Abbreviations
LPLUNC1: long palate, lung and nasal epithelium clone 1, NPC: nasopharyngeal carcinoma, 2-D DIGE: two-dimensional fluorescence difference gel electrophoresis , MALDI-TOF/TOF-MS/MS: matrix-assisted laser desorption/ionization time of flight mass spectrometry, HYOU1: Hypoxia up-regulated 1, ORP150: oxygen-regulated protein 150, PFS: progression-free survival, OS: overall survival.
Acknowledgements
This work was supported in part by grants from the following sources: the National Natural Science Foundation of China (81472595, 81472531, 81402006, 81171930, 81071644, 81172189, and 81101509); the Natural Science Foundation of Hunan Province (2015JJ2094); Development and Reform Commission of Hunan Province; the Science Foundation of Hunan Cancer Hospital (A2013-01).
Ethics Committee Approval and Patient Consent
This study was approved by the Joint Ethics Committee of the Central South University Health Authority and performed in accordance with national guidelines. Written informed consent was obtained from individual patients who participated in the study. We are committed to maintain the privacy of patients' information.
Conflict of Interest
We declare that we have no conflict of interest.
References
1. Wei WI, Sham JS. Nasopharyngeal carcinoma. Lancet. 2005;365:2041-54
2. Ng WT, Yuen KT, Au KH. et al. Staging of nasopharyngeal carcinoma-the past, the present and the future. Oral Oncol. 2014;50:549-54
3. Chang ET, Adami HO. The enigmatic epidemiology of nasopharyngeal carcinoma. Cancer Epidemiol Biomarkers Prev. 2006;15:1765-77
4. Gu AD, Zeng MS, Qian CN. The criteria to confirm the role of Epstein-Barr virus in nasopharyngeal carcinoma initiation. Int J Mol Sci. 2012;13:13737-47
5. Shen Y, Zhang S, Sun R. et al. Understanding the interplay between host immunity and Epstein-Barr virus in NPC patients. Emerg Microbes Infect. 2015;4:e20
6. Armstrong RW, Imrey PB, Lye MS. et al. Nasopharyngeal carcinoma in Malaysian Chinese: occupational exposures to particles, formaldehyde and heat. Int J Epidemiol. 2000;29:991-8
7. Xiong W, Zeng ZY, Xia JH. et al. A susceptibility locus at chromosome 3p21 linked to familial nasopharyngeal carcinoma. Cancer Res. 2004;64:1972-4
8. Zeng Z, Zhou Y, Zhang W. et al. Family-based association analysis validates chromosome 3p21 as a putative nasopharyngeal carcinoma susceptibility locus. Genet Med. 2006;8:156-60
9. Liao Q, Guo X, Li X. et al. Analysis of the contribution of nasopharyngeal epithelial cancer cells to the induction of a local inflammatory response. J Cancer Res Clin Oncol. 2012;138:57-64
10. Bingle CD, Seal RL, Craven CJ. Systematic nomenclature for the PLUNC/PSP/BSP30/SMGB proteins as a subfamily of the BPI fold-containing superfamily. Biochem Soc Trans. 2011;39:977-83
11. Bingle CD, Gorr SU. Host defense in oral and airway epithelia: chromosome 20 contributes a new protein family. Int J Biochem Cell Biol. 2004;36:2144-52
12. Bingle CD, Wilson K, Lunn H. et al. Human LPLUNC1 is a secreted product of goblet cells and minor glands of the respiratory and upper aerodigestive tracts. Histochem Cell Biol. 2010;133:505-15
13. Zhang B, Nie X, Xiao B. et al. Identification of tissue-specific genes in nasopharyngeal epithelial tissue and differentially expressed genes in nasopharyngeal carcinoma by suppression subtractive hybridization and cDNA microarray. Genes Chromosomes Cancer. 2003;38:80-90
14. Liao Q, Zeng Z, Guo X. et al. LPLUNC1 suppresses IL-6-induced nasopharyngeal carcinoma cell proliferation via inhibiting the Stat3 activation. Oncogene. 2014;33:2098-109
15. Yang Y, Liao Q, Wei F. et al. LPLUNC1 inhibits nasopharyngeal carcinoma cell growth via down-regulation of the MAP kinase and cyclin D1/E2F pathways. PLoS One. 2013;8:e62869
16. Stojadinovic A, Hooke JA, Shriver CD. et al. HYOU1/Orp150 expression in breast cancer. Med Sci Monit. 2007;13:BR231-239
17. Slaby O, Sobkova K, Svoboda M. et al. Significant overexpression of Hsp110 gene during colorectal cancer progression. Oncol Rep. 2009;21:1235-41
18. Kusaczuk M, Cechowska-Pasko M. Molecular chaperone ORP150 in ER stress-related diseases. Curr Pharm Des. 2013;19:2807-18
19. Liao Q, Guo X, Li X. et al. Prohibitin is an important biomarker for nasopharyngeal carcinoma progression and prognosis. Eur J Cancer Prev. 2013;22:68-76
20. Meng QW, Sun LC, Li M. et al. Increased Expression of Eps15 Homology Domain 1 is Associated with Poor Prognosis in Resected Small Cell Lung Cancer. J. Cancer. 2015;6:990-995
21. Shen SH, Gu LJ, Liu PQ. et al. Comparative proteomic analysis of differentially expressed proteins between K562 and K562/ADM cells. Chin Med J (Engl). 2008;121:463-8
22. Chen ZT, Liang ZG, Zhu XD. A Review: Proteomics in Nasopharyngeal Carcinoma. Int J Mol Sci. 2015;16:15497-530
23. Zeng GQ, Cheng AL, Tang J. et al. Annexin A1: a new biomarker for predicting nasopharyngeal carcinoma response to radiotherapy. Med Hypotheses. 2013;81:68-70
24. Cheng AL, Huang WG, Chen ZC. et al. Identification of novel nasopharyngeal carcinoma biomarkers by laser capture microdissection and proteomic analysis. Clin Cancer Res. 2008;14:435-45
25. Huang WG, Cheng AL, Chen ZC. et al. Targeted proteomic analysis of 14-3-3sigma in nasopharyngeal carcinoma. Int J Biochem Cell Biol. 2010;42:137-47
26. Feng XP, Yi H, Li MY. et al. Identification of biomarkers for predicting nasopharyngeal carcinoma response to radiotherapy by proteomics. Cancer Res. 2010;70:3450-62
27. Yang H, Zhao R, Lee MH. 14-3-3sigma, a p53 regulator, suppresses tumor growth of nasopharyngeal carcinoma. Mol Cancer Ther. 2006;5:253-60
28. Liu A, Huang W, Zeng G. et al. Expression of the Annexin A1 gene is associated with suppression of growth, invasion and metastasis of nasopharyngeal carcinoma. Mol Med Rep. 2014;10:3059-67
29. Biaoxue R, Xiguang C, Shuanying Y. Annexin A1 in malignant tumors: current opinions and controversies. Int J Biol Markers. 2014;29:e8-20
30. Theiss AL, Sitaraman SV. The role and therapeutic potential of prohibitin in disease. Biochim Biophys Acta. 2011;1813:1137-43
31. Gao YY, Liu BQ, Du ZX. et al. Implication of oxygen-regulated protein 150 (ORP150) in apoptosis induced by proteasome inhibitors in human thyroid cancer cells. J Clin Endocrinol Metab. 2010;95:E319-26
32. Miyagi T, Hori O, Koshida K. et al. Antitumor effect of reduction of 150-kDa oxygen-regulated protein expression on human prostate cancer cells. Int J Urol. 2002;9:577-85
33. Asahi H, Koshida K, Hori O. et al. Immunohistochemical detection of the 150-kDa oxygen-regulated protein in bladder cancer. BJU Int. 2002;90:462-6
34. Tian Y, Almaraz RT, Choi CH. et al. Identification of sialylated glycoproteins from metabolically oligosaccharide engineered pancreatic cells. Clin Proteomics. 2015;12:11
35. Namba T, Hoshino T, Tanaka K. et al. Up-regulation of 150-kDa oxygen-regulated protein by celecoxib in human gastric carcinoma cells. Mol Pharmacol. 2007;71:860-70
Author contact
![]() Corresponding authors: Zhaoyang Zeng and Guiyuan Li, Hunan Cancer Hospital and The Affiliated Cancer Hospital of Xiangya School of Medicine, Central South University, 283 Tongzipo Road, Changsha 410013, Hunan, China. Tel: 86-731-84805446 Fax: 86-731-8480-5383 Email: zengzhaoyangedu.cn, lgyedu.cn.
Corresponding authors: Zhaoyang Zeng and Guiyuan Li, Hunan Cancer Hospital and The Affiliated Cancer Hospital of Xiangya School of Medicine, Central South University, 283 Tongzipo Road, Changsha 410013, Hunan, China. Tel: 86-731-84805446 Fax: 86-731-8480-5383 Email: zengzhaoyangedu.cn, lgyedu.cn.