Impact Factor ISSN: 1837-9664

 Global reach, higher impact
J Cancer 2016; 7(3):335-343. doi:10.7150/jca.12943 This issue Cite
Research Paper
Incidence Patterns and Trends of non-Central Nervous System Solid Tumours in Children and Adolescents. A Collaborative Study of the Spanish Population Based Cancer Registries
Nerea Larrañaga1,2*, Mª José Sanchez3,2* ![]() , Eva Ardanaz4,5,2*, Saray Felipe6, Rafael Marcos-Gragera7, María Ramos8, Marià Carulla9, Mª Dolores Chirlaque10,2, Marcial V. Argüelles11, Carmen Martos2,12, Antonio Mateo13, Rafael Peris-Bonet6,14
, Eva Ardanaz4,5,2*, Saray Felipe6, Rafael Marcos-Gragera7, María Ramos8, Marià Carulla9, Mª Dolores Chirlaque10,2, Marcial V. Argüelles11, Carmen Martos2,12, Antonio Mateo13, Rafael Peris-Bonet6,14
1. Public Health Division of Gipuzkoa, Basque Health Department, Spain. Avda de Navarra 4, 20008-San Sebastian, Spain.
2. CIBER de Epidemiología y Salud Pública (CIBERESP), Spain.
3. Escuela Andaluza de Salud Pública. Instituto de Investigación Biosanitaria ibs.GRANADA. Hospitales Universitarios de Granada/Universidad de Granada, Granada, Spain.
4. Navarre Public Health Institute, Pamplona, Spain. C) Leyre 15, Pamplona, 31003, Spain.
5. Navarra Institute for Health Research (IdiSNA) Pamplona, Spain
6. Spanish Registry of Childhood Tumours (RTI-SEHOP), Spanish Society of Paediatric Haematology and Oncology, and University of Valencia, Valencia, Spain. Avda. Blasco Ibáñez, 15. 46010-Valencia.
7. Epidemiology Unit and Girona Cancer Registry (Oncology Coordination Plan). Department of Health, Autonomous Government of Catalonia, Catalan Institute of Oncology, Girona Biomedical Research Institute, Girona, Spain.
8. Registre de càncer de Mallorca. Direcció General de Salut Pública. Illes Balears, Spain.
9. Tarragona Cancer Registry, Fundació Lliga per a la Investigació i Prevenció del Càncer. IISPV, Reus. Spain.
10. Department of Epidemiology, Murcia Regional Health Authority, IMIB-Arrixaca Murcia, Spain.
11. Asturias Cancer Registry. Public Health Directorate, Asturias (Spain).
12. Instituto Aragonés de Ciencias de la Salud. Zaragoza, Spain.
13. Albacete Cancer Registry, Health and Social Welfare Authority, Castilla-La Mancha, Spain
14. RTICC-Spanish Cancer Research Network, ISCiii, RD12/0036/0053, Spain.
* contributed equally to this study.
Received 2015-6-12; Accepted 2015-11-11; Published 2016-1-10
Abstract
Objective: To describe incidence patterns and trends in children (0-14 years) and adolescents (15-19 age-range) with solid tumours, except those of central nervous system (CNS), in Spain.
Methods: Cases were drawn from eleven Spanish population-based cancer registries. Incidence was estimated for the period 1983-2007 and trends were evaluated using Joinpoint regression analysis.
Results: The studied tumour groups accounted for 36% of total childhood cancers and 47.6% of those diagnosed in adolescence with annual rates per million of 53.5 and 89.3 respectively. In children 0 to 14 years of age, Neuroblastoma (NB) was the commonest (7.8%) followed by Soft-tissue sarcomas (STS) (6.3%), bone tumours (BT) (6.2%) and renal tumours (RT) (4.5%). NB was the most frequently diagnosed tumour before the 5th birthday, while STS and BT were the commonest at 5-9 years of age, and BT and Carcinoma and other epithelial tumours (COET) at 10-14. COET presented the highest incidence in adolescents, followed by germ-cell tumours (GCT), BT and STS. These four diagnostic groups accounted for 94% of total non-CNS solid tumours, in adolescents. Overall incidence rates increased significantly in children up to 1996 with an annual percentage change (APC) of 2.6% (95%CI: 1.7; 3.6). NB and COET showed significant time trend (APCs: 1.4% and 3.8% respectively) while other tumour groups such as RT, STS, BT or GCT had no significant changes over time. A significant increase was present in NB under the age of 5 and in BT and STS in children aged 10-14 years. In adolescents there were significant increases for all tumours combined (APC=2.7; 95%CI: 1.8-3.6) and for STS, GCT and COET (APCs: 3.2%, 4.4% and 3.5% respectively), while other tumour groups such as hepatic tumours, BT or thyroid carcinomas showed a decreasing trend or no increase.
Conclusions: Overall, the incidence of the studied cancers in children increased along the period 1983-1996 with no posterior significant rise, while the incidence in adolescents increased significantly over the whole period 1983-2007. Several specific tumour groups showed significant rises or decrements in childhood or adolescence, although the small number of cases precludes showing significant trends or inflexion points.
Keywords: cancer, solid tumour, childhood, adolescents, population-based study, incidence, Spain.
Introduction
Childhood cancers represent around 0.53% of all cancers diagnosed in Spain in 2003-2007 (1) and yet it was the most common cause of disease-related death for children between 1-14 years of age in 2012 in Spain (2). A 0.3% of cancers are diagnosed in the adolescence (15-19 years) and the incidence is higher than that of childhood cancer (3).
The most common cancers in childhood are leukemia, tumors of the central nervous system (CNS) and lymphomas, but there are other solid tumors that represent one third of the cancers detected during childhood (4) and have not been previously described in detailed in Spain. Embryonal cancers that develop in childhood are very rare in adolescence and some solid tumours, typical in adults (e.g. thyroid cancer and melanoma) and rare in childhood, are more common in adolescents (3).
Solid tumour (except CNS) incidence rates in children have been increasing in the last decades in Spain (4). Similar pattern has been observed in Europe (5) except for retinoblastoma, hepatic and bone tumours and other and unspecified malignant neoplasms. The most recent data available in the United States of America (USA) for children and adolescents (6) shows an increasing trend in incidence for testicular Germ-cell tumours (GCT) and a plateau for bone tumours (BT), neuroblastoma (NB), Wilms tumour (WT), rhabdomyosarcoma (RMS), retinoblastoma and ovarian germ-cell tumours (GCT). Even when there is less information on cancer incidence in adolescents, there has been an increase in Europe over the last two decades of the twenty century, especially due to melanoma, thyroid cancer and GCT (3) and also in the USA (7) where the largest contributor to this increase has been GCT.
The aim of this study is to describe the latest trends in incidence with more detailed analysis on non-CNS solid tumours until 2007, following the publication on childhood cancer in Spain (4), and to describe the characteristics of these tumours in adolescents.
Materials and Methods
Eleven population-based cancer registries (Table 1a) participated in this study with children data and ten for adolescents. According to the 2001 census, the incidence data reported represents 31% of the Spanish population aged 0-14 years and 21% of the 15-19 years old population. The study period was 1983 to 2007, with a slightly different period for each area involved (Table 1a). All registries make periodic quality controls using international software (8). Data quality indicators presented for diagnostic validity are microscopic verification (MV), death certificate only (DCO) and unspecified histology (NOS). These indicators were calculated separately for two periods (1983-1992 and 1993-2007), cut point based on the inflection point observed in a previous analysis (4). The participating registries share uniform and standard data collection guidelines that have been described elsewhere (9). A case was defined as any child aged 0-19 years with a diagnosis of solid malignant tumour other than those of CNS, residing in the registration areas of the registries included in each analysis and incident in the corresponding period. Children will be considered all children less than 15 years of age and adolescents those aged 15 to 19 years. Spanish Registry of Childhood Tumours (RETI-SEHOP), with national coverage, was used to detect cases of cancer residing in the registration areas of the regional registries but cared for in other geographical areas. The International Classification of Diseases for Oncology (ICD-O) second (10) and third (11) editions were used for coding; all cases were converted into the third edition of the ICD-O and the International Classification of Childhood Cancer third edition (ICCC-3) (12) was used for defining diagnostic groups.
Indices of data quality of all cancers by registry in children (age 0-14 years) and adolescents (aged 15-19 years).
| Cancer Registry | Period | Children | Adolescents | ||||||
|---|---|---|---|---|---|---|---|---|---|
| N | %MV | %DCO | %NOS | N | %MV | %DCO | %NOS | ||
| Albacete | 1991-2007 | 156 | 92.9 | 0.6 | 1.3 | 91 | 93.4 | 1.1 | 0.0 |
| Asturias | 1983-2007 | 530 | 93.8 | 1.3 | 0.0 | 308 | 97.4 | 1.3 | 0.0 |
| Comunitat Valenciana | 1983-2007 | 2617 | 94.4 | 0.1 | 0.0 | - | - | - | - |
| Basque Country | 1986-2007 | 1128 | 93.3 | 0.6 | 0.4 | 606 | 96.5 | 0.0 | 0.5 |
| Girona | 1983-2007 | 353 | 95.8 | 0.6 | 1.1 | 167 | 93.4 | 2.4 | 2.4 |
| Granada | 1985-2007 | 467 | 95.9 | 0.2 | 0.0 | 276 | 97.1 | 0.7 | 0.0 |
| Mallorca | 1988-2005 | 296 | 93.6 | 0.0 | 1.4 | 169 | 99.4 | 0.0 | 0.0 |
| Murcia | 1983-2007 | 867 | 95.0 | 0.5 | 0.9 | 404 | 98.5 | 0.2 | 0.0 |
| Navarra | 1983-2007 | 341 | 94.1 | 0.9 | 0.0 | 197 | 95.4 | 1.5 | 0.0 |
| Tarragona | 1983-2007 | 383 | 96.6 | 0.5 | 0.0 | 210 | 95.7 | 1.0 | 0.0 |
| Zaragoza | 1983-2003 | 544 | 95.4 | 0.9 | 0.0 | 208 | 96.6 | 0.5 | 2.4 |
| All cancer registries | 1983-2007 | 7682 | 94.5 | 0.4 | 0.3 | 2636 | 96.7 | 0.7 | 0.5 |
We included groups IV to XII from the ICCC-3 for the whole period. Incidence rates were estimated for each diagnostic group, sex and age group (0, 1-4, 5-9, 10-14 and 15-19 years). Rates of children under 15 years were age standardized to the European (ASRe) and world (ASRw) standard populations using the direct method and expressed per million children and year. The population at risk was obtained from the Spanish Statistical Office and the statistical offices of the respective autonomous communities for Albacete, Girona, Mallorca, Granada, Tarragona and Zaragoza.
Five-year periods (1983-1987, 1988-1992, 1993-1997, 1998-2002 and 2003-2007) ASRe were estimated for trend analysis. A Joinpoint regression model was used to analyze the time-related trends for these tumours, applied to individual years of data. This made possible to estimate annual percentage change (APC) and to identify trend inflexion points when they could be detected (13). A maximum of one inflection point was allowed in each regression; 0.01 was added to all of the years in the data series for the dependent variable where a zero value was observed. For data analysis, version 4.1.1 of the Joinpoint Regression program was used (14).
Results
We included 3,992 cases of the nine ICCC-3 diagnostic groups, representing 38.7% of cancers diagnosed before the age of 20: 2,744 in children of 0 to 14 years and 1,248 in adolescents of 15 to 19 years. Quality of cancer registration is elevated, with high proportions of microscopically verified diagnoses in all registries, ranging from 92.9% to 100%. Overall, 94.5% of total cancers diagnosed in childhood and 96.7% in adolescents were based on MV (Table 1a) and MV was even higher for non-CNS solid tumours (Table 1b). MV reached 100% for STS and GCTs, carcinoma and other epithelial tumours (COET) and melanoma, whereas was lower for retinoblastoma (85.5% in the first period and 74.5% in the second) in children (Table 1b). In adolescents, COET presented the lowest microscopically verified percentage. The proportion of cases in the group of other and unspecified cancers was 0.4% and 0.8% of total cancers in children and adolescents respectively (Table 2).
Indices of data quality of non-CNS solid tumours by diagnostic group and period in children (age 0-14 years) and adolescents (aged 15-19 years).
| Diagnostic group* | Children | Adolescents | ||||||||||||||
|---|---|---|---|---|---|---|---|---|---|---|---|---|---|---|---|---|
| 1983-1992 | 1993-2007 | 1983-1992 | 1993-2007 | |||||||||||||
| N | %MV | %DCO | %NOS | N | %MV | %DCO | %NOS | N | %MV | %DCO | %NOS | N | %MV | %DCO | %NOS | |
| Sympathetic Nervous System Tumours | 220 | 97.7 | 0.5 | 0.0 | 382 | 97.6 | 0.0 | 0.0 | 9 | 100.0 | 0.0 | 0 | 13 | 100.0 | 0.0 | 0.0 |
| Retinoblastomas | 76 | 85.5 | 0.0 | 2.6 | 110 | 74.5 | 0.0 | 1.8 | - | - | - | - | - | - | - | - |
| Renal tumours | 127 | 99.2 | 0.0 | 0.8 | 218 | 95.9 | 0.5 | 0.5 | 5 | 100.0 | 0.0 | 0 | 16 | 100.0 | 0.0 | 0.0 |
| Hepatic tumours | 32 | 93.8 | 3.1 | 0.0 | 52 | 94.2 | 0.0 | 0.0 | 9 | 100.0 | 0.0 | 0 | 8 | 100.0 | 0.0 | 0.0 |
| Bone tumours | 188 | 98.9 | 0.5 | 0.0 | 291 | 98.3 | 0.0 | 0.7 | 92 | 93.5 | 4.3 | 1.1 | 131 | 98.5 | 0.0 | 0.0 |
| Soft-tissue sarcoma | 195 | 100.0 | 0.0 | 0.0 | 287 | 99.7 | 0.3 | 0.0 | 73 | 100.0 | 0.0 | 0 | 140 | 100.0 | 0.0 | 0.0 |
| Germ-cell tumours | 90 | 100.0 | 0.0 | 0.0 | 124 | 98.4 | 0.0 | 0.0 | 71 | 97.2 | 0.0 | 1.4 | 183 | 99.5 | 0.0 | 0.0 |
| Carcinoma and other epithelial tumours | 107 | 100.0 | 0.0 | 0.0 | 214 | 99.5 | 0.0 | 0.5 | 150 | 100.0 | 0.0 | 0 | 328 | 99.7 | 0.0 | 0.3 |
| Other and unspecified tumours | 17 | 64.7 | 5.9 | 0.0 | 14 | 57.1 | 0.0 | 0.0 | 9 | 63.6 | 22.2 | 0 | 11 | 63.6 | 9.1 | 9.1 |
| Non-CND solid tumours | 1052 | 97.4 | 0.4 | 0.3 | 1,692 | 96.2 | 0.1 | 0.4 | 419 | 97.3 | 1.4 | 0.5 | 842 | 99.0 | 0.1 | 0.2 |
* According to the International Classification of Childhood Cancer, Third Edition.
CNS: Central Nerous System; N: number of cases; MV: microscopic verification; DCO: death certificate only; (NOS): unspecified histology.
Annual cancer incidence rate (per million) in children (age 0-14 years) and adolescents (age 15-19 years) by age and ICCC diagnostic group. Spanish cancer registries 1983-2007. Both sexes.
| Children | Adolescents | |||||||||||||||
|---|---|---|---|---|---|---|---|---|---|---|---|---|---|---|---|---|
| Age Specific Rates | Crude Rate | |||||||||||||||
| N | % | 0 | 1-4 | 5-9 | 10-14 | ASRw | ASRe | M/F | N | % | Rate | M/F | ||||
| ALL CHILDHOOD CANCERS | 7,682 | 100 | 242.6 | 203.6 | 121.4 | 124.2 | 149.3 | 157.0 | 155.0 | 1.2 | * | 2,623 | 100 | 187.8 | 1.3 | * |
| IV Sympathetic Nervous System tumours | 602 | 7.8 | 82.0 | 22.0 | 3.5 | 1.2 | 11.7 | 14.6 | 13.9 | 1.1 | 22 | 0.8 | 1.6 | 1.0 | ||
| IV(a) Neuroblastoma | 593 | 98.5 | 81.3 | 21.9 | 3.3 | 1.1 | 11.5 | 14.5 | 13.7 | 1.1 | 12 | 54.5 | 0.9 | 1.0 | ||
| IV(b) Other SNS | 9 | 1.5 | 0.7 | 0.1 | 0.2 | 0.1 | 0.2 | 0.2 | 0.2 | 1.0 | 10 | 45.5 | 0.7 | 1.0 | ||
| V Retinoblastoma | 186 | 2.4 | 18.8 | 9.1 | 0.9 | 0.1 | 3.6 | 4.6 | 4.3 | 1.2 | 0 | 0.0 | 0.0 | 0.0 | ||
| VI Renal tumours | 345 | 4.5 | 21.1 | 15.5 | 4.1 | 1.0 | 6.7 | 8.1 | 7.7 | 1.0 | 21 | 0.8 | 1.5 | 1.3 | ||
| VI(a) Wilms tumours | 335 | 97.1 | 20.8 | 15.5 | 4.0 | 0.7 | 6.5 | 7.9 | 7.5 | 1.0 | 6 | 28.6 | 0.4 | 0.5 | ||
| VI(b) Renal carcinoma | 8 | 2.3 | 0.0 | 0.0 | 0.1 | 0.3 | 0.2 | 0.1 | 0.1 | 1.3 | 14 | 66.7 | 1.0 | 2.5 | ||
| VI(c) Unspecified | 2 | 0.6 | 0.3 | 0.0 | 0.0 | 0.0 | 0.0 | 0.1 | 0.1 | - | 1 | 4.7 | 0.1 | - | ||
| VII Hepatic tumours | 84 | 1.1 | 7.9 | 2.8 | 0.7 | 0.7 | 1.6 | 1.9 | 1.8 | 1.6 | * | 17 | 0.6 | 1.2 | 2.4 | |
| VII(a) Hepatoblastoma | 62 | 73.8 | 7.6 | 2.4 | 0.4 | 0.2 | 1.2 | 1.5 | 1.4 | 1.6 | 0 | 0.0 | 0.0 | 0.0 | ||
| VII(b) Hepatic carcinoma | 20 | 23.8 | 0.0 | 0.2 | 0.3 | 0.5 | 0.4 | 0.3 | 0.3 | 2.5 | 17 | 100.0 | 1.2 | 2.4 | ||
| VII(c) Hepatic carcinoma | 2 | 2.4 | 0.3 | 0.2 | 0.0 | 0.0 | 0.0 | 0.1 | 0.1 | 1.0 | 0 | 0.0 | 0.0 | - | ||
| VIII Malignant bone tumours | 479 | 6.2 | 0.7 | 3.1 | 7.8 | 16.0 | 9.3 | 8.2 | 8.5 | 1.1 | 223 | 8.5 | 16.0 | 1.9 | * | |
| VIII(a) Osteosarcoma | 205 | 42.8 | 0.0 | 0.6 | 2.7 | 7.9 | 4.0 | 3.4 | 3.6 | 1.0 | 107 | 48.0 | 7.7 | 2.1 | * | |
| VIII(c) Ewing sarcoma | 243 | 50.7 | 0.7 | 1.8 | 4.7 | 7.2 | 4.7 | 4.2 | 4.4 | 1.2 | 86 | 38.6 | 6.2 | 2.2 | * | |
| VIII(b,d) Other specifed | 21 | 4.4 | 0.0 | 0.3 | 0.3 | 0.6 | 0.4 | 0.4 | 0.4 | 1.7 | 20 | 9.0 | 1.4 | 1.0 | ||
| VIII(e) Unspecifed | 10 | 0.3 | 0.0 | 0.4 | 0.1 | 0.3 | 0.2 | 0.2 | 0.1 | 0.0 | 10 | 4.4 | 0.7 | 1.0 | ||
| IX Soft-tissue sarcoma | 482 | 6.3 | 15.2 | 11.7 | 8.4 | 7.8 | 9.4 | 9.8 | 9.7 | 1.2 | 213 | 8.1 | 15.2 | 1.3 | ||
| IX(a) Rhabdomyosarcoma | 286 | 59.3 | 6.9 | 9.6 | 5.4 | 2.9 | 5.6 | 6.1 | 5.9 | 1.3 | * | 45 | 21.1 | 3.2 | 3.1 | * |
| IX(b) Fibrosarcoma | 51 | 10.6 | 5.3 | 0.3 | 0.7 | 1.0 | 1.0 | 1.0 | 1.0 | 1.5 | 19 | 8.9 | 1.4 | 0.7 | ||
| IX(c) Kaposi sarcoma | 1 | 0.2 | 0.0 | 0.0 | 0.0 | 0.1 | 0.0 | 0.0 | 0.0 | - | 3 | 1.4 | 0.2 | - | ||
| IX(d) Other specifed | 103 | 21.4 | 2.0 | 1.3 | 1.6 | 2.8 | 2.0 | 1.9 | 1.9 | 1.0 | 127 | 59.6 | 9.1 | 1.2 | ||
| IX(e) Unspecifed | 41 | 8.5 | 1.0 | 0.5 | 0.7 | 1.0 | 0.8 | 0.8 | 0.8 | 0.6 | 19 | 8.9 | 1.4 | 0.7 | ||
| X Germ-cell tumours | 214 | 2.8 | 12.9 | 3.2 | 2.5 | 4.9 | 4.2 | 4.2 | 4.2 | 0.6 | * | 254 | 9.7 | 18.2 | 2.1 | * |
| X(a) Intracranial tumours | 44 | 20.6 | 2.3 | 0.3 | 1.0 | 0.8 | 0.9 | 0.8 | 0.8 | 1.8 | 16 | 6.3 | 1.1 | 4.3 | * | |
| X(b) Extracranial tumours | 40 | 18.7 | 7.6 | 0.9 | 0.1 | 0.2 | 0.8 | 1.0 | 0.9 | 0.4 | * | 14 | 5.5 | 1.0 | 3.7 | * |
| X(c) Gonadal germ-cell rumours | 123 | 57.5 | 2.3 | 1.9 | 1.4 | 3.6 | 2.4 | 2.3 | 2.3 | 0.5 | * | 189 | 74.4 | 13.5 | 3.2 | * |
| X(d) Gonadal carcinoma | 5 | 2.3 | 0.0 | 0.0 | 0.0 | 0.3 | 0.1 | 0.1 | 0.1 | 0.0 | 27 | 10.6 | 1.9 | 0.0 | ||
| X(e) Other and unspecifed | 2 | 0.9 | 0.7 | 0.0 | 0.0 | 0.0 | 0.0 | 0.1 | 0.05 | a | 8 | 3.1 | 0.6 | 1.0 | ||
| XI Carcinomas and other epithelial tumours | 321 | 4.2 | 2.0 | 1.5 | 3.6 | 12.3 | 6.2 | 5.3 | 5.6 | 0.7 | * | 478 | 18.2 | 34.2 | 0.5 | |
| XI(b) Thyroid carcinoma | 121 | 37.7 | 0.0 | 0.3 | 1.2 | 5.1 | 2.4 | 1.9 | 2.1 | 0.6 | * | 171 | 35.8 | 12.2 | 0.3 | |
| XI(c) Nasopharingeal carcinoma | 12 | 3.7 | 0.0 | 0.0 | 0.2 | 0.4 | 0.2 | 0.2 | 0.2 | 3.0 | 18 | 3.8 | 1.3 | 5.0 | * | |
| XI(d) Melanoma | 84 | 26.2 | 1.0 | 0.9 | 1.1 | 2.7 | 1.6 | 1.5 | 1.5 | 0.7 | 116 | 24.3 | 8.3 | 0.5 | ||
| XI(a,e,f) Other and unspecifed | 104 | 32.4 | 1.0 | 0.3 | 1.0 | 4.2 | 2.0 | 1.7 | 1.8 | 0.7 | 173 | 36.2 | 12.4 | 0.8 | ||
| XII Other and unspecified tumours | 31 | 0.4 | 2.3 | 0.8 | 0.2 | 0.5 | 0.6 | 0.7 | 0.6 | 1.6 | 20 | 0.8 | 1.4 | 2.3 | ||
| SOLID EXCEPT Central Nervous System | 2,744 | 35.7 | 162.9 | 69.6 | 31.7 | 44.6 | 53.3 | 57.3 | 56.3 | 1.0 | 1,248 | 47.6 | 89.3 | 1.1 | ||
* Sex ratio (M/F) significative (p<0.05).
ICCC: International Clasificacion of Chidhood Cancer third edition; ASR: age standardized rate (ARSw: with world pop. ASRe with european pop.)
Overall ASRe for solid tumours -except those of CNS- in childhood from 1983 to 2007 was 56.3 cases per million child-year, with the highest incidence among infants (162.9) and the lowest in the 5-9 years age group (31.7) (Table 2). The age specific rate for adolescents was 89.3 per million. No significant differences in the overall male to female (M/F) ASRe ratio in children and adolescents were observed for these tumours. In children, hepatic tumours and rhabdomyosarcoma presented higher incidence in males while incidence of GCT and thyroid carcinoma was higher in females. On the other hand, adolescent males presented higher incidence of BT, RMS, GCT and nasopharyngeal carcinoma.
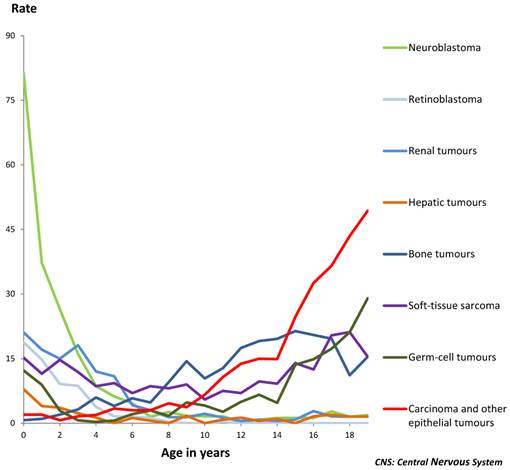
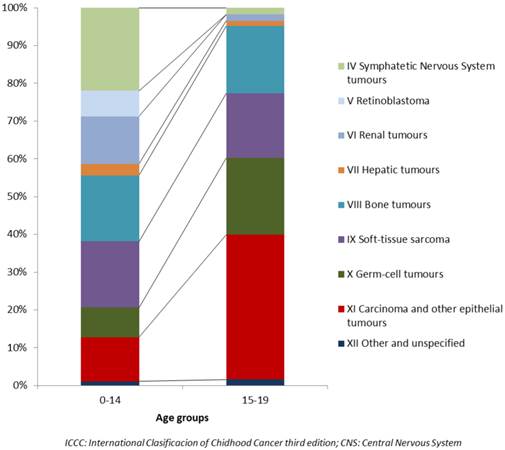
The commonest types of cancer among those included in this study in childhood were NB accounting for 7.7% of total childhood cancers (ASRe: 13.7) followed by STS (6.3%), BT (6.2%) and WT (4.4%) (Table 2). Rhabdomyosarcoma was the commonest STS, and Ewing sarcoma and osteosarcoma accounted for 93.5% of all BTs. By age groups, NB was the most frequently diagnosed tumour in infants and also before the 5th birthday, followed by Wilms tumour, STS and Retinoblastoma. STS and BT were the commonest at 5-9 years of age, and BT and COET at 10-14 (Figure 1). The different distributions in age specific rates of all nine ICCC-3 diagnostic groups can be seen in figure 1 and information on incidence can be found in table 2. The distribution of cancers that occurred among 15-19 year-olds was quite different from that of children (Figure 2). COET presented the highest incidence, followed by GCT, BT and STS. These four diagnostic groups accounted for 94% of total non-CNS solid tumours in adolescents. Among them, osteosarcoma and Ewing sarcoma were the most frequent BT, gonadal GCT were also the most frequent in the GCT group and other specified sarcomas were the commonest STS. Liver cancers are extremely rare in children and adolescents and presented the lowest incidence of these solid cancers. Hepatoblastomas resulted the most frequent in children under five and hepatic carcinoma over the age of 10. Incidence rates of embryonal cancers prevailing among young children decreased with age whereas solid tumours more frequent in adolescents presented very low incidence rates among the youngest children.
Age-specific incidence rates (per million) of non-CNS solid tumours by type of tumour, in children and adolescents. Period 1983-2007. Both sexes.
Relative frequencies (%) of the 9 ICCC groups of Solid tumours, except CNS, in children and adolescents. Period 1983-2007. Both Sexes
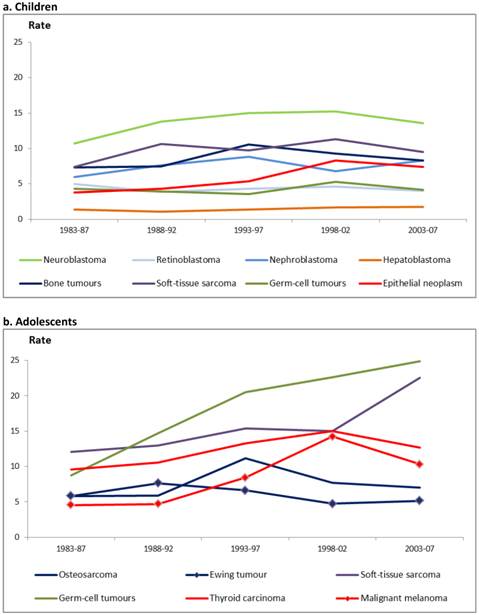
Overall childhood non-CNS solid tumours incidence time trends showed significant increases over the period study with an APC of 2.6 (CI: 1.7; 3.6) up to 1996 (CI: 1993-2001) and no significant increases afterwards. There was also an APC of 2.7% (CI: 1.4; 4.0) up to 1998 (CI: 1990-2001) in children under 5 years of age. Significant increase was observed all along the period in children aged 10-14 years and adolescents with APCs of 1.6% (CI: 0.7; 2.6) and 2.7% (CI: 1.8; 3.6) respectively (data not shown). The evolution of incidence by three years period and tumour can be seen in figure 3. It can be observed an increasing trend up to the period 1998-2002 for NB and GCT in children and for GCT and STS in adolescents up to the last period (2003-2007). Among the studied tumours, NB and the group of COET presented a significant trend in children, with APCs of 1.4% and 3.8% respectively. Other ICCC-3 groups such as renal or STS, BT or GCT showed no significant changes over time. In adolescents there were significant increases in STS, GCT and COEFT with APCs of 3.2%, 4.4% and 3.5% respectively and in all subcategories of these groups (Table 3).
Age-standardized incidence rates (per million) of non-Central Nervous System solid tumours in children (age 0-14 years)(3a) and adolescents (age 15-19 years)(3b) by type of tumour. Period 1983-2007. Both sexes.
Number of cases (N) and annual percentage change (APC) in incidence rates of non-CNS solid tumours in children (age 0-14 years) and adolescents (age 15-19 years) by ICCC diagnostic groups. Period 1983-2007. Both sexes.
| Diagnostic groups | Children | Adolescents | ||
|---|---|---|---|---|
| N | APC | N | APC | |
| Neuroblastoma (IVa) | 593 | 1.4 (0.1; 2.7) | - | - |
| Retinoblastoma (V) | 186 | -0.2 (-2.2; 1.9) | - | - |
| Renal Tumours (VI) | 345 | 1.4 (-0.1; 2.9) | 21 | 0.3 (-2.5; 3.2) |
| Wilms tumours (VIa) | 335 | 1.3 (-0.2; 2.8) | 6 | - |
| Hepatic Tumours (VII) | 84 | 0.3 (-3.0; 5.6) | 17 | 2.4 (-0.3; 5.3) |
| Hepatoblastoma (VIIa) | 62 | -0.2 (-3.4; 3.2) | - | - |
| Bone Tumours (VIII) | 479 | 1.0 (-0.6; 2.7) | 223 | -0.9 (-2.9; 1.1) |
| Osteosarcoma (VIIIa) | 205 | 1.1 (-1.0; 3.2) | 107 | -0.4 (-2.5; 1.8) |
| Ewing tumours (VIIIc) | 243 | 1.7 (-1.1; 3.2) | 86 | -1.0 (-2.7; 0.7) |
| Soft-tissue sarcoma (IX) | 482 | 1.1 (-0.2; 2.3) | 213 | 3.2 (1.1; 5.3) |
| Rhabdomyosarcoma (IXa) | 286 | 0.1 (-1.8; 1.9) | 45 | 3.2 (0.2; 6.2) |
| Soft tissue Sarcoma no RMS (IXb-e) | 155 | 2.8 (0.5; 5.1) | 168 | 3.3 (1.0; 5.6) |
| Germ-cell tumours (X) | 214 | 0.6 (-1.2; 2.5) | 254 | 4.4 (2.1; 6.9) |
| Epitelial neoplasms and melanoma (XI) | 321 | 3.8 (2.0; 5.7) | 478 | 3.5 (2.1; 4.9) |
| Thyroid carcinoma (XIb) | 121 | 3.0 (-0.4; 6.6) | 171 | 1.8 (-0.4; 4.0) |
| Malignant melanoma (XId) | 84 | 5.2 (2.4; 8.1) | 116 | 5.9 (2.6; 9.3) |
CNS: Central Nervous System; ICCC: International Clasificacion of Chidhood Cancer third edition.
Discussion
Grouping all childhood cancer together may be helpful to understand the overall cancer burden in a population, but it masks the contributions of each tumour type. Therefore, this paper focuses on specific histological groups that are not the most frequent in childhood but represent one third of the incidence altogether and almost half of all cancer diagnosed in adolescents. The incidence rates estimated are derived from most of the data available from the population-based cancer registries of Spain, which covers almost one third of the Spanish population. Even so, the small number of cases for some of the tumours studied hinders the interpretation of data. Therefore and although we cannot ignore the fact that some changes in the incidence have actually occurred, these did not achieve statistical significance due to the study size.
Neuroblastoma is the most common childhood cancer diagnosed during the first year of life. Its incidence has increased in childhood, particularly in the youngest (0-4 years old). Some increases have been described, particularly in the first year of life (15), in Europe. Incidence rates are similar to the ones reported internationally in Southern Europe (16, 17), higher than those in USA (6) and UK (18) and lower than the ones for Australia (19). The improvement in diagnostic techniques may have contributed to the perceived increase of incidence, but the detection of latent or asymptomatic tumours, especially in very young children, has uncovered tumours that might have not otherwise been diagnosed (20).
Retinoblastoma incidence has been stable in the study period with a rate similar to that of France, UK and Italy (16, 17, 18) and higher to that of USA and Australia (6, 19). Intraocular retinoblastoma is a highly curable malignancy and current treatments are aimed to preserve vision (21, 22). This could explain the lower percentage of MV in the most recent period.
Renal tumours incidence, and Wilms tumour (WT), the most frequent in this group, presented non statistical significance increase in the age group 0-5 years. Incidence described in Italy, USA and Australia (17, 19, 23) was similar to the Spanish one.
The two main malignant hepatic tumours in children are hepatoblastoma and hepatocellular carcinoma. Incidence rates observed in this study were close to the figures reported by Lacour et al (16) for France and Germany (24) in 2000-2004 and slightly higher than those of USA and Switzerland.
The total incidence of malignant bone tumours in childhood, the increasing incidence with age and the sex ratio close to one were similar to that reported in other countries (17, 25). But contrary to most countries figures, in our study, the most common malignant bone tumours in children was Ewing sarcoma (not osteosarcoma) before the age of 10. This different distribution could be due to changes in registration practice or diagnostic improvement, but it is in fact also present in more recent data available from the Spanish Registry of Childhood Tumours which comes directly from the pediatric oncologists, so presently we cannot give a clear explanation for this phenomenon. A significant increase in incidence was observed for bone tumours only at age 10-14 years over the study period, with no significant increases in all other age groups. These incidence changes may reflect random variation, better diagnostic procedures or changes in unknown risk factors, and therefore highlight the need for more research into the etiology of childhood cancer (19).
Soft-tissue sarcomas are a heterogeneous group of neoplasms developing from mesenchymal cells at any site in the body. Neoplasms are categorized in two broad groups: RMS and non-RMS. ASRw for childhood in Spain was similar to those observed in Italy 2003-2008 (17), France (26) and Australia (19). Overall STS incidence increased over time, statistically significant only in the oldest age group, especially in adolescents. This increase was consistent with those observed in the SEER Program of the USA (23) and Europe (26) in previous periods. Advances in laboratory techniques have allowed better characterization of the soft-tissue sarcomas, which could contribute to explain temporal trends of incidence (as well as, perhaps, misclassification).
Germ-cell tumours, showed age specific rates lower to those reported by France (16). The incidence was higher in infants, with a rate of 12.2, and it decreased with age, thus being the lowest rate in the 5-9 year-old group. GCT was more frequent in girls during childhood and in boys during adolescence, as in other countries (6, 16).
Different entities were included in the group of carcinomas and other epithelial tumours. Thyroid carcinoma is the most frequent tumour, similar to Italy (17). As it happens in other countries such as in Italy or France (16), in Spain thyroid carcinomas were more frequent in girls. Malignant melanoma is also more frequent in girls, similarly to most European countries (27), although as it happens in our study, gender difference did not reach statistical significance. The 10-14 year-old group showed the highest incidence in children, which continued rising up until adolescence, but yet this was lower than that reported in Europe (27) and also in more recent data from Italy, and was similar to France. The significant increase of this cancer was higher than that observed in Italy, and showed significant increases not only in adolescents but also in children, unlike for other European countries. More recent data from USA (28) have shown a significant decrease in melanoma in population less than 20 years of age, except in the south where an increase in children and adolescent has been observed. Exposure to ultraviolet radiation has increased over the past decades and could explain part of the incidence of adolescent melanoma, but does not reveal much about the risk factors for child melanoma, which has also increased in Spain. The increasing trend of melanoma incidence observed in this study may be part of a mixture of increasing exposure to risk factors combined with improved surveillance.
Conclusion
Overall childhood cancer included in this study showed an increasing trend in incidence along the period 1983-1996, with no posterior significant rise, while the incidence in adolescents increased significantly over the whole period. The increasing trend observed up to 1998 for NB in children under 5 years of aged, due possible to improving diagnostic methods, could explain, part of the phenomenon. On the other hand, increasing risk of STS in older children and adolescents, as well as skin melanoma might explain the increasing trend all along the period, in population older than 10 years. Several specific tumours showed significant rises or decrements, and it should be highlighted that although there has been an increase in the incidence of some other tumours, this did not achieve statistical significance due to the small number of cases involved. The results of the analysis performed in this paper give a descriptive shot of some rare cancers from the Spanish children and adolescents. It points out the relevance of using population-based cancer registries to identify differences in incidence that could be related to risk factors or the management of the process of the disease. Cancer registries are extremely valuable surveillance tools and provide useful and reliable information for research and planning (29). Centralization of diagnostic procedures such as histopathology and molecular biology, for some rare neoplasm of this heterogeneous group could also contribute to improve the quality of diagnosis. Our study highlights the need for continuous surveillance of these cancers, to enable correct interpretation of time trends.
Acknowledgements
FIS (PI 061742); Fundació Enriqueta Villavecchia; Ministerio de Sanidad, Servicios Sociales e Igualdad; Public Health Research Centre (CSISP), Valencia; Consortium for Biomedical Research in Epidemiology & Public Health (CIBERESP); Spanish Cancer Research Network (RTICC) (RD 12/0036/0053). We would like to thank to Begoña Martinez for reviewing and editing the English text.
The Spanish Childhood Cancer Epidemiology Working Group for this study includes the cancer registries of Albacete (E Almar), Asturias (JR Quirós), Basque Country (M de la Cruz, MC Tobalina), Childhood Cancer Registry of the Comunitat Valenciana (E Pardo), Girona (L Vilardell), Granada (E Molina, DY Chang), Mallorca (P Franch), Murcia (C Navarro, D Salmerón), Navarra (E San Román, R Burgui), Tarragona (J Galceran), Zaragoza (B Adiego) and the Spanish Registry of Childhood Tumours (RETI-SEHOP).
Competing interests
The authors declare no conflicts of interest.
References
1. Forman D, Bray F, Brewster DH, et al. Cancer Incidence in Five Continents, Vol X; [electronic version. CIVC 2013]. http://ci5.iarc.fr
2. Death statistics according to Cause of Death. Spanish National Statistics Institute. http://www.ine.es/jaxi/menu.do?type=pcaxis&path=%2Ft15%2Fp417&file=inebase&L=1
3. Stiller CA, Desandes E, Danon SE. et al. Cancer incidence and survival in European adolescents (1978-1997). Report from the Automated Childhood Cancer Information System project. Eur J Cancer. 2006;42(13):2006-2018
4. Peris-Bonet R, Salmeron D, Martinez-Beneito MA. et al. Childhood cancer incidence and survival in Spain. Ann Oncol. 2010;21(Suppl 3):iii103-iii110
5. Kaatsch P, Steliarova-Foucher E, Crocetti E, Magnani C, Spix C, Zambon P. Time trends of cancer incidence in European children (1978-1997): Report from the Automated Childhood Cancer Information System project. European Journal of Cancer. 2006;42(13):1961-1971
6. Ward E, DeSantis C, Robbins A, Kohler B, Jemal A. Childhood and adolescent cancer statistics 2014. CA Cancer J Clin. 2014;64(2):83-103
7. Ries L, Smith MA, Gurney JG. et al. Cancer Incidence and Survival among Children and Adolescents: United States SEER Program 1975-1995. Bethesda, MD. 1999
8. DEPedits ver 1.0 [computer program]. Lyon: Descriptive Epidemiology Group. IARC. 2006
9. Navarro C, Martos C, Ardanaz E. et al. Population-based cancer registries in Spain and their role in cancer control. Ann Oncol. 2010;21(Suppl 3):iii3-13
10. Percy C, Van Holten V, Muir C. International Classification of Diseases for Oncology, Second Edition.Geneve, World Health Organization. 1990.
11. Fritz A, Percy C, Jack A. et al. International Classification of Diseases for Oncology, Third Edition. Geneve, World Health Organization. 2000
12. Steliarova-Foucher E, Stiller C, Lacour B, Kaatsch P. International Classification of Childhood Cancer, third edition. Cancer. 2005;103(7):1457-1467
13. Kim H, Fay M, Feuer EJ, Midthune DN. Permutation tests for joinpoint regression with applications to cancer rates. Stat Med. 2000; 19: 335-351 (correction. 2001;20:655 )
14. National Cancer Institute-Statistical Research and Applications Branch. Joinpoint Regression Program, Version 4.1.1. Statistical Research and Applications Branch,National Cancer Institute. 2014
15. Spix C, Pastore G, Sankila R, Stiller CA, Steliarova-Foucher E. Neuroblastoma incidence and survival in European children (1978-1997): report from the Automated Childhood Cancer Information System project. Eur J Cancer. 2006;42(13):2081-2091
16. Lacour B, Guyot-Goubin A, Guissou S, Bellec S, Desandes E, Clavel J. Incidence of childhood cancer in France: National Children Cancer Registries, 2000-2004. Eur J Cancer Prev. 2010;19(3):173-181
17. AIRTUM. Italian cancer figures, report 2012: Cancer in children and adolescents. Epidemiol Prev. 2013;37(Suppl 1):1-225
18. Childhood cancer incidence statistics; 2014. Cancer Research UK. http://www.cancerresearchuk.org/cancer-info/cancerstats/childhoodcancer/incidence/childhood-cancer-incidence-statistics#Dxgroups
19. Baade PD, Youlden DR, Valery PC. et al. Trends in incidence of childhood cancer in Australia, 1983-2006. Br J Cancer. 2010;102(3):620-626
20. Park JR, Eggert A, Caron H. Neuroblastoma: biology, prognosis, and treatment. Hematol Oncol Clin North Am. 2010;24(1):65-86
21. Chantada G, Schaiquevich P. Management of Retinoblastoma in Children: Current Status. Paediatr Drugs. 2015;17(3):185-98
22. Chawla B, Jain A, Azad R. Conservative treatment modalities in retinoblastoma. Indian J Ophthalmol. 2013;61(9):479-485
23. American Cancer Society. Childhood Cancer; Global Cancer Facts & Figures; 2nd ed. Atlanta. 2011:34-36
24. Kaatsch P, Spix C. Annual report 2005 (1980-2004), German Childhood Cancer Registry. Institut für Medizinische Biometrie, Epidemiologie und Informatik, Mainz. 2006
25. Stiller CA, Bielack SS, Jundt G, Steliarova-Foucher E. Bone tumours in European children and adolescents, 1978-1997. Report from the Automated Childhood Cancer Information System project. European Journal of Cancer. 2006;42(13):2124-2135
26. Pastore G, Peris-Bonet R, Carli M, Martinez-Garcia C, de Toledo JS, Steliarova-Foucher E. Childhood soft-tissue sarcomas incidence and survival in European children (1978-1997): Report from the Automated Childhood Cancer Information System project. European Journal of Cancer. 2006;42(13):2136-2149
27. de Vries E, Steliarova-Foucher E, Spatz A, Ardanaz E, Eggermont AMM, Coebergh JWW. Skin cancer incidence and survival in European children and adolescents (1978-1997). Report from the Automated Childhood Cancer Information System project. European Journal of Cancer. 2006;42(13):2170-2182
28. Siegel DA, King J, Tai E, Buchanan N, Ajani UA, Li J. Cancer Incidence Rates and Trends Among Children and Adolescentes in the United States, 2001-2009. Pediatrics. 2014;134(4):e945-e955
29. Steliarova-Foucher E, Stiller C, Colombet M, Kaatsch P, Zanetti R, Peris-Bonet R. Registration of childhood cancer: Moving towards pan-European coverage? Eur J Cancer. 2015;51(9):1064-1079
Author contact
![]() Corresponding author: Mª José Sanchez, Directora del Registro de Cáncer de Granada, Escuela Andaluza de Salud Pública, Campus Universitario de Cartuja, Cuesta del Observatorio 4, 18080 Granada, Spain. Tel: +34-958-027400; Fax: +34-958-027503; E-mail: mariajose.sanchez.easpes.
Corresponding author: Mª José Sanchez, Directora del Registro de Cáncer de Granada, Escuela Andaluza de Salud Pública, Campus Universitario de Cartuja, Cuesta del Observatorio 4, 18080 Granada, Spain. Tel: +34-958-027400; Fax: +34-958-027503; E-mail: mariajose.sanchez.easpes.