Impact Factor ISSN: 1837-9664

 Global reach, higher impact
J Cancer 2016; 7(1):69-79. doi:10.7150/jca.12722 This issue Cite
Research Paper
Capture and Identification of Heterogeneous Circulating Tumor Cells Using Transparent Nanomaterials and Quantum Dots-Based Multiplexed Imaging
Yuan-Yuan Chen1, Bo-Ran Cheng1, Zhao-Bo He2, Shu-Yi Wang1, Zhen-Meng Wang1, Min Sun1, Hai-Bin Song1, Yuan Fang1, Fang-Fang Chen1, Bin Xiong1 ![]()
1. Department of Oncology, Zhongnan Hospital of Wuhan University; Hubei Key Laboratory of Tumor Biological Behaviors & Hubei Cancer Clinical Study Center; Wuhan, Hubei, 430071, P. R. China;
2. Key Laboratory of Artificial Micro- and Nano-Structures of Ministry of Education, School of Physics and Technology, Wuhan University, Wuhan, Hubei, China
Received 2015-5-17; Accepted 2015-9-26; Published 2016-1-1
Abstract
Background: Capture and identification of circulating tumor cells (CTCs) in the blood system can help guide therapy and predict the prognosis of cancer patients. However, simultaneous capture and identification of CTCs with both epithelial and mesenchymal phenotypes remains a formidable technical challenge for cancer research. This study aimed at developing a system to efficiently capture and identify these CTCs with heterogeneous phenotypes using transparent nanomaterials and quantum dots (QDs)-based multiplexed imaging.
Methods: Hydroxyapatite-chitosan (HA-CTS) nanofilm-coated substrates were modified based on our previous work to increase the capture efficiency of cancer cell lines by extending baking and incubating time. QDs-based imaging was applied to detect cytokeratin, epithelial cell adhesion molecule (EpCAM), and vimentin of cancer cells to demonstrate the feasibility of multiplexed imaging. And QDs-based multiplexed imaging of CD45, cytokeratin and vimentin was applied to detect CTCs from different cancer patients that were captured using HA-CTS nanofilm substrates.
Results: Comparisons of the capture efficiencies of cancer cells at different baking time of film formation and incubating time of cell capture revealed the optimal baking and incubating time. Optimal time was chosen to develop a modified CTCs capture system that could capture EpCAM-positive cancer cells at an efficiency > 80%, and EpCAM-negative cancer cells at an efficiency > 50%. QDs-based imaging exhibited comparable detection ability but higher photostability compared to organic dyes imaging in staining cells. In addition, QDs-based multiplexed imaging also showed the molecular profiles of cancer cell lines with different phenotypes well. The integrated CTCs capture and identification system successfully captured and imaged CTCs with different sub-phenotypes in blood samples from cancer patients.
Conclusion: This study demonstrated a reliable capture and detection system for heterogeneous CTCs that combined enrichment equipment based on HA-CTS nanofilm substrates with QDs-based multiplexed imaging.
Keywords: Circulating tumor cells, epithelial, mesenchymal, hydroxyapatite-chitosan, quantum dots.
Introduction
Recurrence and metastases are the most common causes of cancer-related deaths [1-2]. Circulating tumor cells (CTCs), which escape from primary tumors and invade into the blood system, are proved to be closely related to tumor recurrence and metastases [1, 3-5]. It has been well demonstrated that the detection of CTCs is a sensitive and convenient method to guide individual therapy, predict prognosis, and monitor progression [6-8]. However, the effective capture of rare CTCs from a complex blood system is still a major challenge for the oncology community. Previous efforts attempted to develop various CTCs capture systems including immunoaffinity enrichment and physical enrichment [9-12], which powerfully promoted CTCs research.
Immunoaffinity enrichment is one of the most common techniques for CTCs capture and detection. This technique primarily applies specific epithelial markers that are widely expressed in most solid tumors (e.g., epithelial cell adhesion molecule [EpCAM] and cytokeratin [CK]) to capture and identify CTCs in complex blood samples using several methods, such as immune-magnetic approaches [10, 11, 13], microfluidic systems [14-16] and nanomaterials conjugated with anti-EpCAM capturing technologies [17, 18]. These epithelial markers-based capture systems have achieved remarkable improvements in the capturing of CTCs from cancer patient's blood samples. However, much evidence has demonstrated that epithelial-mesenchymal transition (EMT) occurs during the process of tumor progression, which leads to the enhanced invasive and metastatic capacities of tumors [19-22]. During this process, tumor cells partially or completely lose their epithelial characteristics (e.g. EpCAM and CK) and acquire mesenchymal phenotypes (e.g. twist, vimentin and snail), which increase tumor cell plasticity, so as to easily escape from the primary tumor into blood [23]. Therefore, epithelial markers-based CTCs capture systems would fail to detect those CTCs with mesenchymal phenotype.
Traditional organic fluorescent dyes are frequently employed to label antibodies and identify isolated CTCs from peripheral blood. However, this imaging technique is only available to obtain information of a single biomarker at one time [24]. The simultaneous acquisition of multiple information of CTCs with epithelial and mesenchymal phenotypes in situ is a formidable challenge for traditional imaging technique [24]. Therefore, alternative improved imaging technique is urgently needed in this field to help us simultaneously gather of multi-dimensional information of CTCs with epithelial and mesenchymal phenotypes. Quantum dots (QDs), novel fluorescent nanoparticles with unique size and surface effects, have been widely used in the biological imaging [24-26]. Compared with traditional organic dyes, QDs have higher fluorescence intensity, more stable against photobleaching and chemical degradation, size-tunable emission wavelength properties, which make them suitable for multiplexed imaging [24, 27].
Our previous studies introduced a good biocompatibility and high efficiency nanostructured CTCs capture system that was composed of transparent hydroxyapatite-chitosan (HA-CTS) composite nanofilm [28, 29]. This study modified the reaction conditions to increase the capture ability of CTCs with epithelial and mesenchymal phenotypes, especially for mesenchymal phenotype. In order to detect heterogeneous CTCs, QDs-based multiplexed imaging of CK (a specific marker of epithelial CTCs), vimentin (a specific marker of mesenchymal CTCs), and CD45 (a specific marker of white blood cells [WBCs]) was applied to replace traditional organic dyes imaging and detect heterogeneous CTCs in localized and metastatic cancer patients.
Materials and methods
Fabrication and modification of HA-CTS nanofilm-coated substrates
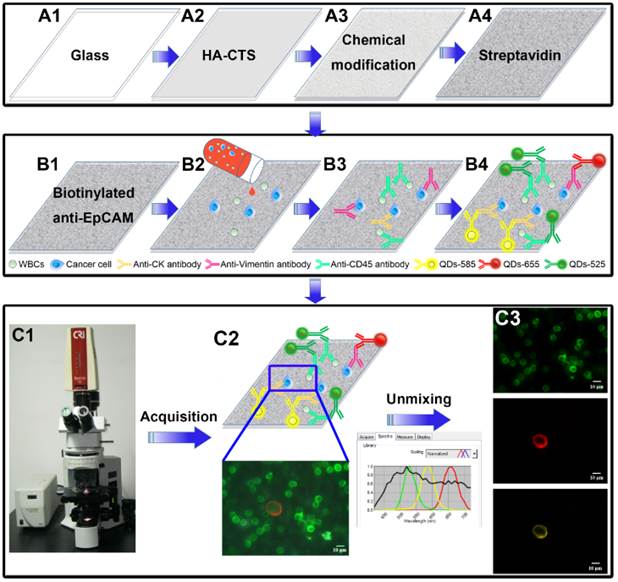
The fabrication and modification of transparent HA-CTS nanofilm-coated substrates were described previously [28, 29]. Briefly, the following processes were used: glass cleaning → HA-CTS nanofilm coating → baking → washing → drying → 3-mercaptopropyl-trimethoxysilane → washing → 4-maleimidobutyric acid N-hydrosuccinimide ester → washing → streptavidin (Fig. 1A1→A4). For fabrication, the transparent glass was cleaned by soaking in an H2SO4/H2O2 solution (3:1 volume/volume) at 100°C for 1 h, treated with oxygen plasma for 2 min, and dried using nitrogen gas. HA powder (Sigma-Aldrich, USA) was continuously milled using a planetary ball mill for 24 h to control the size of HA particles to 100-200 nm. Then, HA (0.5 g) and CTS (0.2 g) powder (Haisheng Co., Ltd, China) were completely dissolved into 10 mL distilled water containing 2% acetic acid by continuously stirring with a magnetic stirrer for 12 h. The solution was uniformly smeared on the processed glass using a photoresist spinner at 10000 r/h for 1 min. Subsequently, the HA-CTS nanofilm-coated glass was baked for different time and soaked in a 10% sodium hydroxide solution for 10 h to prepare HA-CTS nanofilm substrate. Finally, the HA-CTS nanofilm substrate was washed 3 times with deionized water, dried and stored at room temperature. For chemical modification, the prepared HA-CTS nanofilm substrate was cut into chips with a size of 1×1 cm2 and soaked in 4% 3-mercaptopropyl-trimethoxysilane (Sigma-Aldrich, USA) for 1 h and washed 3 times with anhydrous ethanol and dimethylsulfoxide. Then, the HA-CTS nanofilm substrate was treated with the coupling agent 4-maleimidobutyric acid N-hydrosuccinimide ester (Sigma-Aldrich, USA) for 45 min at room temperature. After washing with dimethylsulfoxide and phosphate-buffered saline (PBS), the HA-CTS nanofilm substrate was incubated with streptavidin (dilution 1:20, 85878, Sigma-Aldrich, USA) overnight at 4°C for standby application.
Design and major technological processes of this study. Fabrication and modification of HA-CTS nanofilm substrate (A1→A4). Capture and detection of CTCs by transparent HA-CTS nanofilm substrate and QDs-based multiplexed imaging (B1→B4). Image acquisition and unmixing by CRi Nuance software (C1→C3).
Cell culture and climbing
EpCAM high-expression cell lines (MCF7 and PC3), a low-expression cell line (A549) and null-expression cell lines (MDA-MB231, HeLa, DU145 and HepG2) were used in this study [23, 30]. These cell lines were preserved in cancer center of the Hubei Key Laboratory of Tumor Biological Behaviors. All cell lines were cultured in Dulbecco's modified eagle's medium (DMEM, hyclone, USA) supplemented with 10% fetal calf serum at 37°C in a 5% CO2 atmosphere. Cell lines in logarithmic growth phase were digested using 0.25% trypsin and diluted into cell suspensions at a concentration of 3×10⁵/mL with DMEM. Cell suspensions (3 mL) were added to clean cover glasses in germfree 12-well plates and incubated for 2 days at 37°C in a 5% CO2 atmosphere to produce cell climbing.
Blood samples treatment
Blood samples of healthy donors and cancer patients were obtained from Zhongnan Hospital of Wuhan University. Blood sample (1 mL) was collected from each subject in tube containing EDTA anti-coagulant. Samples were diluted with 1 mL PBS and slowly added to a 10 mL centrifuge tube containing 2 mL lymphocyte separation (LTS 1077, China). Then, the diluted blood sample was centrifuged at 1800 r/min for 30 min. The middle layer containing peripheral blood mononuclear cells was aspirated into a new centrifuge tube and centrifuged at 2000 r/min for 10 min. After removing supernatant, the sediment was suspended with 1 mL PBS to prepare the cell suspension. Finally, the prepared cell suspension was added to a 1×1 cm2 transparent substrate chamber for CTCs capture. This study was approved by the institutional approval board of Zhongnan Hospital of Wuhan University, and performed according to the ethical standards of the World Medical Association Declaration of Helsinki.
Cell capture
The prepared HA-CTS nanofilm substrates were washed 3 times with PBS to remove unconnected streptavidin and incubated with a biotinylated anti-EpCAM monoclonal antibody (dilution 1:10, BAF 960, R&D systems, USA) at room temperature for 2 h in a 1×1 cm2 chamber before cancer cells capture. Then, cell suspensions (1 mL) were added to the chambers and incubated at 37°C for different time to capture cancer cells. Then, the substrates in the chamber were gently washed 3 times using PBS and fixed in 4% paraformaldehyde (PFA) for 10 min. Subsequently, Triton X-100 (0.2%) was added to the substrates for 10 min to increase cellular permeability and allow intracellular staining. Finally, the substrates were treated with a blocking solution containing 2% BSA and 0.1% Tween 20 at 37°C for 30 min to prevent nonspecific binding sites. WBCs as a negative control were also used for cell capture.
QDs-based multiplexed imaging
QDs-based multiplexed imaging was divided into two parts: QDs-based multiplexed imaging of cell climbing and QDs-based multiplexed imaging of substrate with captured cancer cells. For cell climbing staining, the cell climbing was treated with the following mixture of primary antibodies at 4°C overnight: mouse anti-human IgG monoclonal antibody against CK (dilution 1:600, BD-349205, BD Biosciences, Franklin Lakes, USA), goat anti-human IgG monoclonal antibody against vimentin (dilution 1:100, Ab-11256, Abcam, Cambridge, England) and a biotinylated anti-EpCAM monoclonal antibody. For the substrate staining, the substrate was incubated with the following mixture of primary antibodies at 4°C overnight: mouse anti-human IgG monoclonal antibody against CK, goat anti-human IgG monoclonal antibody against vimentin, and rabbit anti-human monoclonal antibody against CD45 (dilution 1:100, Ab-40763, Abcam). Then corresponding secondary antibodies, including QDs-585 goat F(ab')2 anti-mouse IgG conjugate (dilution 1:600, Q11011MP, Invitrogen, USA), QDs-655 rabbit F(ab')2 anti-goat IgG conjugate (dilution 1:600, Q11821MP, Invitrogen, USA), and QDs-labeled streptavidin-525 (dilution 1:100, QS525, Jiayuan Co., Ltd, China) or QDs-525 goat F(ab')2 anti-rabbit IgG conjugate (dilution 1:50, Q11441MP, Invitrogen, USA) were added to the substrate and incubated at 37°C for 2 h (Fig. 1B1-B3).
Comparisons between QDs-based imaging and traditional dyes imaging
Photobleaching and detection sensitivity were compared between QDs-based imaging and traditional dyes imaging. Images of MCF7 cell suspensions stained with QDs-655 and organic dye phycoerythrin (PE) and images of WBC suspensions stained with QDs-525 and the organic dye fluorescein isothiocyanate (FITC) were continuously exposed under an exciting light for photobleaching comparison. Two groups of MCF7 cell suspensions containing 1000, 500, 250 and 125 cancer cells were introduced into the optimized HA/CTS nanofilm substrates to perform QDs-based imaging and organic dyes imaging on CK for sensitivity comparison.
Image acquisition and unmixing
The surface morphology of HA-CTS nanofilm substrates was observed using field emission scanning electron microscopy (6700F; JEOL, Japan) at an acceleration voltage of 20 keV. QDs images with single information and traditional organic dyes images were acquired under an Olympus BX51 microscope equipped with an Olympus DP72 camera (Olympus Optical Co., Ltd., Tokyo, Japan). The signal intensities of CK and CD45 were quantified using the software package within the CRi Nuance multispectral imaging system (Cambridge Research & Instrumentation, Inc., Woburn, MA, USA). QDs images with multiple information on CK, vimentin and EpCAM/CD45 were acquired and unmixed using CRi Nuance multispectral imaging systems. After imaging acquisition, the information on these molecules were unmixed by the software package within CRi Nuance multispectral imaging system (Fig. 1C1-C3). There were 2 major technical steps for this procedure: (1) Selection of targets with different spectra; and (2) Image unmixing and elimination of background noise.
Cell counting
There are two methods to count captured cells in this study, one is for counting captured cell lines, and the other is for counting captured CTCs. For cell lines, images of the captured cells stained with 4',6-diamidino-2-phenylindole from different fields of each HA-CTS nanofilm substrate were randomly acquired by Olympus BX51 fluorescence microscope at 100× magnifications. The number of captured cells in these images was automatically counted by Image-Pro Plus software (Media Cybernetics Inc., Silver Spring, USA). And, the average value of captured cells in these images was calculated. The area of the acquired image could be calculated according to the scale of the acquired image. After above procedures, the number of all acquired cells on the 1×1 cm2 substrate was finally produced based on the following formula: captured cells (n) = average value × (substrate area/image area).
For CTCs, the CTCs stained with red QDs-655 and/or yellow QDs-585 on the HA-CTS nanofilm substrate were observed, counted and verified by two observers (one observed from the eyepiece, the other observed from the computer screen) under the fluorescence microscope at 200× magnifications according to the diagnostic standards (CK+ and/or Vimentin+, CD45-, cell size: 10-30 μm), from left to right, and top to bottom, throughout the entire substrate. Once the suspicious CTCs were found by any observer, they should be confirmed at 400× or 1000× magnifications.
Results
Comparisons of HA-CTS nanofilm substrates under different conditions
To acquire the optimized experiment conditions, CTCs capture efficiency at different baking time of HA-CTS-coated glasses and incubation time of cell suspensions on HA-CTS nanofilm substrates were compared in this study. First, the HA-CTS-coated glasses were heated on a baking table for 30 min, 60 min, 90 min and 120 min. Scanning electron microscopy showed that the surface morphology of HA-CTS nanofilm changed with the baking time of 30 min (Fig. 2A), 60 min (Fig. 2B), 90 min (Fig. 2C) and 120 min (Fig. 2D). Then, an EpCAM high-expression cancer cell line (MCF7), low-expression cell line (A549), null-expression cell line (HeLa) and WBCs from healthy donors were used at a concentration of 105/mL to quantify the capture efficiency of HA-CTS-coated glasses with different baking time. As shown in Fig. 2E, the capture efficiency of HA-CTS nanofilm substrates at the 90 min baking time was maximal for all cell lines, and efficiency declined with the extended baking time. Notably, the increased magnitude of capture efficiency for EpCAM low- and null-expression cell lines was higher than that of EpCAM high-expression cell line and WBCs. Subsequently, the above cell suspensions were incubated on HA-CTS nanofilm substrates with the optimized baking time for different incubation time (1 h, 2 h, 3 h and 4 h) to identify the optimal incubating time. As seen in Fig. 2F, the capture efficiency of tumor cell lines increased with incubation time and reached a maximum at 3 h. Specifically, the capture efficiency reached nearly 80% at 2 h for EpCAM high-expression cell line (MCF7) and further increased to the maximum at 3 h. The capture efficiency for the EpCAM low- (A549) and null-expression (HeLa) cell lines was significantly higher at 3 h than 1 h, especially for the HeLa cell line. However, the capture efficiency of WBCs reached a maximum at 2 h and declined at the following two time points. Therefore, we chose 90 min as the optimal baking time of HA-CTS-coated glasses and 3 h as the optimal incubation time of cell suspensions in this study.
Comparisons of capture efficiency of HA-CTS nanofilm substrates under different conditions. The surface morphology of HA-CTS coated glasses at baking time of 30 min (A), 60 min (B), 90 min (C) and 120 min (D). The comparisons of capture efficiency for different cells lines under different baking time (E) and incubation time (F). The capture efficiency of several other cell lines under the optimized conditions (G).
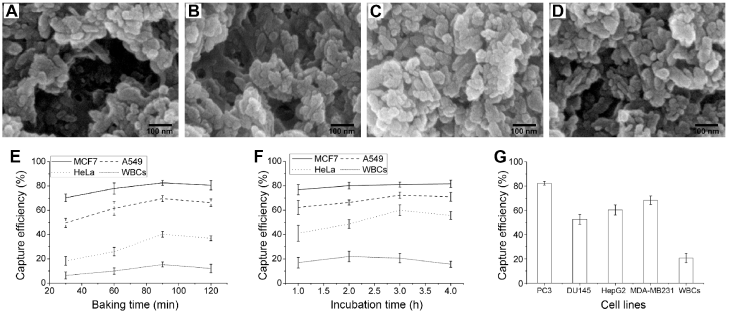
Four other cancer cell lines (PC3, DU145, HepG2 and MDA-MB231) and WBCs were used to further determine the capture efficiency of HA-CTS nanofilm substrates using our modified capture conditions (baking time: 90 min; incubation time: 3 h). The capture efficiency of modified HA-CTS nanofilm substrates for PC3, DU145, HepG2 and MDA-MB231 were 82.3%, 52.7%, 60.3%, 68.3%, respectively (Fig. 2G). These results demonstrated that the modified HA-CTS nanofilm substrates exhibited high capture efficiency for EpCAM high-expression cells. Simultaneously, the modified HA-CTS nanofilm substrates also could successfully capture EpCAM null-expression tumor cells with a capture efficiency > 50%.
Comparisons between QDs-based imaging and traditional organic dyes imaging
Photobleaching and detection ability of QDs-based imaging and traditional organic dyes imaging were compared to validate the ability of QDs-based imaging. PE and QDs-655, FITC and QDs-525 were applied for photobleaching studies to image CK of MCF7 cells and CD45 of WBCs on the modified HA-CTS nanofilm substrates, respectively. QDs-655 and PE imaging of MCF7 cells under continuous exciting light at 0 min (Fig. 3A1 and B1), 2 min (Fig. 3A2 and B2), 4 min (Fig. 3A3 and B3) and 8 min (Fig. 3A4 and B4), and QDs-525 and FITC imaging of WBCs under continuous exciting light at 0 min (Fig. 3C1 and D1), 2 min (Fig. 3C2 and D2), 4 min (Fig. 3C3 and D3) and 8 min (Fig. 3C4 and D4) were shown in Fig. 3. The fluorescent intensity curve of these 4 dyes indicated that QDs exhibited stronger photostability than traditional organic dyes (PE and FITC) (Fig. 3E). Notably, the fluorescence intensity of QDs-655 slightly increased at the beginning of exposure, then decreased steadily. Therefore, QDs were superior to organic dyes because of the comparatively longer fluorescence lifetime, which guaranteed a longer search time and observation of targets.
Comparisons of QDs-based imaging and organic dyes imaging in photostability and detection ability. QDs-655 imaging and PE imaging for MCF7 cells at 0 min (A1 and B1), 2 min (A2 and B2), 4 min (A3 and B3) and 8 min (A4 and B4); QDs-525 imaging and FITC imaging for WBCs at 0 min (C1 and D1), 2 min (C2 and D2), 4 min (C3 and D3) and 8 min (C4 and D4); Comparisons of fluorescence intensity for different staining methods (E); Comparisons of QDs and organic dyes imaging in detection ability for cancer cells with different concentrations (F). Magnifications: 200×.
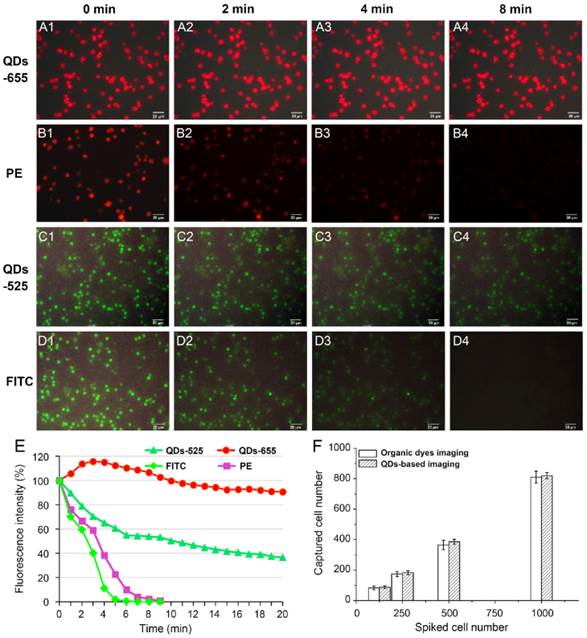
To compare the detection ability of QDs to organic dyes imaging on cancer cells, two groups of MCF7 cell suspensions at concentration of 1000/mL, 500/mL, 250/mL, 125/mL were captured using the modified HA-CTS nanofilm substrates under the same conditions. Then, QDs-655 and traditional PE imaging were used to detect the captured cancer cells. The results showed the efficiencies of QDs detection at these concentrations were higher than PE detection (Fig. 3F). However, the difference between these two staining methods had no statistical significance. These results indicated that QDs had a comparable ability for the detection of captured cancer cells as organic dyes.
QDs-based multiplexed imaging of EpCAM, CK and vimentin in cell climbing
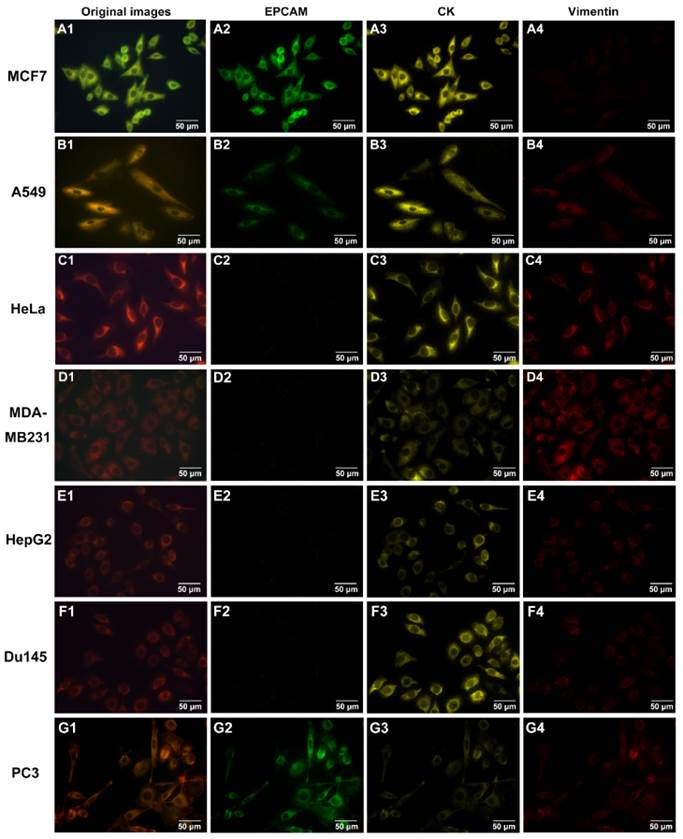
To determine the staining ability of QDs-based multiplexed imaging for multiple molecules, 7 tumor cell lines (MCF-7, A549, HeLa, MDA-MB231, HepG2, DU145 and PC3) with different expression levels of EpCAM, CK and vimentin in prepared cell climbing were stained by QDs-based multiplexed imaging. Fig. 4 showed the original QDs images and unmixed images of CK, vimentin and EpCAM of these 7 tumor cell lines. These images validated that QDs-based multiplexed imaging could clearly reveal multiple molecules with different expression levels in tumor cells.
QDs-based multiplexed imaging on cancer cell lines with different molecule phenotypes. Original images and unmixed images for EpCAM, CK and vimentin of MCF7 (A1-A4), A549 (B1-B4), HeLa (C1-C4), MDA-MB231 (D1-D4), HepG2 (E1-E4), DU145 (F1-F4) and PC3 (G1-G4). Magnifications: 400×.
Capture and detection of CTCs from cancer patients
The modified CTCs capture and detection system was used to capture CTCs from prepared blood sample suspensions from 55 patients with breast cancer (12 cases), lung cancer (13 cases), gastric cancer (15 cases) and colorectal cancer (15 cases) and healthy donors (8 cases). After this procedure, QDs-based multiplexed imaging was used to simultaneously stain CK, vimentin and CD45 on the transparent substrates. Vimentin-positive CTC with mesenchymal phenotype from lung cancer (Fig. 5A1-A4), CK-positive CTC with epithelial phenotype from breast cancer (Fig. 5B1-B4), and both CK- and vimentin-positive CTC with epithelial-mesenchymal phenotype from colorectal cancer (Fig. 5C1-C4) were showed in Fig. 5. These results indicated that this CTCs capture and detection system could directly capture and identify heterogeneous CTCs.
QDs-based multiplexed imaging and unmixed images of different CTCs phenotypes for cancer patient and number of captured CTCs for different cancers. A1, B1 and C1 are original images of QDs-based multiplexed imaging; A2, B2 and C2 are unmixed images of WBCs; A3, B3 and C3 are unmixed images of CK; A4, B4 and C4 are unmixed images of vimentin. Number of CK-positive, vimentin-positive, and both CK- and vimentin-positive CTCs for different cancers at different TNM stages and heathy donors (D). Magnifications: 1000×.
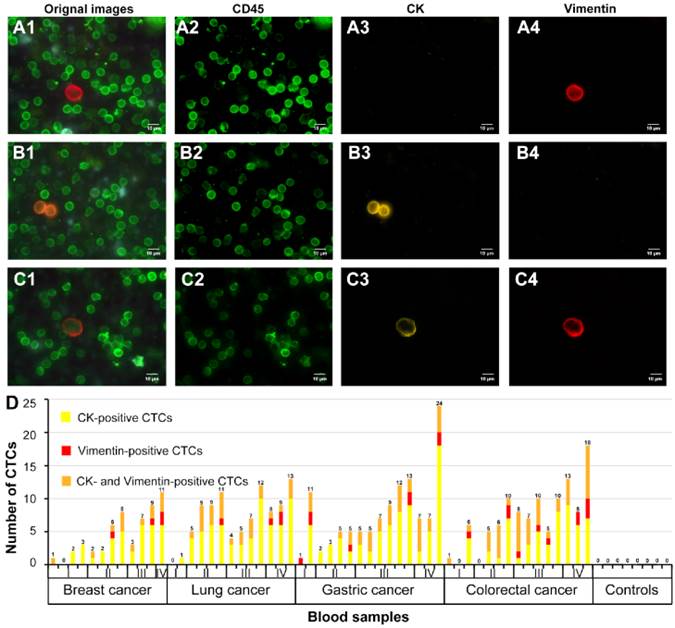
Simultaneously, number of vimentin-positive CTCs, CK-positive CTCs, and CK- and vimentin-positive CTCs of above 4 kinds of cancers with different TNM stages and healthy donors were showed in Fig. 5D. From Fig. 5D, we could find the proportions of CK-positive CTCs, vimentin-positive CTCs, and CK- and vimentin-positive CTCs were 68.5% (37/54), 7.4% (4/54), 24.1% (13/54), respectively, in breast cancer, 68.8% (64/93), 4.3% (4/93), 26.9% (25/93), respectively, in lung cancer, 64.7% (75/116), 6.9% (8/116), 28.4% (33/116), respectively, in gastric cancer, and 52.3% (56/107), 10.3% (11/107), 37.4% (40/107), respectively, in colorectal cancer. Additionally, proportions of vimentin-positive CTCs (33.3%, 9/27) and CK- and vimentin-positive CTCs (31.5%, 35/111) of early stage (stage I/II) cancers were lower than that of advanced stage (III/IV) cancers (vimentin-positive CTCs: 66.7%, 18/27; vimentin-positive CTCs: 68.5%, 76/111). The results implied that the proportions of CTCs with mesenchymal phenotype in early stage cancers may lower than that in advanced stage cancers. However, this capture and detection system did not capture and detect CTCs in blood samples of heathy donors.
Discussion
Some tumor cells, which are broadly known as CTCs, detach from the primary tumor mass and gain access to the blood circulation during cancer progression. These cells may implant at other body sites to form metastases and/or recurrence when the local microenvironment is permissive [31, 32]. CTCs have aroused much interest from the oncology community as a useful indicator in cancer detection, prognosis and treatment evaluation [6-8]. Therefore, the capture and identification of CTCs from complex blood systems are hot topics in cancer research.
So far, much attention has been paid to the development of various technologies that attempted to enrich and detect CTCs from complex blood system. The cores of these technologies are “enrichment” and “identification” of CTCs. Enrichment technologies can be divided into two mainstream methods: immunoaffinity enrichment (e.g. immunomagnetic beads, flow cytometry sorting and immunoaffinity CTCs-chips, et al) [10, 11] and physical enrichment (cell size, cell density, and cell morphology, et al) [9, 12, 33]. The immunoaffinity enrichment methods are the most promising candidates for CTCs capture systems. Mostly, an epithelial marker (EpCAM or CK) that is widely expressed in solid cancers is used to capture CTCs using immuno-conjugation methods in this type of CTCs capture system, which shows high specificity and strong stability in the capture of CTCs and opens a new field in CTCs research. However, this technique may not be an efficient or reliable tool for the capture of CTCs, which have experienced EMT process to down-regulate or lose epithelial markers. The existence of EMT implies that CTCs capture systems that are only based on epithelial markers are not sufficient and may fail to capture mesenchymal phenotype CTCs [34]. Physical enrichment methods that are based on cell density, size, and morphology seem to capture CTCs with epithelial and mesenchymal phenotypes. However, these methods are also criticized because of their low capture sensitivity and specificity [35]. Additionally, how to simultaneously and rapidly identify these heterogeneous CTCs using traditional CTCs detection technologies is another challenge.
This study established a nanostructured capture and QDs-based multiplexed imaging detection system to capture and identify epithelial and mesenchymal CTCs and address these disadvantages. Firstly, HA (the main mineral component of vertebrate bone and teeth tissue that exhibits good biocompatibility and bioactivity [36]) and CTS (a biocompatible biodegradable polysaccharide which could increase the plasticity of HA particles [37]) were introduced to fabricate transparent nanofilm. The combination of HA and CTS had strong mechanical strength, good biocompatibility, which was beneficial for shaping and cell adhesions. The transparent substrates successfully captured epithelial CTCs by functionalizing with anti-EpCAM antibody. Since nanostructures topographic could significantly enhance adhesion strength of cancer cells [33], the interactions between nanoscale cellular surface components (e.g., microvilli and filopodia) and nanostructured materials were also fully used to increase the capture of mesenchymal CTCs, in addition to the immunoaffinity reaction between anti-EpCAM-coated transparent substrates and epithelial CTCs. Our previous studies demonstrated that nanostructured CTCs substrates could capture EpCAM low-expression cell line (A549) at an efficiency of 70% [28]. Based on this nanostructured CTCs capturing substrates, we optimized the experimental conditions. Before fabrication of HA-CTS nanofilm substrates, HA powder was firstly milled to make the particles fine and uniform. Generally speaking, powder would produce a large number of fresh bonding interfaces after being repeatedly broken. In addition, the smaller particle size was, the bigger surface area and higher surface energy were. Moreover, we optimized the baking time of HA-CTS-coated glasses to change surface morphology of nanofilm and incubation time of cell suspension to increase the attachment with nanosubstrates (Fig. 2E and F). By above two procedures, the optimized HA-CTS nanofilm could capture CTCs with epithelial phenotype at an efficiency > 80% and CTCs with mesenchymal phenotype at an efficiency > 50% (Fig. 2G).
In terms of identifying CTCs, comparisons between QDs-based imaging and organic dyes imaging indicated that QDs-based imaging had comparable detection ability to organic dyes imaging but higher photostability than organic dyes imaging in stained cells (Fig. 3). To further validate its staining ability, QDs-based multiplexed imaging was used to image EpCAM, CK and vimentin of different cancer cell lines, which demonstrated that this technique accurately described the molecular profiles of cancer cell lines with different phenotypes (Fig. 4). Finally, QDs-based multiplexed imaging of CK (a widely used marker of epithelial cells), vimentin (the major constituent of the intermediate filament family that is up-regulated in many EMT cancer cells [38]), and CD45 (a specific marker for WBCs) were applied to simultaneously distinguish CTCs from WBCs. The CRi Nuance multispectral imaging system validated the capture ability of the HA-CTS nanofilm substrates for heterogeneous phenotypes from different patient blood samples by unmixing the spectral signals of CK and vimentin without the interference of noisy signals with similar colors. Additionally, the technique also clearly demonstrated the number of CTCs with different phenotypes in cancer patients and healthy donors.
There are three improvements in this study. Firstly, the modified HA-CTS nanofilm substrates in this study can capture epithelial CTCs and mesenchymal CTCs at acceptable capture efficiencies (> 80% for EpCAM high- or low-expression CTCs and > 50% for EpCAM null-expression CTCs). Secondly, QDs-based imaging exhibits a stronger photostability and fluorescence intensity than organic dyes, which guarantees a long search time and observation period of potential CTCs on transparent substrates. Thirdly, QDs-based multiplexed imaging allows the direct distinguishing of CTCs from WBCs under an exciting light and the simultaneously imaging of epithelial and mesenchymal CTCs. These factors may help reduce the difficulties of capturing CTCs with different phenotypes and improve the efficiency of CTCs identification by imaging multiple biomarkers.
Conclusions
The present study demonstrated a reliable capture and detection system for epithelial and mesenchymal CTCs from blood samples that combined CTCs enrichment equipment based on HA-CTS nanofilm substrates with a highly sensitive QDs-based multiplexed imaging identification method.
Abbreviation
CTCs: circulating tumor cells; HA-CTS: hydroxyapatite-chitosan; EpCAM: epithelial cell adhesion molecule; CK: cytokeratin; EMT: epithelial-mesenchymal transition; QDs: quantum dots; WBCs: white blood cells; PBS: phosphate-buffered saline; PFA: paraformaldehyde; FITC: fluorescein isothiocyanate; PE: phycoerythrin.
Acknowledgements
This work was supported by National High Technology Research and Development Program of China [No. 2012AA02A502, 2012AA02A506].
Competing Interests
The authors have declared that no competing interest exists.
References
1. Klein CA. Cancer. The metastasis cascade. Science. 2008;321:1785-7
2. Steeg PS. Tumor metastasis: mechanistic insights and clinical challenges. Nat Med. 2006;12:895-904
3. Chiang AC, Massague J. Molecular basis of metastasis. N Engl J Med. 2008;359:2814-23
4. Bos PD, Zhang XH, Nadal C. et al. Genes that mediate breast cancer metastasis to the brain. Nature. 2009;459:1005-9
5. Rahbari NN, Bork U, Kircher A. et al. Compartmental differences of circulating tumor cells in colorectal cancer. Ann Surg Oncol. 2012;19:2195-202
6. Wang S, Liu K, Liu J. et al. Highly efficient capture of circulating tumor cells by using nanostructured silicon substrates with integrated chaotic micromixers. Angew Chem Int Ed Engl. 2011;50:3084-8
7. Cohen SJ, Punt CJ, Iannotti N. et al. Prognostic significance of circulating tumor cells in patients with metastatic colorectal cancer. Ann Oncol. 2009;20:1223-9
8. Kling J. Beyond counting tumor cells. Nat Biotechnol. 2012;30:578-80
9. Lee A, Park J, Lim M. et al. All-in-one centrifugal microfluidic device for size-selective circulating tumor cell isolation with high purity. Anal Chem. 2014;86:11349-56
10. Kang JH, Krause S, Tobin H. et al. A combined micromagnetic-microfluidic device for rapid capture and culture of rare circulating tumor cells. Lab Chip. 2012;12:2175-81
11. Hoshino K, Huang YY, Lane N. et al. Microchip-based immunomagnetic detection of circulating tumor cells. Lab Chip. 2011;11:3449-57
12. Mostert B, Sleijfer S, Foekens JA, Gratama JW. Circulating tumor cells (CTCs): detection methods and their clinical relevance in breast cancer. Cancer Treat Rev. 2009;35:463-74
13. Powell AA, Talasaz AH, Zhang H. et al. Single cell profiling of circulating tumor cells: transcriptional heterogeneity and diversity from breast cancer cell lines. PLoS One. 2012;7:e33788
14. Bichsel CA, Gobaa S, Kobel S. et al. Diagnostic microchip to assay 3D colony-growth potential of captured circulating tumor cells. Lab Chip. 2012;12:2313-6
15. Sheng W, Chen T, Kamath R. et al. Aptamer-enabled efficient isolation of cancer cells from whole blood using a microfluidic device. Anal Chem. 2012;84:4199-206
16. Hyun KA, Kwon K, Han H. et al. Microfluidic flow fractionation device for label-free isolation of circulating tumor cells (CTCs) from breast cancer patients. Biosens Bioelectron. 2013;40:206-12
17. Wang S, Wang H, Jiao J. et al. Three-dimensional nanostructured substrates toward efficient capture of circulating tumor cells. Angew Chem Int Ed Engl. 2009;48:8970-3
18. Zhang N, Deng Y, Tai Q. et al. Electrospun TiO2 nanofiber-based cell capture assay for detecting circulating tumor cells from colorectal and gastric cancer patients. Adv Mater. 2012;24:2756-60
19. Yu M, Bardia A, Wittner BS. et al. Circulating breast tumor cells exhibit dynamic changes in epithelial and mesenchymal composition. Science. 2013;339:580-4
20. Thiery JP, Lim CT. Tumor dissemination: an EMT affair. Cancer Cell. 2013;23:272-3
21. Mego M, Gao H, Lee BN. et al. Prognostic Value of EMT-Circulating Tumor Cells in Metastatic Breast Cancer Patients Undergoing High-Dose Chemotherapy with Autologous Hematopoietic Stem Cell Transplantation. J Cancer. 2012;3:369-80
22. Bonnomet A, Brysse A, Tachsidis A. et al. Epithelial-to-mesenchymal transitions and circulating tumor cells. J Mammary Gland Biol Neoplasia. 2010;15:261-73
23. Kim YJ, Koo GB, Lee JY. et al. A microchip filter device incorporating slit arrays and 3-D flow for detection of circulating tumor cells using CAV1-EpCAM conjugated microbeads. Biomaterials. 2014;35:7501-10
24. Wang LW, Peng CW, Chen C, Li Y. Quantum dots-based tissue and in vivo imaging in breast cancer researches: current status and future perspectives. Breast Cancer Res Treat. 2015;151:7-17
25. Resch-Genger U, Grabolle M, Cavaliere-Jaricot S. et al. Quantum dots versus organic dyes as fluorescent labels. Nat Methods. 2008;5:763-75
26. Pericleous P, Gazouli M, Lyberopoulou A. et al. Quantum dots hold promise for early cancer imaging and detection. Int J Cancer. 2012;131:519-28
27. Walling MA, Novak JA, Shepard JR. Quantum dots for live cell and in vivo imaging. Int J Mol Sci. 2009;10:441-91
28. Cheng B, He Z, Zhao L. et al. Transparent, biocompatible nanostructured surfaces for cancer cell capture and culture. Int J Nanomedicine. 2014;9:2569-80
29. Cheng B, Song H, Wang S. et al. Quantification of rare cancer cells in patients with gastrointestinal cancer by nanostructured substrate. Transl Oncol. 2014;7:720-5
30. Mu H, Lin KX, Zhao H. et al. Identification of biomarkers for hepatocellular carcinoma by semiquantitative immunocytochemistry. World J Gastroenterol. 2014;20:5826-38
31. Paterlini-Brechot P, Benali NL. Circulating tumor cells (CTC) detection: clinical impact and future directions. Cancer Lett. 2007;253:180-204
32. Hong B, Zu Y. Detecting circulating tumor cells: current challenges and new trends. Theranostics. 2013;3:377-94
33. Chen W, Weng S, Zhang F. et al. Nanoroughened surfaces for efficient capture of circulating tumor cells without using capture antibodies. ACS Nano. 2013;7:566-75
34. Mikolajczyk SD, Millar LS, Tsinberg P. et al. Detection of EpCAM-Negative and Cytokeratin-Negative Circulating Tumor Cells in Peripheral Blood. J Oncol. 2011;2011:252361
35. Torino F, Bonmassar E, Bonmassar L. et al. Circulating tumor cells in colorectal cancer patients. Cancer Treat Rev. 2013;39:759-72
36. Lee JS, Murphy WL. Functionalizing calcium phosphate biomaterials with antibacterial silver particles. Adv Mater. 2013;25:1173-9
37. Frohbergh ME, Katsman A, Botta GP. et al. Electrospun hydroxyapatite-containing chitosan nanofibers crosslinked with genipin for bone tissue engineering. Biomaterials. 2012;33:9167-78
38. Satelli A, Li S. Vimentin in cancer and its potential as a molecular target for cancer therapy. Cell Mol Life Sci. 2011;68:3033-46
Author contact
![]() Corresponding author: Bin Xiong; Department of Oncology, Zhongnan Hospital of Wuhan University, Hubei Key of Laboratory of Tumor Biological Behaviors & Hubei Cancer Clinical Study Center, No 169 Donghu Road, Wuchang District, Wuhan 430071, Hubei Province, P.R. China. Tel: +86-27-67813152; Fax: +86-027-67812892; E-mail: binxiong1961edu.cn
Corresponding author: Bin Xiong; Department of Oncology, Zhongnan Hospital of Wuhan University, Hubei Key of Laboratory of Tumor Biological Behaviors & Hubei Cancer Clinical Study Center, No 169 Donghu Road, Wuchang District, Wuhan 430071, Hubei Province, P.R. China. Tel: +86-27-67813152; Fax: +86-027-67812892; E-mail: binxiong1961edu.cn