Impact Factor ISSN: 1837-9664

 Global reach, higher impact
J Cancer 2015; 6(12):1306-1319. doi:10.7150/jca.13266 This issue Cite
Research Paper
Comprehensive Two- and Three-Dimensional RNAi Screening Identifies PI3K Inhibition as a Complement to MEK Inhibitor AS703026 for Combination Treatment of Triple-Negative Breast Cancer
Jangsoon Lee1, Rachael Galloway2, Geoff Grandjean3, Justin Jacob3, Juliane Humphries1, Chandra Bartholomeusz1, Samantha Goodstal4, Bora Lim1, Geoffrey Bartholomeusz3 ![]() , Naoto T. Ueno1
, Naoto T. Ueno1 ![]() , Arvind Rao2
, Arvind Rao2 ![]()
1. Section of Translational Breast Cancer Research and Morgan Welch Inflammatory Breast Cancer Research Program and Clinic, Department of Breast Medical Oncology - Unit 1354, The University of Texas MD Anderson Cancer Center, 1515 Holcombe Blvd., Houston, TX, 77030, USA;
2. Department of Bioinformatics and Computational Biology - Unit 1410, The University of Texas MD Anderson Cancer Center, 1515 Holcombe Blvd., Houston, TX, 77030, USA;
3. Department of Experimental Therapeutics - Unit 1950, The University of Texas MD Anderson Cancer Center, 1515 Holcombe Blvd., Houston, TX, 77030, USA;
4. EMD Serono Research & Development Institute, Inc., 45A Middlesex Turnpike, Billerica, MA, 01821, USA.
Received 2015-7-16; Accepted 2015-8-8; Published 2015-10-28
Abstract
Triple-negative breast cancer (TNBC) is a major cause of death among breast cancer patients that results from intrinsic and acquired resistance to systemic chemotherapies. To identify novel targets for effective treatment of TNBC through combination strategies with MEK inhibitor (AS703026), we used a novel method of combining high-throughput two- and three-dimensional (2D and 3D) RNAi screening. TNBC cells were transfected with a kinome siRNA library comprising siRNA targeting 790 kinases under both 2D and 3D culture conditions with or without AS703026. Molecule activity predictor analysis revealed the PI3K pathway as the major target pathway in our RNAi combination studies in TNBC. We found that PI3K inhibitor SAR245409 (also called XL765) combined with AS703026 synergistically inhibited proliferation compared with either drug alone (P < 0.001). Reduced in vitro colony formation (P < 0.001) and migration and invasion ability were also observed with the combination treatment (P<0.01). Our data suggest that SAR245409 combined with AS703026 may be effective in patients with TNBC. We conclude that a novel powerful high-throughput RNAi assays were able to identify anti-cancer drugs as single or combinational agents. Integrated and multi-system RNAi screening methods can complement difference between in vitro and in vivo culture conditions, and enriches targets that are close to the in vivo condition.
Keywords: Triple-negative breast cancer, two-dimensional RNAi screening, three-dimensional RNAi screening, SAR245409, AS703026, multicellular tumor spheroid, projection formation.
Introduction
Triple-negative breast cancer (TNBC) (in which estrogen receptor, progesterone receptor, and HER2 are not overexpressed) is characterized by distinct clinical and pathologic features, metastatic behavior, a high recurrence rate, and poor prognosis compared with other breast cancer types [1-3]. TNBC does not respond to receptor-targeted treatments such as hormonal therapy and trastuzumab, leaving chemotherapy as the mainstay of treatment. It is now increasingly appreciated that combinatorial therapies are an essential path to achieving reliable treatment efficacy in TNBC. To facilitate such a multipronged approach, we need to find drugs that work together to modulate/target multiple hallmarks of cancer cell behavior.
Two-dimensional (2D) high-throughput kinome RNA interference (RNAi) screening has become a useful method for exploring the cellular signaling pathways that underlie cancer cell biology and for identifying target molecules for treatment [4]. Despite the powerful strategy of 2D high-throughput kinome RNAi screening in biological studies [5, 6], 2D monolayer cell growth model lacks the key component of cancer - the tumor microenvironment that can be tested in vivo [7, 8]. Three-dimensional (3D) cell cultures exhibit a higher degree of structural complexity and homeostasis, analogous to tissues and organs [9], and are currently used in a broad range of cell biology studies, including tumor biology studies [10]. Thus, we hypothesized that comprehensive RNAi analysis with 2D viability and 3D morphological assays would identify targets with better significance that can be a representative of clinical target for TNBC treatment. To test this hypothesis, we studied the role of gene knockdown under both 2D and 3D culture conditions to synergistically modulate the cancer growth phenotype in conjunction with a MEK inhibitor (AS703026). MDA-MB-231 cells were grown as either a 3D multicellular tumor spheroid (MCTS) cell culture system or as a 2D monolayer cell culture system. MDA-MB-231 cells demonstrate a unique 3D morphology comprising projections suggestive of epithelial-mesenchymal transition (EMT)-mediated invasion processes that are related to the cell line's spontaneous metastasis capability [11, 12].
The objective of this screen was to identify targets whose silencing by siRNA sensitized the TNBC cells to the MEK inhibitor, enhancing cell killing. Rather than focusing solely on a viability assay in 2D culture, we carried out a parallel screen utilizing a 3D culture that more closely resembled the in vivo environment to identify modulators of morphological formation of projections/filopodia. We identified and validated the PI3K pathway as a therapeutic target for combination with MEK inhibitor AS703026, a treatment strategy that is being assessed in phase I clinical trial expansion cohorts for TNBC patients.
Results
Primary Screen
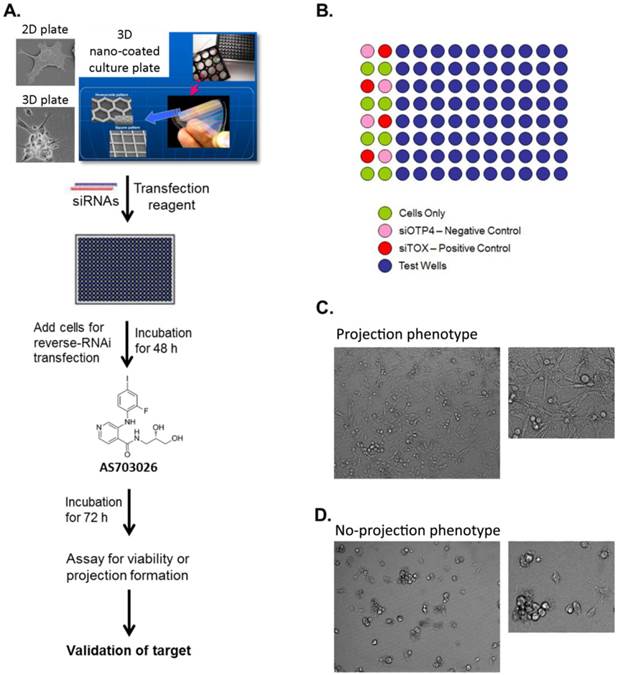
We first analyzed 760 kinases targeted by the human siRNA kinase library to identify gene profiles for the 2D monolayer cell culture and the 3D MCTS culture (Figure 1). In both types of culture, we identified genes that sensitized the cells to the MEK inhibitor, inducing greater than 50% cell growth inhibition or killing compared to cells treated with the solvent/vehicle.
High-throughput RNAi screen using a 3D multicellular tumor spheroid model of breast cancer. (A) The breast cancer cell line MDA-MB-231 was grown on a non-matrix transparent cycloolefin resinous scaffold comprising nanoscale indented patterns with a 500-nm line width, 1-mm line depth, and 10-nm to 500-nm line spacing. Cells grown on this surface form 3D multicellular tumor spheroids with projections. (B) The high-throughput screen was performed in 96-well plates in duplicates. The readouts for the screen were morphology and viability. (C, D) Images from 3D culture plates. Ten images were captured per well for a total of 20 images for each siRNA.
Classification Results
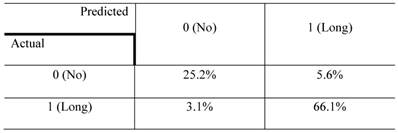
The confusion matrix for the no- vs long-projection phenotype classifier is shown in Table 1. The entries in each cell represent the percentage of instances that were predicted by the computer model (divided into columns for each phenotype) and the actual instances (shown by rows). Table 2 shows the contingency table based on examining the intersection between the 2D and 3D screen outputs. We found that 5.1% of the genes conferred a growth inhibition phenotype in 2D culture and the “no-projection” phenotype in 3D culture. The panels of genes whose silencing induced this sensitization varied significantly between the 2D and 3D cell systems. The 3D model was superior as it enabled us to identify a panel of genes that had an effect on invasion as well as viability (Table 3).
The confusion matrix representing the performance of the no- vs long-projection phenotype classifier for 3D culture results. rows represent the actual labels (based on human expert annotation) of the cells' morphology, whereas columns represent the labels predicted by the random forest classifier. The accuracy of the classifier was 91%.
Contingency table based on examining the intersection between 2D and 3D RNAi screening. The entries denote the number of genes that confer the indicated morphological designations under 2D and 3D culture conditions (eg: 48.9% of the genes conferred the “no growth inhibition” phenotype in 2D culture but the “long-projection” phenotype in 3D culture). The determination of 3D morphology was made based on decisions outputted by the morphology classifier shown in Table 1.
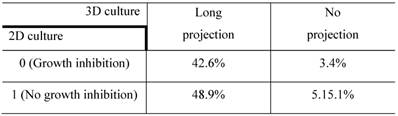
The entries in each cell indicate the number of genes that have the characteristics in the type of culture shown by the column and row headings.
Genes whose silencing led to a no-projection phenotype in the 3D screen, grouped by the outcome of the 2D siRNA screen.
| Gene symbol | Accession no. | Gene name |
|---|---|---|
| No growth inhibition outcome in 2D/ no projection in 3D culture (5.1 %, 39 genes) | ||
| ADRBK2 | NM_001619 | adrenergic, beta, receptor kinase 1 |
| ANGPT4 | NM_015985 | angiopoietin 4 |
| ATR | NM_001184 | ataxia telangiectasia and Rad3 related |
| CDKN3 | NM_005192 | cyclin-dependent kinase inhibitor 3 |
| CKMT1 | NM_020990 | creatine kinase, mitochondrial 1B |
| CKMT2 | NM_001825 | creatine kinase, mitochondrial 2 |
| CNKSR1 | NM_006314 | connector enhancer of kinase suppressor of Ras 1 |
| DUSP1 | NM_004417 | dual specificity phosphatase 1 |
| DUSP10 | NM_007207 | dual specificity phosphatase 10 |
| DYRK1B | NM_004714 | dual-specificity tyrosine-(Y)-phosphorylation regulated kinase 1B |
| EPHA1 | NM_005232 | EPH receptor A1 |
| FLJ10761 | NM_018208 | Ethanolamine kinase 2 (ETNK2) |
| FLJ34389 | NM_152649 | Mixed lineage kinase domain-like (MLKL), transcript variant 1 |
| FUK | NM_145059 | Fucokinase |
| MERTK | NM_006343 | c-mer proto-oncogene tyrosine kinase |
| MGC4796 | NM_032017 | serine/threonine kinase 40 (STK40), transcript variant 3 |
| MGC5601 | NM_025247 | acyl-CoA dehydrogenase family, member 10 (ACAD10), transcript variant 2 |
| PAG | NM_018440 | phosphoprotein associated with glycosphingolipid microdomains 1 |
| PDK3 | NM_005391 | pyruvate dehydrogenase kinase, isozyme 3 (PDK3), transcript variant 2 |
| PDPK1 | NM_002613 | 3-phosphoinositide dependent protein kinase-1 (PDPK1), transcript variant 1 |
| PFTK1 | NM_012395 | cyclin-dependent kinase 14 (CDK14) |
| PIK3C2G | NM_004570 | phosphatidylinositol-4-phosphate 3-kinase, catalytic subunit type 2 gamma |
| PKN3 | NM_013355 | protein kinase N3 |
| PPP2CB | NM_004156 | protein phosphatase 2 (formerly 2A), catalytic subunit, beta isoform |
| PRKAA2 | NM_006252 | protein kinase, AMP-activated, alpha 2 catalytic subunit |
| PAK4 | NM_005884 | p21 protein (Cdc42/Rac)-activated kinase 4 |
| PRKCN | NM_005813 | protein kinase D3 |
| PRKCQ | NM_006257 | protein kinase C, theta |
| PRPSAP1 | NM_002766 | phosphoribosyl pyrophosphate synthetase-associated protein 1 |
| PTPRR | NM_002849 | protein tyrosine phosphatase, receptor type, R |
| SNRK | NM_017719 | SNF related kinase |
| SSTK | NM_032037 | testis-specific serine kinase 6 |
| STK19 | NM_004197 | serine/threonine kinase 19 |
| STK31 | NM_031414 | serine/threonine kinase 31 |
| STK35 | NM_080836 | serine/threonine kinase 35 |
| STK36 | NM_015690 | serine/threonine kinase 36 |
| STYK1 | NM_018423 | serine/threonine/tyrosine kinase 1 |
| TEX14 | NM_031272 | testis expressed 14 |
| TNK1 | NM_003985 | tyrosine kinase, non-receptor, 1 |
| Growth inhibition outcome in 2D/ no projection in 3D culture (3.4 %, 26 genes) | ||
| CDC42BPA | NM_003607 | CDC42 binding protein kinase alpha |
| CDK6 | NM_001259 | cyclin-dependent kinase 6 |
| CDKN1B | NM_004064 | cyclin-dependent kinase inhibitor 1B |
| MYO3A | NM_017433 | myosin IIIA |
| NTRK3 | NM_002530 | neurotrophic tyrosine kinase, receptor, type 3 |
| PAK6 | NM_020168 | p21 protein (Cdc42/Rac)-activated kinase 6 |
| PANK4 | NM_018216 | pantothenate kinase 4 |
| PAPSS1 | NM_005443 | 3'-phosphoadenosine 5'-phosphosulfate synthase 1 |
| PCTK1 | NM_006201 | cyclin-dependent kinase 16 |
| PCTK3 | NM_002596 | cyclin-dependent kinase 18 |
| PFKP | NM_002627 | phosphofructokinase, platelet |
| PGK2 | NM_138733 | phosphoglycerate kinase 2 |
| PHKG2 | NM_000294 | phosphorylase kinase, gamma 2 |
| PIP5K1A | NM_003557 | phosphatidylinositol-4-phosphate 5-kinase, type I, alpha |
| PRKCE | NM_005400 | protein kinase C, epsilon |
| PRKD2 | NM_016457 | protein kinase D2 |
| PRKWNK4 | NM_032387 | WNK lysine deficient protein kinase 4 |
| PTK6 | NM_005975 | protein tyrosine kinase 6 |
| RAC1 | NM_018890 | ras-related C3 botulinum toxin substrate 1 |
| SGK2 | NM_016276 | serum/glucocorticoid regulated kinase 2 |
| SPEC2 | NM_020240 | CDC42 small effector 2 |
| SPHK1 | NM_021972 | sphingosine kinase 1 |
| SPHK2 | NM_020126 | sphingosine kinase 2 |
| STK25 | NM_006374 | serine/threonine kinase 25 |
| TPK1 | NM_022445 | thiamin pyrophosphokinase 1 |
| TXK | NM_003328 | TXK tyrosine kinase |
Ingenuity Pathway Analysis
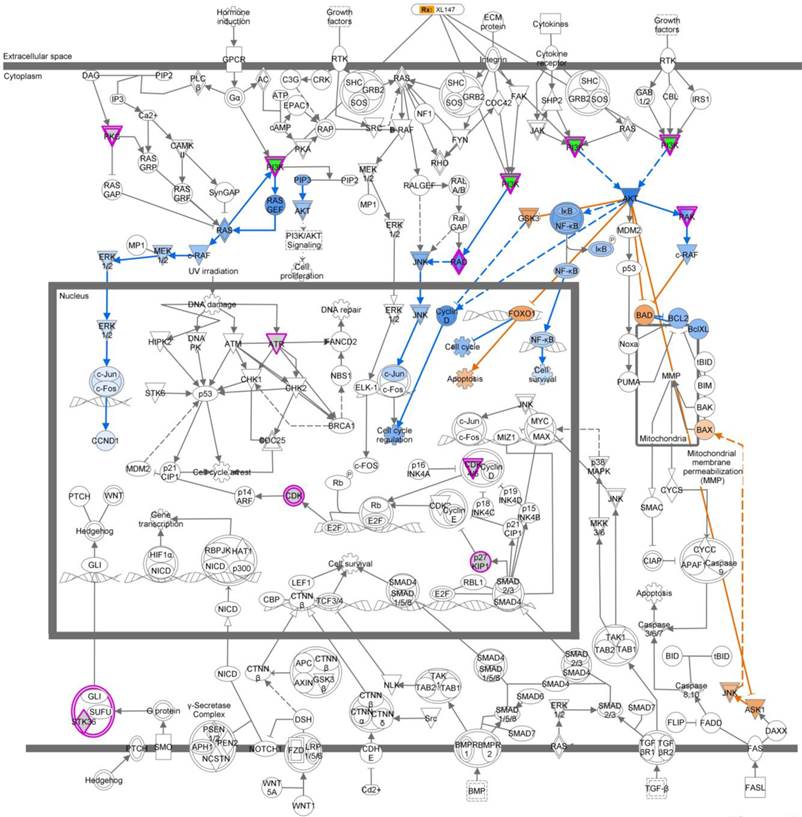
We next analyzed the 5.1% of genes that led to no projections in the 3D MCTS system and were growth inhibition in the 2D monolayer system. The top five pathways that were over-represented based on these genes are listed in Table 4. Based on these five top-ranked pathways, we used the “Overlay” feature in IPA to identify various drugs that could perturb the activity of these molecules. Further, we perturbed these molecules using the MAP feature in IPA (Figure S1). To identify genes that synergize with the MEK inhibitor's action and drive reduction in tumor growth morphology and viability, we used the MAP and upstream drug activity analysis functionality in IPA.[13] Examination of the top-ranking pathways in this set of genes revealed that the PI3K gene is present and the upstream of PI3K gene across the five pathways were related (Figure 3, Figure S1). Based on these observations, we hypothesized that a PI3K inhibitor would synergistically reduce tumor growth in conjunction with MEK inhibitor AS703026.
IPA pathway analysis of the 5.1% of the genes in Table 2 that led to no projection in the 3D MCTS system and a growth inhibition outcome in the 2D monolayer system. The five top-ranked pathways corresponding to the gene hits are listed.
| Pathway name | Genes common to the pathway and the list of hits from the 3D screen |
|---|---|
| Erbb Signaling | PAK4, PAK6, PDPK1, PIK3C2G, PRKCE, PRKCQ, PRKD3 |
| Molecular Mechanisms of Cancer | ATR, CDK6, CDKN1B, PAK4, PAK6, PIK3C2G, PRKCE, PRKCQ, PRKD3, RAC1, STK36 |
| Renin-Angiotensin Signaling | PAK4, PAK6, PI3KC2G, PRKCE, PRKCQ, PRKD3, RAC1 |
| NK Cell Signaling | PAK4, PAK6, PIK3C2G, PRKCE, PRKCQ, PRKD3, RAC1 |
| CCR3 Signaling in Eosinophils | PAK4, PAK6, PIK3C2G, PRKCE, PRKCQ, PRKD3, RAC1 |
Ingenuity pathway analysis (IPA) revealed a key role for the Molecular Mechanisms of Cancer set of pathways. We analyzed the subset of genes whose knockdown in TNBC cells treated with MEK inhibitor AS703026 led to no projections in the 3D MCTS system and were growth inhibition in the 2D monolayer system (5.1%). Molecular Mechanisms of Cancer was a top-ranking pathway. Output data indicated that PI3K pathway-related genes are the most important target molecules for combination with MEK inhibitor AS703026. Pink color indicated-gene: target gene from 2D/3D siRNA screening analysis. Blue color indicated-gene: negatively regulated downstream molecule by inhibition of pink color indicated-target molecule. Yellow color indicated-gene: possible mechanism on apoptosis by inhibition of target genes from 2D/3D siRNA screening. XL-147: a selective and reversible class I PI3K inhibitor for PI3Kα/δ/γ.
Drug-Combination Effect in TNBC Cell Lines
To validate whether inhibition of the PI3K and MEK pathways has a synergistic anti-proliferation effect in TNBC, we tested 6 different subtypes of TNBC cell lines (BL1, BL2, IM, MSL, M, and LAR), plus an unclassified (UC) cell line, as defined in previous studies [14, 15]. We evaluated the anti-proliferation index of combination treatment using an ATP-based cell viability assay, CellTiter-Blue reagent. When cells were treated with the combination of SAR245409 and AS703026 for 72 h, all tested cell lines showed IC50 values in the 0.3 - 3.0 μM range. In particular, we observed a significant shift in the IC50 value of both SAR245409 and AS703026 concentration in some BL2- and MSL-subtype cell lines (Table 5, Figure S2). We next used the CalcuSyn program to analyze the fraction of cells affected by combination treatment with a clinically relevant dose (0.5 - 2.0 μM). Combinational index (CI) and fractional index (Fa) results suggested that SAR245409 and AS703026 enhanced the anti-growth effect in TNBC cell lines, specifically in the BL2 and MSL subtypes (Table 6).
IC50 values for single and combinational treatment with AS703026 and SAR245409 in TNBC cells under 2D culture conditions.
| Subtype | TNBC cell line | Single treatment | Combinational treatment | |
|---|---|---|---|---|
| SAR245409 (IC50, µM) | AS703026 (IC50, µM) | SAR245409:AS703026 1:1 mix ratio, (IC50, µM) | ||
| Basal-like | HCC1937 (BL1) | 1.07 | > 20 | 1 |
| MDA-MB-468 (BL1) | 1.98 | 2.5 | 1.2 | |
| HCC1187 (IM) | 0.25 | 1.17 | 0.3 | |
| HCC70 (BL2) | 0.37 | 12.7 | 0.38 | |
| SUM149 (BL2) | 1.7 | 0.95 | 0.32 | |
| HCC1806 (BL2) | 2.2 | 12.5 | 0.9 | |
| Mesenchymal-like | HS578T (MSL) | 0.5 | 4.84 | 0.52 |
| MDA-MB-157 (MSL) | 6.48 | > 20 | 2.76 | |
| SUM159 (MSL) | 7.3 | > 20 | 2.78 | |
| MDA-MB-436 (MSL) | 0.28 | 2.7 | 1 | |
| MDA-MB-231 (MSL) | 1.36 | 0.6 | 0.12 | |
| BT-549 (M) | 0.56 | > 20 | 1.2 | |
| Luminal androgen receptor | MDA-MB-453 | 0.18 | 6.32 | 1.04 |
| Unclassified | BT-20 | 1.2 | 9 | 0.58 |
Six different subtypes of TNBC were identified based on gene expression profiles: basal-like 1 and 2 (BL1 and BL2), immunomodulatory (IM), mesenchymal (M), mesenchymal stem-like (MSL), and luminal androgen receptor (LAR) [14].
Combinational index (CI), a quantitative measure of the degree of drug interaction, and fractional index (Fa), the fraction of cells affected by the treatment, for the drug combination AS703026 and SAR245409 (1:1 mix ratio).
| Cell line and TNBC subtype | CI/Fa values for different concentrations of the drugs (1:1 mix ratio) | |||||
|---|---|---|---|---|---|---|
| 0.5 µM | 1.0 µM | 2.0 µM | ||||
| Fa | CI | Fa | CI | Fa | CI | |
| HCC1937 (BL1) | 0.43 | 0.174 | 0.45 | 0.813 | 0.59 | 0.724 |
| MDA-MB-468 (BL1) | 0.4 | 0.795 | 0.54 | 0.635 | 0.68 | 0.572 |
| HCC1187 (IM) | 0.72 | 0.405 | 0.74 | 0.603 | 0.81 | 0.49 |
| HCC70 (BL2) | 0.75 | 0.302 | 0.86 | 0.24 | 0.94 | 0.135 |
| SUM149 (BL2) | 0.78 | 0.079 | 0.84 | 0.079 | 0.89 | 0.081 |
| HCC1806 (BL2) | 0.51 | 0.216 | 0.62 | 0.263 | 0.72 | 0.325 |
| HS578T (MSL) | 0.61 | 0.517 | 0.75 | 0.459 | 0.87 | 0.341 |
| MDA-MB-157 (MSL) | 0.23 | 0.155 | 0.29 | 0.233 | 0.52 | 0.284 |
| SUM159 (MSL) | 0.32 | 0.078 | 0.55 | 0.076 | 0.65 | 0.112 |
| MDA-MB-436 (MSL) | 0.57 | 0.91 | 0.84 | 0.659 | 0.91 | 0.595 |
| MDA-MB-231 (MSL) | 0.88 | 0.025 | 0.87 | 0.053 | 0.96 | 0.055 |
| BT-549 (M) | 0.51 | 0.794 | 0.61 | 0.899 | 0.72 | 1 |
| MDA-MB-453 (LAR) | 0.79 | 0.44 | 0.85 | 0.498 | 0.92 | 0.402 |
| BT-20 (UN)* | 0.51 | 0.317 | 0.68 | 0.25 | 0.82 | 0.19 |
*UN, unstable (those TNBCs that do not fall consistently into one of the six subtypes). CI value: <0.1 indicates very strong synergism; 0.10-0.30, strong synergism; 0.31-0.70, synergism; 0.71-0.85, moderate synergism; 0.86-0.90, slight synergism; 0.91-1.10, nearly additive; 1.11-1.20, slight antagonism; 1.21-1.45, moderate antagonism; 1.46-3.30, antagonism; 3.31-10, strong antagonism; >10, very strong antagonism.
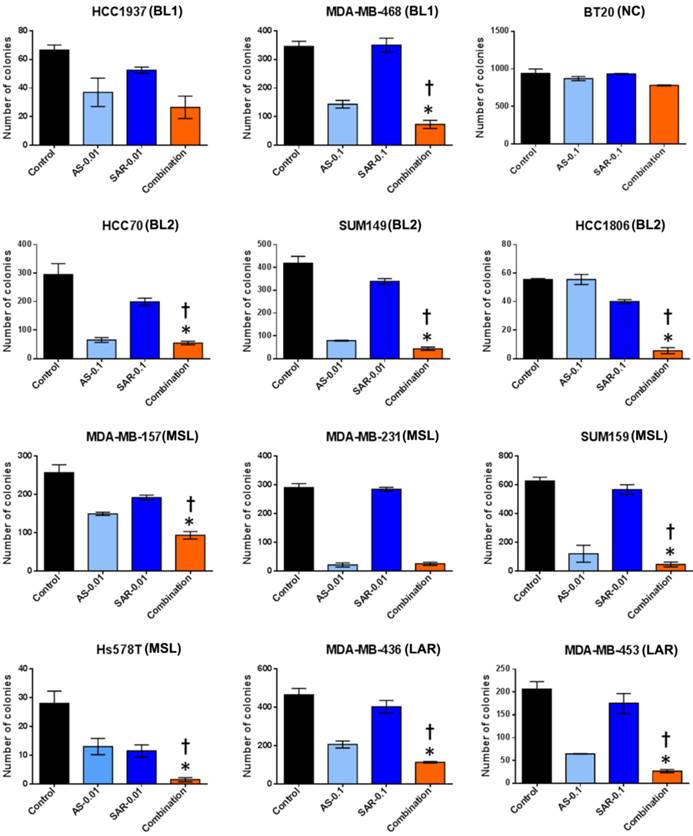
Next, to discover whether the combination of SAR245409 and AS703026 enhances the anti-tumorigenic effect in TNBC cells, we performed in vitro tumorigenicity assays using soft-agar colony formation. We observed that when cells were treated with IC50 concentrations (1 µM) of SAR245409 and AS703026, more than 90% of cells did not form colonies (Figure S3). Thus, at these concentrations, it was difficult to evaluate the synergistic anti-tumor effect of combination treatment. Therefore, we selected doses that were one-tenth or one-hundredth lower than the initial concentrations (0.1 µM or 0.01 µM) for treatment. As shown in Figure 4, colony numbers were significantly lower with combination treatment than with single treatment in most tested TNBC cell lines except BT-20 cell line.
The combination of AS703026 with SAR245409 significantly enhanced antitumor effect in anchorage independent colony formation assay (soft agar assay). Breast cancer cell lines were overlaid onto the bottom agar layer (0.8%) with the indicated drugs (µM) and incubated for 3-6 weeks. For visualizing, colonies were stained with 200 μl of MTT (1 mg/ml) solution for 2 h and counted using the GelCount colony-counting system according to the manufacturer's instructions. Statistical significance was evaluated by t test using GraphPad Prism software. Error bars represent the standard deviation of three independent experiments. *, p <0.05 combination compared with SAR245409; †, p <0.01 combination compared with AS703026. BL1: basal-like 1, BL2: basal-like 2, MSL: mesenchymal stem-like, LAR: luminal androgen receptor, UC: unclassified.
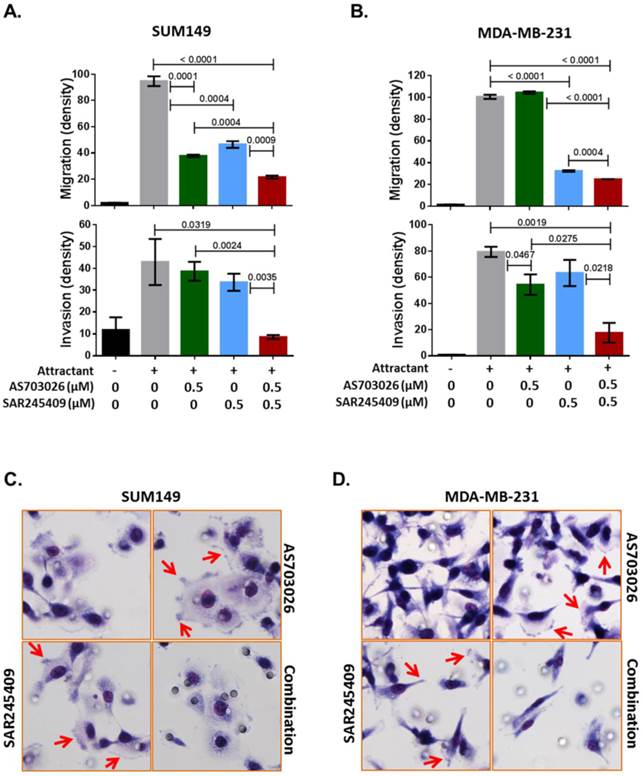
Our Ingenuity pathway analysis revealed that p21-activated kinase (PAK) group II, PAK4 and PAK6, and Rho GTPase RAC1 were the most common genes from the 3D siRNA screening assays. Previous studies indicated that PAK4 and RAC1 are key regulators of not only migration/invasion but also tumorigenicity in breast cancer [16-20]. Therefore, we further tested whether the combination of SAR245409 and AS703026 inhibits TNBC cell migration and invasion. As shown in Figures 5A and 5B, compared with single treatment, combination treatment with SAR245409 and AS703026 (0.5 µM) inhibited both migration and invasion significantly in both TNBC cell lines tested (p <0.001). PAK and RAC1 have been described as regulatory factors in cellular morphological formation of lamellipodia, membrane ruffling, and filopodia and stress fibers during migration or invasion [21]. We observed that control or single-treatment cells showed well-developed lamellipodia or filopodia, as indicated by the arrows in Figures 5C and 5D; however, combination treatment cells had restricted lamellipodium and filopodium development. These data indicated that combination treatment of SAR245409 and AS703026 inhibited migration/invasion by inhibiting the small GTPase signaling pathway. Also, the conventional assay method successfully reproduced the 3D RNAi screening result.
The combination of AS703026 and SAR245409 suppressed SUM149 and MDA-MB-231 cell migration and invasion capability. (A, B) Migration and invasion assay results. P values are indicated between bars; statistical significance was evaluated by t test using GraphPad Prism software. Error bars represent the standard deviation of three independent experiments. (C, D) Images for SUM149 and MDA-MB-231 cells subjected to a migration assay with or without drugs for 6 h. Cells were fixed and stained with Diff-Quik solution. Arrows indicate filopodia or membrane ruffling formations.
Discussion
In the present study, we used high-throughput 2D and 3D RNAi screening to identify targets whose silencing induced growth inhibition or projection formation of TNBC cells treated with AS703026. Our comprehensive analysis revealed the PI3K pathway as an important target in TNBC cell growth and migration/invasion under AS703026 treatment. We validated that compared with single-agent treatment, the combination of AS703026 and PI3K inhibitor SAR245409 enhanced TNBC cell growth inhibition as well as inhibition of migration and invasion ability. These data indicate that combination of AS703026 and SAR245409 could be a candidate strategy for inhibiting TNBC cell growth and metastasis.
It has been demonstrated by many studies that 2D monolayer cancer cell culture is a somewhat artificial model and does not fully represent the characteristics of 3D solid tumors [22]. Our group also observed that gene profiling did not perfectly match between TNBC cell line microarray and TNBC patient microarray data using Lehmann and Bauer's analysis algorithm [14, 15]. Li et al reported that most anticancer drugs and molecular targeted therapies have shown promise in preclinical studies; however, cancer patients have shown a much lower response rate to the drugs compared to in vitro chemosensitivity [23]. This low response rate to anti-cancer drugs has been attributed to the tumor microenvironment [24]. The 3D MCTSs are of intermediate complexity between in vivo tumors and monolayer cultures, and their growth emulates the heterogeneity of solid tumors; necrosis and radiation-resistant hypoxic regions often occur at the center of solid tumors due to poor vasculature and subsequent lack of oxygen supply [25]. Our unique multicellular spheroid models are an effective 3D cell culture model that takes advantage of the natural tendency of cells to aggregate.
The ability of multicellular spheroids to simulate a tumor-like environment, together with the ease by which these models can be applied in high-throughput screens [26, 27], has resulted in the use of spheroids to study drug efficacy and penetration as well as 3D cellular interactions [25, 28-36]. For example, several in vitro lines of evidence indicate that the ribosomal S6 kinase (RSK) family promotes head and neck squamous cell carcinoma cell metastasis [37], breast epithelial cell motility [38], and cell adhesion [39]. Since RSKs are activated by the MAPK pathway [40] and large proportion of breast cancer cells show elevated EGFR-MAPK pathway activity [41], RSKs are recognized as a target for inhibiting migration and invasion processing in breast cancer. In contrast to expectations, 2D/3D RNAi screening revealed that the RSK gene is not correlated with TNBC cell projection formation, meaning there was no effect on the cells' migration. We confirmed this result using pan-RSK inhibitor (BI-D1870) with two TNBC cell lines; we did not observe an inhibition effect on migration and invasion ability with this RSK inhibitor (Figure S4). This result indicates that our comprehensive RNAi screening and morphological analysis is able to identify target molecules that might effectively prevent cell growth and migration/invasion in an in vivo setting.
Compared to other breast cancer types, TNBCs have more aggressive behavior that tends to metastasize and survive, resulting in a high distant-recurrence rate [42, 43]. Among the 6 different subtypes of TNBC, the MSL subtype displays unique ontologies related to cell motility, extracellular matrix interaction, inositol phosphate metabolism, EGFR, and ERK1/2 signaling [14]. Owing to prominent EMT and stem cell-like properties, the MSL subtype showed decreased distant-metastasis-free survival compared to other TNBC subtypes [15]. Several articles have also reported that elevated tyrosine kinase receptor, activated PI3K/AKT/mTOR and MAPK/ERK pathways, and mutated PIK3CA are frequently observed in TNBC, specifically in metaplastic breast cancers [44-46]. Of note, the MSL-subtype MDA-MB-231 cells used in the 2D/3D RNAi screening displayed target genes closely related to ErbB and the migration/invasion pathway. We identified PI3K and PAK4/6 pathways as top candidates for combination with AS703026. Current evidence indicates that the PAK4/6 pathway is activated via either the PI3K/AKT or the MAPK/ERK pathway and enhances processes associated with progression of cancer such as proliferation, survival, metastasis, and EMT [47-50]. In the process of EMT, including migration/invasion, PAKs regulate cell polarization, resulting in formation of pseudopodia and membrane ruffles [51]. PAK4 is highly overexpressed in metastatic breast cancer cell lines [52, 53], and our data showed strong inhibition of pseudopodia and membrane ruffles by the AS703026 and SAR245409 combination. These findings suggest that metastatic TNBC with a high PAK4 level may be well suited to a new targeted therapy opportunity with a MEK inhibitor and PI3K inhibitor. Further investigation is needed to translate our result into in vivo conditions to determine whether the combination of AS703026 and SAR245409 can suppress tumor growth and metastasis effectively. Such data would provide strong justification for future clinical trials to target metastatic TNBC.
In summary, our results suggest that integrated and multi-system RNAi screening methods and analysis narrow the inherent difference between in vitro and in vivo conditions, providing powerful high-throughput assays that are able to identify anticancer drugs as single or combinational agents. In testing these methods, we have demonstrated that combining AS703026 and SAR245409 effectively suppressed proliferation and colony formation as well as migration/invasion of TNBC cells. We look forward to advancing the field of therapeutic development with AS703026 and SAR245409 for patients with metastatic TNBC.
Materials and Methods
Therapeutic Agents and Cell Lines
AS703026 and SAR245409 were provided by EMD Serono Research & Development Institute, Inc. and Sanofi Inc., respectively. Human breast cancer cell lines MDA-MB-231, HCC1937, MDA-MB-468, HCC1187, HCC70, BT-549, Hs578T, MDA-MB-157, MDA-MB-436, MDA-MB-231, MDA-MB-453, and BT-20 were purchased from ATCC. Human breast cancer cell lines SUM149 and SUM159 were purchased from Asterand. We authenticated all of the cell lines by genotyping through MD Anderson Cancer Center's Characterized Cell Line Core Facility.
High-Throughput siRNA Screening
High-throughput RNAi screens for target identification and synthetic lethality were performed following stringent standard operating procedures at the RNAi screening facility at MD Anderson Cancer Center.[54-57] MDA-MB-231 cells were grown as either a 3D multicellular tumor spheroid (MCTS) cell culture system or as a 2D monolayer cell culture system. MDA-MB-231 cells demonstrate a unique 3D morphology comprising projections suggestive of epithelial-mesenchymal transition (EMT)-mediated invasion processes that are related to the cell line's spontaneous metastasis capability [11, 12]. Both a 2D monolayer culture and a 3D MCTS culture of MDA-MB-231 cells were transfected, utilizing the reverse transfection procedure with an siGENOME SMARTpool kinome siRNA library comprising a pool of 4 individual siRNA duplexes targeting the individual kinases (Dharmacon). The 3D MCTS were generated by growing the cells on non-matrix transparent cycloolefin resinous sheets comprising nanoscale indented patterns with a 500-nm line width, 1-mm line depth, and 10-mm to 500-nm line spacing [58]. The screen performed in the 2D system was designed to identify genes that affect tumor viability, while the screen performed in the 3D system was designed to identify genes that affect tumor viability as well as modulate the outgrowth of cellular projections, which reflect cell motility and invasive capability. Briefly, for the screen performed utilizing the 2D monolayer cell culture, 10 μl of 200 nM siRNA was mixed with 10 μl of a lipid (0.07 μl of DharmaFECT 1 reagent in 10 μl Opti-MEM medium) for 20 min in a well of a 384-well plate (Corning) and overlaid with 30 μl of cell suspension (5,000 cells) in antibiotic-free cell line-specific media. The final concentration of siRNA in both models was 40 nM per well. siControl ON-TARGETplus siRNA number 4 (siOTP4, Dharmacon) and siTOX ON-TARGETplus (Dharmacon) were used as the negative and positive transfection controls, respectively, in all experiments. In the case of the 3D spheroids, 20 μl of 200 nM siRNA was mixed with 20 μl of a lipid (0.24 μl of DharmaFECT 1 reagent in 20 μl Opti-MEM medium) (Invitrogen) for 20 min in a well of a 96-well NanoCulture plate (SCIVAX Inc.) and overlaid with 60 μl of cell suspension (10,000 cells) in antibiotic-free cell line-specific media. The screen using the 2D monolayer cell culture was performed in triplicate, while the screen using the 3D spheroid cell culture was performed in duplicate. Forty-eight hours after transfection, MEK inhibitor AS703026 was added at a final concentration of 75 nM (the IC20 value) to one set of transfected plates, and a similar volume of DMSO (> 0.1%) was added to the other set of transfected plates. After 72 h of incubation, the cells growing in 3D spheroids were imaged using an In Cell Analyzer 1000 (GE). All images were analyzed for morphological changes following the creation of study-specific programs utilizing GE In Cell Investigator software. The viability of the cells growing in the 2D monolayer or 3D spheroid cultures was determined using the CellTiter-Glo luminescent cell viability assay (Promega) according to the manufacturer's instructions.
Classification of 3D siRNA Culture Outcome
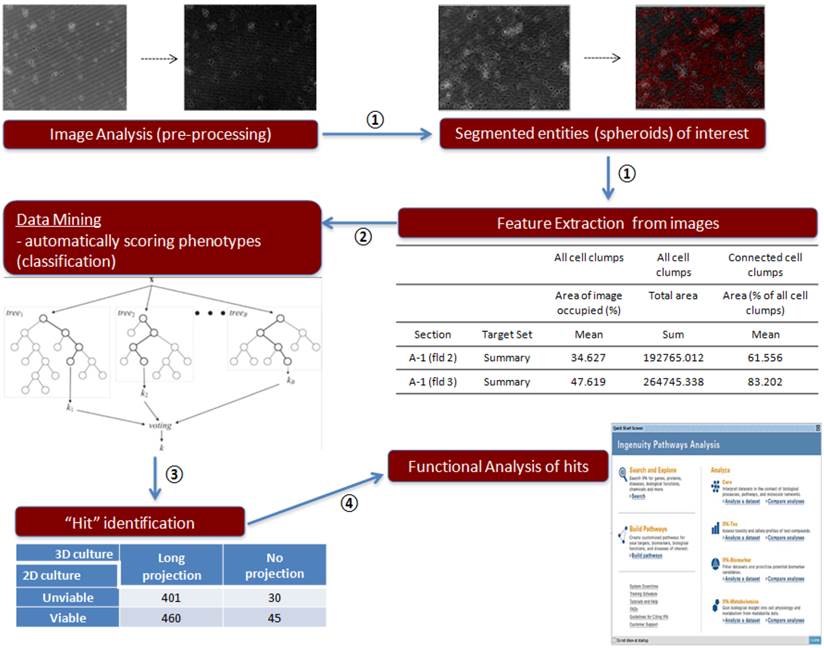
To analyze 3D siRNA screening result, we followed below four classification steps (summarized in Figure 2).
Image analysis procedure of 3D culture siRNA screening outcome. Step 1: Imaging analysis and data extraction, ①; Step 2: Data mining, ②; Step 3: Contingency table, ③; Step 4: Functional analysis of genes, ④
Step 1: imaging analysis and data extraction
Since the task of manually annotating the cells into different phenotypic groups is laborious and time consuming, we examined a machine-learning approach to solve this issue: the image-derived features were used to develop a statistical classifier that can predict an expert-annotated class label. A difference in projection type can be used for imaging classifying system. Field-level images were processed using GE IN Cell Investigator software. Briefly, images were pre-processed to adjust contrast and remove artifacts. Subsequently, segmentation routines were used to segment blobs of cells, followed by measurement of morphological parameters such as area, form factor, perimeter, and diameter. The final data output from the analysis tool was a matrix in which each row represents each field within a well, and the columns represented the various morphological features (area, perimeter, diameter, form factor). A board-certified breast medical oncologist (NTU) annotated a subset of images as “long projection”, “no projection”, and “dead” phenotypes. Based on this annotation, a classification model was built that can discriminate long-projection and no-projection phenotypes. Using the GE IN Cell Analyzer tool, we measured “cell bodies”, representing entities after segmentation, and “cell clumps”, representing entities before segmentation. These morphological features were computed for each field in the well through the following nine measurements: 1) total area of cell bodies, 2) mean area of cell bodies, 3) number of cell bodies, 4) mean form factor of cell bodies, 5) mean diameter of cell bodies, 6) mean perimeter of cell bodies, 7) mean % area of image occupied by all cell clumps, 8) total area of cell clumps, and 9) mean area of connected cell clumps (% of all cell clumps).
Step 2: data mining
To automatically score cells based on 'projection' based phenotypes, we used a random forest classifier. A “random forest” is an ensemble of classifiers obtained by aggregating (bagging) several classification trees. Each data point (represented as an input vector) is classified based on the majority vote gained by that vector across all the “trees” of the forest. Each tree of the forest is “grown” in the following way:
- A bootstrapped sample (with replacement) of the training data is used to grow each tree. The sampling for bootstrapped data selection is done individually at each tree of the forest.
- For an M-dimensional input vector, a random subspace of m (≪ M) dimensions is selected, and the best split on this subspace is used to split the node. This is done for all nodes of the tree.
Before sampling for aggregating process, one-third of the cases are kept “out of the training bag.” These out-of-bag (OOB) data are used to obtain an unbiased estimate of the classification error as trees are added to the forest. They are also used to get estimates of variable importance. Several interesting insights into the data are available using random forest analysis. The variable importance plot yields the variables that are most discriminatory for classification under the “ensemble of trees” classifier. This importance is based on two measures: Gini index and decrease in accuracy. The Gini index is an entropy-based criterion that measures the purity of a node in the tree, while the decrease in accuracy simply looks at the relative contribution of each variable to the accuracy of the classifier. For our studies, we used the randomForest package for R. The classifier performance on the individual data was assessed via a confusion matrix.
Step 3: contingency table
Further, a contingency table for the genes was built in the following manner:
- For the 2D setting, we examined the viability of TNBC cells with gene knockdown; we compared cells treated with AS703026 vs. untreated cells. Genes that led to a reduction in viability less than vehicle control were designated “growth inhibition”, whereas the rest were designated “no growth inhibition”.
- For the 3D setting, using the no-projection vs. long-projection classifier, each gene was designated as a “no-projection” gene if its knockdown led to loss of the projection phenotype. Otherwise, it was designated as a “long-projection” gene.
Using definitions from (i) and (ii) above, we populated a contingency table across the 2D (viability) and 3D (no-projection phenotype) settings.
Step 4: Functional Analysis of Genes
Network and functional analysis of the genes inducing the no-projection phenotype was carried out using the Ingenuity Pathway Analysis tool. The tool provides output comprising the top-ranking pathways involving these genes (based on a Fisher exact test). We explored both “Direct and Indirect Interactions” using “Experimentally Verified Predictions” in the Ingenuity Knowledge Base (Genes and Endogenous Chemicals).
Ingenuity Pathway Analysis (IPA)
IPA was used to derive functional and pathway information from the list of genes (“hits”) associated with the growth inhibition and no-projection phenotypes. Further, IPA was also used for network analysis of drug-induced perturbation of pathway activity. More details are in the Supplementary Information. To identify targetable genes that synergize with MEK inhibitor action to drive reduction in tumor growth morphology and viability, we used the Molecule Activity Predictor (MAP) and upstream drug activity analysis functionality in IPA [13]. Briefly, based on the top-ranked pathways corresponding to the gene hits, we used the “Overlay” feature in IPA to overlay various drugs that could perturb the activity of these molecules. Further, we perturbed these molecules using the MAP feature in IPA.
In Vitro Cell Proliferation Assay and Analysis of Combinational Drug Effect
Cells were treated with the drug combination and analyzed using a CellTiter-Blue assay (Promega) according to the manufacturer's instructions. Drug synergy was determined by the isobologram and combination-index methods using CalcuSyn software 2.1 (Biosoft) [59]. Detailed methods are described in the Supplementary Information.
Anchorage independent colony formation assay (Soft Agar Assay)
TNBC cells (2×10³ cells/well) were resuspended in 2 ml of 0.4% agarose solution in DMEM/F12 or F12 medium (Sigma) and overlaid onto the bottom agar layer (0.8%) in 6-well plates. The plates were incubated for 3 to 6 weeks with the two drugs, and colonies were stained with 200 μl of MTT solution (Sigma, 1 mg/ml) for 2 h. The number of stained colonies greater than 80 μm in diameter was counted using the GelCount colony-counting system (Oxford Optronix) according to the manufacturer's instructions. Means and standard deviations were calculated on the basis of the colony counts from triplicate wells.
Migration and Invasion Assay
Migration assays were performed in triplicate using a chemotaxis chamber (24-well inserts, 8-µm pore size, BD Biosciences). Cells were harvested and resuspended in DMEM/F12 media with 1 mg/ml bovine serum albumin (Sigma). 1×10⁵ cells/350 μl were plated on upper chambers, and bottom wells were filled with 750 μl of DMEM/F12 media that included 2% FBS and 100 ng/ml EGF (Invitrogen) as an attractant to induce migration or invasion. Six hours later, membranes were fixed and stained with Diff-Quik solutions (Dade Behring, Inc.). Chemotaxis was quantitated by the ImageJ program. For invasion, 50 µl of 10% Matrigel solution was coated on the upper chamber for 1 h at 37ºC. Cells were allowed to invade for 24 h.
Statistical Analysis
For experimental outcomes, descriptive statistics (mean and standard deviation) were summarized for each group. An analysis of variance model was used to compare the mean outcome values among the tested groups. Statistical analyses were performed using an unpaired t-test with Prism version 5 (GraphPad Software). P values of <0.05 were considered statistically significant.
Supplementary Material
Figures S1-S4.
Abbreviations
TNBC: Triple-negative breast cancer; 2D: two-dimensional; 3D: three-dimensional; MEK: mitogen-activated protein kinase kinase; HER2: human epidermal growth factor receptor 2; BL1: basal-like 1; BL2: basal-like 2; IM: immunomodulatory; M: mesenchymal; MSL: mesenchymal stem-like; LAR: luminal androgen receptor; RNAi: RNA interference; MCTS: multicellular tumor spheroid; EMT: epithelial-mesenchymal transition; MAP: Molecule Activity Predictor; IPA: Ingenuity Pathway Analysis; PAK: p21-activated kinase; Rac 1: Ras-related C3 botulinum toxin substrate 1; RSK: ribosomal S6 kinase.
Acknowledgements
Naoto Ueno was supported by EMD Serono Research & Development Institute, Inc., the Morgan Welch Inflammatory Breast Cancer Research Program, the State of Texas Rare and Aggressive Breast Cancer Research Program, and the National Institutes of Health (CA123318 and MD Anderson's Cancer Center Support Grant [CCSG], CA016672 [the Characterized Cell Line Core Facility and RNAi Screening Service]). Arvind Rao was supported by the National Institutes of Health (CCSG CA016672 [Bioinformatics Shared Resource] and 5R00CA139006 [PI: Chandra Bartholomeusz]), the Cancer Prevention and Research Institute of Texas High-Throughput Screening Program grant (RP110532), an MD Anderson Institutional Research Grant, and MD Anderson start-up funds. Chandra Bartholomeusz was supported by the National Institutes of Health (R00CA139006) and MD Anderson start-up funds. Geoffrey Bartholomeusz was supported by the Cancer Prevention and Research Institute of Texas High-Throughput Screening Program (RP110532-P3) and the National Institutes of Health (MDACC/CCSG CA016672 PI: Ronald DePinho). We are grateful to Tony Zucca and Robert Graves of GE Healthcare, who provided help with building the image analysis protocol in IN Cell Investigator. We thank Sunita Patterson of the Department of Scientific Publications at MD Anderson for editorial assistance.
Competing Interests
Samantha Goodstal is an employee of EMD Serono Research & Development Institute Inc. All other authors have no conflicts of interest to disclose.
References
1. Hudis CA, Gianni L. Triple-negative breast cancer: an unmet medical need. Oncologist. 2011;16(Suppl 1):1-11
2. Carey LA, Dees EC, Sawyer L. et al. The triple negative paradox: primary tumor chemosensitivity of breast cancer subtypes. Clin Cancer Res. 2007;13:2329-34
3. Foulkes WD, Smith IE, Reis-Filho JS. Triple-negative breast cancer. N Engl J Med. 2010;363:1938-48
4. Falschlehner C, Steinbrink S, Erdmann G. et al. High-throughput RNAi screening to dissect cellular pathways: a how-to guide. Biotechnol J. 2010;5:368-76
5. Charafe-Jauffret E, Ginestier C, Monville F. et al. Gene expression profiling of breast cell lines identifies potential new basal markers. Oncogene. 2006;25:2273-84
6. Neve RM, Chin K, Fridlyand J. et al. A collection of breast cancer cell lines for the study of functionally distinct cancer subtypes. Cancer Cell. 2006;10:515-27
7. Li C, Kato M, Shiue L. et al. Cell type and culture condition-dependent alternative splicing in human breast cancer cells revealed by splicing-sensitive microarrays. Cancer Res. 2006;66:1990-9
8. Kenny PA, Lee GY, Myers CA. et al. The morphologies of breast cancer cell lines in three-dimensional assays correlate with their profiles of gene expression. Mol Oncol. 2007;1:84-96
9. Hess MW, Pfaller K, Ebner HL. et al. 3D versus 2D cell culture implications for electron microscopy. Methods Cell Biol. 2010;96:649-70
10. Pampaloni F, Reynaud EG, Stelzer EH. The third dimension bridges the gap between cell culture and live tissue. Nat Rev Mol Cell Biol. 2007;8:839-45
11. Olmeda D, Moreno-Bueno G, Flores JM. et al. SNAI1 is required for tumor growth and lymph node metastasis of human breast carcinoma MDA-MB-231 cells. Cancer Res. 2007;67:11721-31
12. Gjerdrum C, Tiron C, Hoiby T. et al. Axl is an essential epithelial-to-mesenchymal transition-induced regulator of breast cancer metastasis and patient survival. Proceedings of the National Academy of Sciences of the United States of America. 2010;107:1124-9
13. Kramer A, Green J, Pollard J Jr. et al. Causal analysis approaches in Ingenuity Pathway Analysis. Bioinformatics. 2014;30:523-30
14. Lehmann BD, Bauer JA, Chen X. et al. Identification of human triple-negative breast cancer subtypes and preclinical models for selection of targeted therapies. J Clin Invest. 2011;121:2750-67
15. Masuda H, Baggerly KA, Wang Y. et al. Differential response to neoadjuvant chemotherapy among 7 triple-negative breast cancer molecular subtypes. Clin Cancer Res. 2013
16. Minden A. The pak4 protein kinase in breast cancer. ISRN Oncol. 2012;2012:694201
17. Wong LE, Chen N, Karantza V. et al. The Pak4 protein kinase is required for oncogenic transformation of MDA-MB-231 breast cancer cells. Oncogenesis. 2013;2:e50
18. Ma J, Xue Y, Liu W. et al. Role of activated rac1/cdc42 in mediating endothelial cell proliferation and tumor angiogenesis in breast cancer. PLoS One. 2013;8:e66275
19. Koh MS, Moon A. Activation of H-Ras and Rac1 correlates with epidermal growth factor-induced invasion in Hs578T and MDA-MB-231 breast carcinoma cells. Biochem Biophys Res Commun. 2011;406:25-9
20. Wells CM, Jones GE. The emerging importance of group II PAKs. Biochem J. 2010;425:465-73
21. Hall A, Paterson HF, Adamson P. et al. Cellular responses regulated by rho-related small GTP-binding proteins. Philos Trans R Soc Lond B Biol Sci. 1993;340:267-71
22. Lama R, Zhang L, Naim JM. et al. Development, validation and pilot screening of an in vitro multi-cellular three-dimensional cancer spheroid assay for anti-cancer drug testing. Bioorg Med Chem. 2013;21:922-31
23. Li J, Wientjes MG, Au JL. Pancreatic cancer: pathobiology, treatment options, and drug delivery. AAPS J. 2010;12:223-32
24. Correia AL, Bissell MJ. The tumor microenvironment is a dominant force in multidrug resistance. Drug Resist Updat. 2012;15:39-49
25. Elliott NT, Yuan F. A review of three-dimensional in vitro tissue models for drug discovery and transport studies. J Pharm Sci. 2011;100:59-74
26. Ivascu A, Kubbies M. Rapid generation of single-tumor spheroids for high-throughput cell function and toxicity analysis. J Biomol Screen. 2006;11:922-32
27. Zhang X, Wang W, Yu W. et al. Development of an in vitro multicellular tumor spheroid model using microencapsulation and its application in anticancer drug screening and testing. Biotechnol Prog. 2005;21:1289-96
28. Durand RE. Multicell spheroids as a model for cell kinetic studies. Cell Tissue Kinet. 1990;23:141-59
29. Durand RE, Olive PL. Evaluation of bioreductive drugs in multicell spheroids. Int J Radiat Oncol Biol Phys. 1992;22:689-92
30. Durand RE, Olive PL. Tumour cell kinetics and heterogeneity: insights from multicell spheroids. BJR Suppl. 1992;24:79-83
31. Groebe K, Erz S, Mueller-Klieser W. Glucose diffusion coefficients determined from concentration profiles in EMT6 tumor spheroids incubated in radioactively labeled L-glucose. Adv Exp Med Biol. 1994;361:619-25
32. Freyer JP, Sutherland RM. Determination of diffusion constants for metabolites in multicell tumor spheroids. Adv Exp Med Biol. 1983;159:463-75
33. Nederman T, Acker H, Carlsson J. Penetration of substances into tumor tissue: a methodological study with microelectrodes and cellular spheroids. In Vitro. 1983;19:479-88
34. Nederman T, Carlsson J, Kuoppa K. Penetration of substances into tumour tissue. Model studies using saccharides, thymidine and thymidine-5'-triphosphate in cellular spheroids. Cancer Chemother Pharmacol. 1988;22:21-5
35. Nederman T, Carlsson J, Malmqvist M. Penetration of substances into tumor tissue--a methodological study on cellular spheroids. In Vitro. 1981;17:290-8
36. Olive PL, Durand RE. Penetration of AF-2 and 4NQO into multicell spheroids. Environ Mutagen. 1983;5:553-63
37. Kang S, Elf S, Lythgoe K. et al. p90 ribosomal S6 kinase 2 promotes invasion and metastasis of human head and neck squamous cell carcinoma cells. J Clin Invest. 2010;120:1165-77
38. Doehn U, Hauge C, Frank SR. et al. RSK is a principal effector of the RAS-ERK pathway for eliciting a coordinate promotile/invasive gene program and phenotype in epithelial cells. Mol Cell. 2009;35:511-22
39. Moh MC, Shen S. The roles of cell adhesion molecules in tumor suppression and cell migration: a new paradox. Cell Adh Migr. 2009;3:334-6
40. Romeo Y, Zhang X, Roux PP. Regulation and function of the RSK family of protein kinases. Biochem J. 2012;441:553-69
41. Bartholomeusz C, Gonzalez-Angulo AM, Liu P. et al. High ERK protein expression levels correlate with shorter survival in triple-negative breast cancer patients. Oncologist. 2012;17:766-74
42. Rakha EA, Chan S. Metastatic triple-negative breast cancer. Clinical oncology. 2011;23:587-600
43. Dent R, Trudeau M, Pritchard KI. et al. Triple-negative breast cancer: clinical features and patterns of recurrence. Clin Cancer Res. 2007;13:4429-34
44. Hennessy BT, Gonzalez-Angulo AM, Stemke-Hale K. et al. Characterization of a naturally occurring breast cancer subset enriched in epithelial-to-mesenchymal transition and stem cell characteristics. Cancer Res. 2009;69:4116-24
45. Shah SP, Roth A, Goya R. et al. The clonal and mutational evolution spectrum of primary triple-negative breast cancers. Nature. 2012;486:395-9
46. Montero JC, Esparis-Ogando A, Re-Louhau MF. et al. Active kinase profiling, genetic and pharmacological data define mTOR as an important common target in triple-negative breast cancer. Oncogene. 2014;33:148-56
47. Fu X, Feng J, Zeng D. et al. PAK4 confers cisplatin resistance in gastric cancer cells via PI3K/Akt- and MEK/Erk-dependent pathways. Bioscience reports. 2014
48. Zhang HJ, Siu MK, Yeung MC. et al. Overexpressed PAK4 promotes proliferation, migration and invasion of choriocarcinoma. Carcinogenesis. 2011;32:765-71
49. Radu M, Semenova G, Kosoff R. et al. PAK signalling during the development and progression of cancer. Nature reviews Cancer. 2014;14:13-25
50. Pitts TM, Kulikowski GN, Tan AC. et al. Association of the epithelial-to-mesenchymal transition phenotype with responsiveness to the p21-activated kinase inhibitor, PF-3758309, in colon cancer models. Frontiers in pharmacology. 2013;4:35
51. Heckman CA, Demuth JG, Deters D. et al. Relationship of p21-activated kinase (PAK) and filopodia to persistence and oncogenic transformation. J Cell Physiol. 2009;220:576-85
52. Callow MG, Clairvoyant F, Zhu S. et al. Requirement for PAK4 in the anchorage-independent growth of human cancer cell lines. J Biol Chem. 2002;277:550-8
53. Liu Y, Xiao H, Tian Y. et al. The pak4 protein kinase plays a key role in cell survival and tumorigenesis in athymic mice. Molecular cancer research: MCR. 2008;6:1215-24
54. Ahmed AA, Lu Z, Jennings NB. et al. SIK2 is a centrosome kinase required for bipolar mitotic spindle formation that provides a potential target for therapy in ovarian cancer. Cancer Cell. 2010;18:109-21
55. Bianchini G, Iwamoto T, Qi Y. et al. Prognostic and therapeutic implications of distinct kinase expression patterns in different subtypes of breast cancer. Cancer Res. 2010;70:8852-62
56. Ahmed AA, Wang X, Lu Z. et al. Modulating microtubule stability enhances the cytotoxic response of cancer cells to Paclitaxel. Cancer Res. 2011;71:5806-17
57. Sheveleva EV, Landowski TH, Samulitis BK. et al. Imexon induces an oxidative endoplasmic reticulum stress response in pancreatic cancer cells. Molecular cancer research: MCR. 2012;10:392-400
58. Yoshii Y, Waki A, Yoshida K. et al. The use of nanoimprinted scaffolds as 3D culture models to facilitate spontaneous tumor cell migration and well-regulated spheroid formation. Biomaterials. 2011;32:6052-8
59. Zhang C, Zhai S, Li X. et al. Synergistic action by multi-targeting compounds produces a potent compound combination for human NSCLC both in vitro and in vivo. Cell Death Dis. 2014;5:e1138
Author contact
![]() Corresponding authors: Arvind Rao, Ph.D., arupporeorg, Tel: 1-713-794-1394; Fax: 1-713-563-4242. Geoffrey Bartholomeusz, Ph.D., gbartholorg, Tel: 1-713-745-6168; Fax: 1-713-794-4385. Naoto Ueno, M.D., Ph.D., nuenoorg, Tel: 1-713-745-6168; Fax: 1-713-794-4385.
Corresponding authors: Arvind Rao, Ph.D., arupporeorg, Tel: 1-713-794-1394; Fax: 1-713-563-4242. Geoffrey Bartholomeusz, Ph.D., gbartholorg, Tel: 1-713-745-6168; Fax: 1-713-794-4385. Naoto Ueno, M.D., Ph.D., nuenoorg, Tel: 1-713-745-6168; Fax: 1-713-794-4385.