Impact Factor ISSN: 1837-9664

 Global reach, higher impact
J Cancer 2015; 6(8):795-811. doi:10.7150/jca.9883 This issue Cite
Research Paper
Comparative Correlation Structure of Colon Cancer Locus Specific Methylation: Characterisation of Patient Profiles and Potential Markers across 3 Array-Based Datasets
Ana Barat ![]() , Heather J. Ruskin
, Heather J. Ruskin
Centre for Scientific Computing and Complex Systems Modelling (Sci-Sym), School of Computing, Dublin City University, Ireland.
Received 2014-6-12; Accepted 2015-4-2; Published 2015-7-14
Abstract
Abnormal DNA-methylation is well known to play an important role in cancer onset and development, and colon cancer is no exception to this rule. Recent years have seen the increased use of large-scale technologies, (such as methylation microarray assays or specific sequencing of methylated DNA), to determine whole genome profiles of CpG island methylation in tissue samples. Comprehensive study of methylation array data from transcriptome high-throughput platforms permits determination of gene methylation markers, important for cancer profiling. Here, three large-scale methylation datasets for colon cancer have been compared to determine locus-specific methylation agreement. These data are from the GEO database, where colon cancer and apparently healthy adjacent tissues are represented by sample sizes 125 and 29 respectively in the first dataset, 24 of each in the second and 118 of each in the third. Several data analysis techniques have been employed, including Clustering, Discriminant Principal Component Analysis, Discriminant Analysis and ROC curves, in order (i) to obtain a better insight on the locus-specific concomitant methylation structures for these diverse data and (ii) to determine a robust potential marker set for indicative screening, drawn from all data taken together. The extent of the agreement between the analysed datasets is reported. Further, potential screening methylation markers, for which methylation profiles are consistent across tissue samples and several datasets, are highlighted and discussed.
Keywords: colon cancer, epigenetic events, promoter hypermethylation, mutation, multivariate data analysis, clustering, principal component analysis, discriminant analysis, biomarkers, screening.
Introduction
Cancer is characterised by major disruption in the main cell-cycle and cell-cell / cell- matrix mechanisms, governing molecular adhesion and regulation. Molecular events, such as abnormal gene expression and mutation of tumour suppressor genes, are pervasive in cells extracted from tumours or from tumour-neighbour tissue, [1]. In the last decade it has become increasingly obvious that epigenetic alterations, such as abnormal gene promoter methylation and histone modifications, are also heavily implicated in oncogenesis. Binding of methyl residues on DNA cytosines from CpG dinucleotides and histone tail modifications are generally implicit in changing chromatin conformation, leading in many cases to the chromatin being 'closed' and impeding the complex transcription process. Studies have repeatedly demonstrated that, for many genes, abnormal hypermethylation of CpG islands situated on or close to the promoter, is highly correlated with down regulation (or even loss) of gene expression.
Concomitant methylation of multiple CpG islands is a widely-reported phenomenon in cancer, with the extent of locus-specific methylation nevertheless subject to large variability. Studying concomitant methylation of multiple loci has proved to be important in the context of the ongoing effort to describe colon cancer subtypes. Colorectal cancers with high incidence of methylation at a subset of genomic loci, and enriched for BRAF mutations, are historically known as CpG island Methylator Phenotype (CIMP)-high and are well characterised, [2-6], while those with less wide-spread locus-specific methylation are less well characterised and it was subject to confusion and research whether colon cancer subgroups associated with KRAS mutations known as CIMP-low [2], CIMP2 [3], and IME (intermediate-methylation epigenotype [7] represented unique or distinct phenotypes in colorectal cancer [5, 6]. In addition, it was not clear whether CIMP-low and non-CIMP subgroups represented distinct phenotypes [2]. Moreover, determining the joint methylation was only possible, until recently, for a limited number of targets. The newer technologies, such as methylation-specific arrays or methylation-targeted sequencing (e.g. whole methylome - oriented sequencing such as Methylated DNA Immunoprecipitation Sequencing (MeDIP-Seq) or targeted Bisulfite Sequencing such as Bisulfite Sequencing of Chromatine Immunoprecipitated DNA (BisChIP-seq), allow assessment of joint methylation landscapes for large numbers of targets and can cover the whole genome. While high costs limit application of sequencing-based techniques to a few biological samples, methylation specific microarrays can be used for many, (even hundreds), providing a basis for exploration of jointly-methylated gene variability across patients. Using a microarray-based platform for 125 tumour samples, enabled Hinoue and colleagues [5] to demonstrate that a KRAS mutation-enriched CIMP-low subgroup did exist, and was characterised by hypermethylation of a subset of CIMP-high specific loci, (which tend not to be methylated in the so called non-CIMP subgroups). Similarly, Karpinski and co-workers [6] used a microarray-based platform to determine that the intermediate-methylation epigenotype (IME) subgroup (as identified by Yagi and colleagues [7]) actually corresponds more closely to non-CIMP/CIMP0 and that low-methylation epigenotype (LME) corresponds to CIMP-low; the opposite, in fact, of what was previously believed to apply.
In the present study, the objective is to compare locus-specific concomitant methylation in three published small to moderately large tumour cohorts to ascertain the concordance of the DNA methylation results, with the additional aim of proposing sets of robust marker candidates for colon cancer based on these datasets taken together. To this end, a range of different biostatistical techniques has been used to analyse methylation profiles across multiple patients, based on three large-scaled array-based datasets, (from the GEO1 repository, [8]). The study follows a 'bottom-up' approach. A preliminary detailed comparative analysis was initially performed on a preselected smaller set of genes, associated with frequent aberrant methylation in colon cancer, (and with methylation status known to be related to that of other cancer markers). For these genes, comparison of the joint methylation profiles across the tissues was performed, predominantly using graphical tools (i.e. clusters, heatmaps, principal component projections). The subset of genes for the preliminary analysis was selected, based on manually-curated historical data, (StatEpigen, [9]). Finally, the comparison of locus-specific methylation was extended to the full differentially methylated gene group for the three datasets and interesting correlations and potentially valuable CRC marker candidates were identified.
Methods
Microarray data
The large-scale datasets, considered here, all used the array-based platform Illumina Infinium HumanMethylation27 (HM27) and were downloaded from the NCBI's on-line resource Gene Expression Omnibus (GEO). Each set contains both samples of colon tumours and adjacent healthy tissues; D1: 125 and 29 primary colorectal tumours and adjacent non-tumour colonic mucosa samples respectively in GSE25062, [5], D2: 24 of both sample types in GSE29490, [10] and D3: 118 of both in GSE27130, [11]. The three datasets are summarised in Table 1.
Summary of datasets D1, D2 and D3, containing locus-specific methylation data for colon cancer and adjacent healthy looking tissues, obtained with the array-based platform Illumina Infinium HumanMethylation27 (HM27).
| D1 | D2 | D3 | |
|---|---|---|---|
| GEO ID | GSE25062 | GSE29490 | GSE27130 |
| Origin | Fresh-frozen surgically removed colonic specimens, Groene Hart Hospital, Gouda, The Netherlands or the Ontario Tumor Bank Network (The Ontario Institute for Cancer Research, Ontario, Canada). | Fresh-frozen surgically removed colonic specimens, Department of Pathology, Bangabandhu Sheikh Mujib Medical University (BSMMU), Dhaka, Bangladesh. | Fresh-frozen colonic specimens from patients treated at Samsung Med- ical Center (Seoul, Korea). |
| DNA extraction method | TRIzol Reagent (Invitrogen) | Puregene Core kit (Qiagen) | DNeasy Tissue kit (Qiagen) |
| Cell lines | 0 | 0 | 12 |
| Tumours | 125 | 24 | 118 |
| Adjacent tissue | 29 | 24 | 118 |
| No. loci selected for clustering | 48 | 24 | 43 |
Pre-processing steps included (i) averaging the methylation β-values2 across the replicated array features and (ii) filtering according to difference in mean methylation value of the colon cancer and adjacent tissue samples, (t-test). A t-test related p-value < 0.05 was used for probe selection. Probes with mean methylation difference |d| > 0.07 and with |d| > 0.15 have been retained in the first (for Clustering) and second stage (for Discriminant Analysis), respectively. Assumptions on distributional form were treated as robust, (no non-parametric equivalent, such as Wilcoxon being applied), and no adjustment was made for multiple-testing, as a crude probe selection criterion was considered sufficient at this stage. Attempts to apply more restrictive selective criteria were explored, but for the smallest dataset in particular, led to extensive exclusion of genes, (such as VIM), known to be single-gene colon cancer methylation markers.
Clustering (BC)
High-dimensional Bayesian model-based clustering with variable selection [12], (a method suitable for continuous data), was applied to cluster the tissues of the three datasets for different sets of genes. This uses a so-called 'spike-and-slab' Bayesian model to reduce the weight given to the effect of noisy variables, in ordering these according to their importance in cluster separation for the dataset. Importance of variables in agglomerative clustering is quantified by computing an importance score for each variable. Negative values of importance imply that a variable, (i.e. the methylation of a gene in this case), is less likely to participate in the optimal cluster. This method has been used to cluster each of the three microarray-based datasets.
Gene selection: (ROC curves)
The aim was to find genes that might serve as potential marker candidates, i.e. those for which associated CpG island methylation level alone is able to discriminate between (cancer and healthy adjacent) tissue-type. A simple classification rule is used such that all samples with methylation value above (or below) a given threshold value were taken to represent tumour (or healthy) tissue respectively. For different threshold methylation value choices, the performance of the classifier is determined by its sensitivity, (true positive rate or tpr) and specificity (1- fpr (false positive rate)). Plotting tpr versus fpr gives the Receiver Operating Characteristic (ROC) curve, where large area under the curve (AUC) reflects the marker candidate's ability to detect the origin of the sample. A threshold AUC of 0.94 was used to select potential markers from the datasets, where this corresponds to sensitivity >80% for an fpr of 10%.
Gene subset selection
A set of 63 genes were selected for initial cluster analysis, based on their reported potential, either as candidates for methylation markers, as tumour suppressors, or in terms of playing a key role in molecular pathways, known to be disrupted in cancer. The additional basis, (for inclusion of a gene in the subset), was reported abnormal methylation correlation with other well-known cancer indicators. The selection source information was obtained from an in-house developed database resource, (StatEpigen [9]), which focuses on correlation between DNA methylation and other colon cancer characteristic events, such as mutation and gene expression, curated from over 300 scientific reports (between 1998 and 2012) and incorporating a total of around 3000 individual tissue samples. StatEpigen stores frequencies of molecular events, such as CpG island methylation, gene expression, mutations and LOH, inter alia, for samples from colon cells, characterised by different histologies. These range from normal colonic mucosa to adenoma and carcinoma cells. Most studies included in the resource not only measure the methylation of gene promoters and the respective gene expression levels, but also try to determine whether methylation is more frequent in samples with other major, and well-known cancer indicators, (noted as the final selection criterion for the initial subset of 63 selected). This gene set includes, in fact, the CIMP-high detection 8 gene panel introduced by Ogino et al. [2].
Multivariate data analysis
The R software was used to manage the data and analyses. R libraries, used for clustering, included: 'bclust' (Bayesian clustering); 'amap' (for the distance measure); 'heatplus' (annotated heatmaps) and 'pvcclust' (cluster bootstrapping). Non-centred and non-scaled Principal Component Analyses, used to independently verify Bayesian clustering results were performed using R-library 'ade4'.
Discriminant Analysis, (Principal Component based) was performed, using the R package 'adegenet', [13]. This was applied to the preselected small subset of genes, as a preliminary to its use for the larger group of genes (found to be differentially methylated in the GEO array data based on mean methylation difference |d |> 0.15 and t-test p-value < 0.05). An initial clustering of the gene subset was achieved using k-means, to maximize the variation between groups. To identify k, (the optimal number of gene clusters), the k-means algorithm was run sequentially on projections of the subset on the Principal Component-defined space for increasing values of k. The different clustering solutions were compared using the Bayesian Information Criterion (BIC). In practice, optimal BIC is often indicated by an 'elbow' in the curve of BIC values as a function of k, [13]. Accordingly, different numbers of clusters were examined in the exploratory phase of the analysis; results are reported here for k = 7 gene clusters. Three discriminant functions (DF) were evaluated to separate these seven gene clusters for D1 and D3, while two DF were considered adequate for D2. The full gene set was then projected onto the space defined by DF1 and DF2, for each dataset.
The t-tests, for determining differentially methylated genes, were performed using the R 'genefilter' option, while R-libraries 'ROCR' and 'verification' were used to compute the ROC curves.
Indicative (ind-) CIMP status
As access to the original samples to ascertain true CIMP status was not possible, we have used the Illumina array-based data to assess indicative CIMP status for the samples in the datasets, as a basis for comparison. In doing so, we have used the panel of 8 markers suggested by Ogino and colleagues in [2]: (these are RUNX3, CACNA1G, IGF2, MLH1, NEUROG1, CRABP1, SOCS1, CDKN2A). For all datasets, a sample was considered to be ind-CIMP-high if 5 or more of these genes had methylation beta-values  satisfy the following rule:
(1)
where  represents the average methylation beta-value from the normal adjacent tissues and
  is a positive number between 0.23 and 0.35 and is adjusted across the 3 datasets based on the distributions of
  for the concerned genes in each of the datasets. A sample was considered to be ind-CIMP-low if it is not ind-CIMP-high but with at least 3 panel genes satisfying Eq. 1. Ogino and colleagues proposed 1 in 8 to 4/5 in 8 methylated markers for attributing a CIMP-low status, but the methylation assay in these datasets was different to that used by these authors in [2]. Allowing only 1 in 8 markers satisfying Eq. 1 in order to label ind-CIMP-low, leads to almost all samples in D1 labelled as ind-CIMP-low, which is not realistic for these data.
Results
Three large-scale genome-wide datasets (D1, D2 and D3, see Table 1), containing locus-specific methylation data in colorectal cancer, were used for comparative analysis of the inherent methylation subgroups. From these datasets, 2180, 1608 and 2023 potentially overmethylated gene-related loci, respectively, were obtained, (for which difference in mean methylation value between colon cancer and adjacent tissue samples |d| > 0.07). The intersection of these three gene lists is very good, with 1239 common overmethylated loci. The obtained lists of genes have been intersected with a pre-compiled subset of 63 genes, with historically-reported marker potential, (Materials and Methods). The resulting datasets were analysed initially using Bayesian Clustering and heatmaps. The objective here was to compare methylation profiles of these target genes across patients and their inter-correlations across datasets.
Of the subset of 63 genes, 52 are found on the Illumina HM27 array, while probes, associated with genes C13orf21, NPHS2, PAPLN, MED12L, SLC30A10, LYPD1, NR3C1, FLJ4154, FLJ37464, ABCB1 and FBXL7, are not. Of these 52, there were 48, 34 and 43 targets of interest, satisfying the differentially-methylated filter (Materials and Methods) for the three datasets, respectively; (see provided Supplementary Material for the gene lists). Significantly higher average methylation values in tumours, as opposed to healthy adjacent tissues, were found. For the smallest dataset, D2, the methylation level difference between the tumours and the healthy adjacent tissue does not achieve statistical significance for several important colon cancer methylation markers, including MLH1. This is probably due to the small number of samples in D2 since, for both larger datasets, MLH1 shows consistently higher methylation in cancers compared to adjacent tissue, (one probe for D1 and two for D3).
Clustering
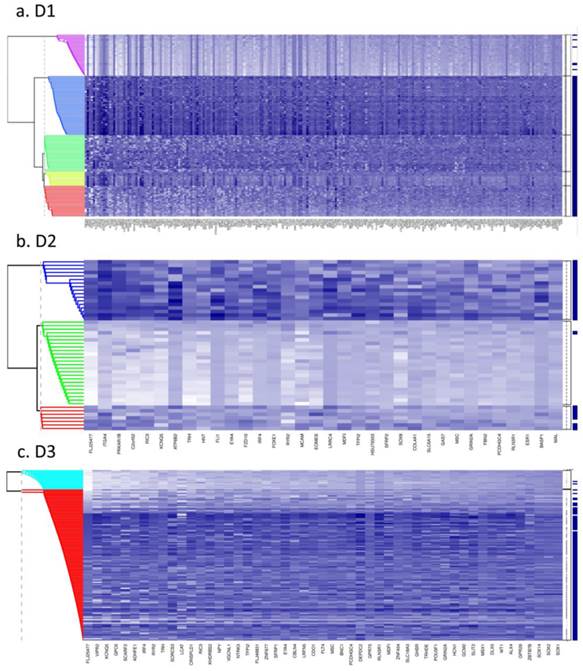
Fig. 1 (a to c) show the results of Bayesian clustering (BC) performed on tumour and adjacent healthy-looking tissue in datasets D1-D3. The cluster analysis results in data separation into several distinct coloured bands across the tumours from each dataset.
Bayesian clustering (BC) for the selected list of genes for the 3 GEO array-based datasets. BC orders the genes according to their importance in discriminating between tissue types. Each row represents the methylation levels of the considered genes for the same tissue, while each columns represents the methylation levels of many tissues for the same gene. Darker shades on the heatmaps indicate higher methylation levels, while the right-hand side vertical bar indicates the tumour tissues in dark-blue and the normal-looking adjacent tissues in white. a) Dataset D1 b) Dataset D2 c) Dataset D3. All heatmaps contain the same ratio of tumours to healthy adjacent tissues. d) Frequency of indicative CIMP-status, calculated from the Illumina array-based data as indicated in Materials and Methods, for tissue clusters obtained by Bayesian Clustering on D1, D2, D3.
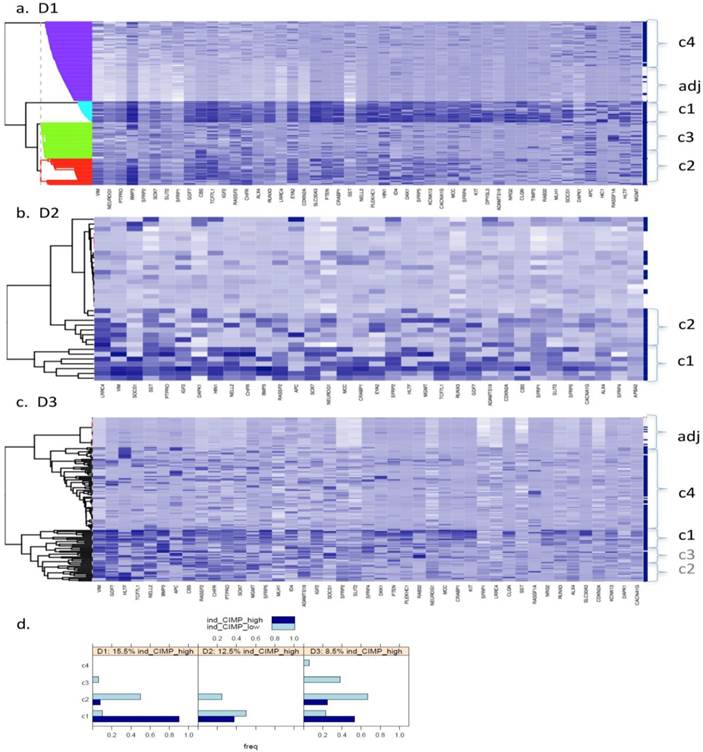
- Dataset 1 (D1). Bayesian clustering separated the tumours in D1 into four well-delimited clusters (Fig. 1a), as also obtained from the recursively- partitioned mixture model (RPMM) for a larger selection of loci from this dataset, [5]. One cluster (c1), representing 17% of all samples, predominantly contains high locus-specific methylation and almost all 48 target genes display high frequency of this for tumour tissues within the cluster. The second cluster, c2, (accounting for 26% of all samples) also displays high methylation levels for many loci, but frequencies are lower than in c1. The original study on this dataset, including KRAS and BRAF mutations as well as evaluation of CIMP status, led to the conclusion that clusters are enriched with CIMP-high and CIMP-low phenotypes, respectively [5]. The remaining two clusters obtained from our BC analysis exhibit mosaic methylation across tumours; one (c3), exhibits relatively higher levels and frequency of methylation, and is broadly synergistic with c2, while the final cluster, (c4), contains few highly methylated genes and could not be discriminated from adjacent healthy tissue samples.
- Datasets D2 and D3. Neither dataset produced clearly distinct separation into four clusters, as observed for D1, but both are distinguished by a small cluster c1 (thin band in the heatmap) of highly methylated loci (29% and 9% of all samples, respectively, Fig. 1 (b and c)). Apart from this highly- methylated cluster, D2 contains two other distinct clusters: c2 is small and variable, of mosaic pattern-type with intermediate levels and frequencies of methylation, while the other (unlabelled) is larger, mosaically and low-level methylated, and does not discriminate between tumours and adjacent tissues. Arguably, as this dataset is relatively small (24 tumours), it might be expected to include fewer identified methylation profiles. However, D3, despite its relatively large size, (118 tumours), also shows relatively poor discrimination between highly-methylated and intermediately-methylated tumours. For convenience, four clusters are again labelled for D3, but other cluster separations could be retained also. More than 50% of tumours belong to a mosaic cluster of locus-specific methylation with relatively low levels and frequencies (c4).
For a better understanding of the composition of the obtained clusters, indicative (ind-) CIMP-status (see Materials and Methods) has been calculated for each of the tumour tissues and Figure 1 (d) gives the frequency of the obtained ind-CIMP-status across the four tissue clusters in the three datasets. Although ind-CIMP-status is only indicative, the figure shows that most of the ind-CIMP-high tissues are found in c1 for the three data sets and that for the two larger datasets D1 and D3 most the ind-CIMP-low tissues are found in c2. In D3, c3 contains a larger proportion of ind-CIMP-low tumour tissues than for D1, suggesting that this c3 in D3 and c3 in D1 contain tumours with some differences in their molecular characteristics.
For ease of illustration and comparison of relative sizes of tumour tissue clusters in the three datasets, the ratio of tumours to adjacent tissues is kept constant for the three datasets. To facilitate this, a random sample only of 10 and 24 adjacent healthy tissues from D2 and D3, respectively, is actually shown in Fig.1 (b and c), and also in Figs.4 and 5. The clustering, obtained using all 118 adjacent healthy tissue samples from D3 is provided in Fig. 2, to give an overall view. To assess if sampling affected the D3 cluster profile obtained, two-way bootstrapping was performed, using a modified version of the pvclust R package, (described in more detail in the Supplementary Material provided).
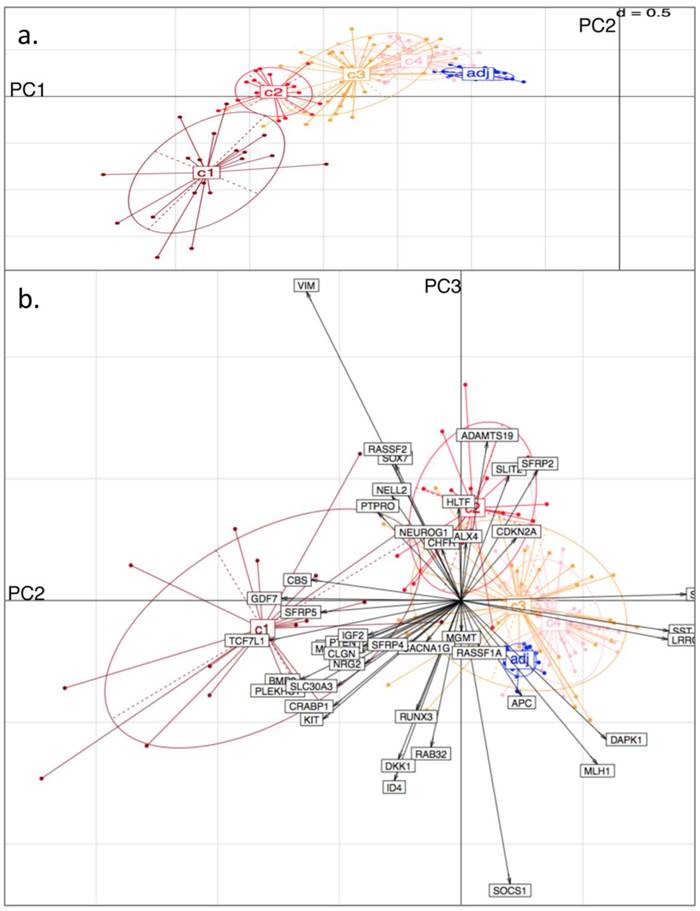
Principal Component (PC) Analysis on D3. Showing a) PC1 and PC2, with tissue-type clusters clearly shown and in agreement with Bayesian Clustering (BC) and b) PC2 and PC3. Tissue samples are represented by dots and genes by labelled arrows. The c1 to c4 and 'adj' groupings correspond to the subclusters obtained in the previous BC analysis.
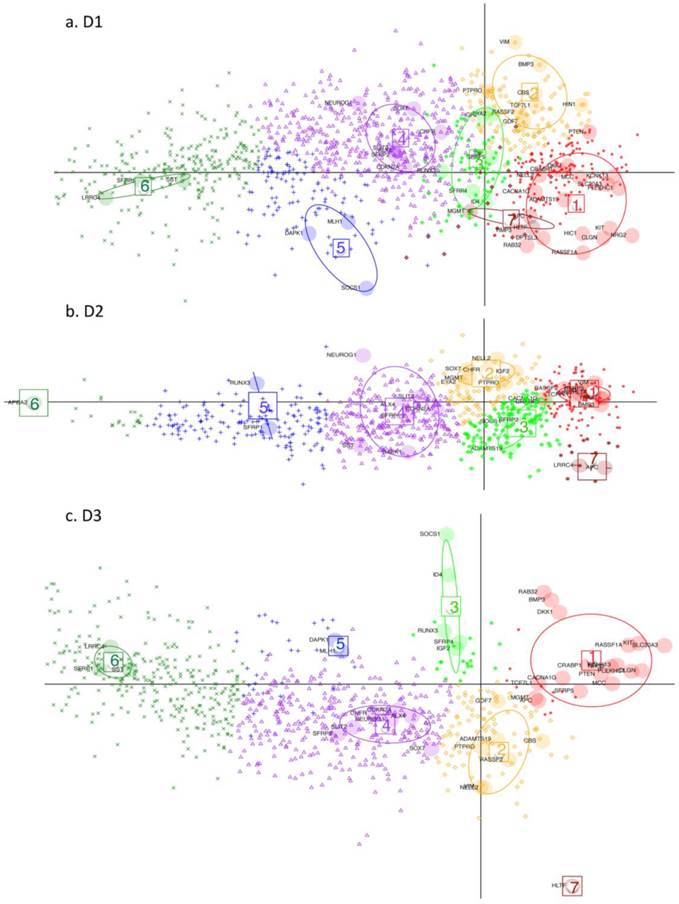
DAPC (Discriminant Analysis based on Principal Component Analysis). Performed on D1, D2 and D3 respectively (GEO datasets). Key: Large shaded circles correspond to genes from the initial subset list. Small symbols indicate membership to different gene clusters, as determined by the discriminant functions, for the rest of the genes from the respective datasets. Resulting gene-clusters with similar relative locations on the plan, are annotated from 1 to 7 in the three datasets. Thus gene-cluster g4 here implies that member-genes have a similar position on the plan relative to the other gene clusters across the 3 datasets. Gene cluster 7 is very small hence is not considered in the subsequent discussion. Note how this time it is the genes which are projected on the plane defined by the first 2 discriminant functions (DF) (as opposed to the tissues being projected on the planes defined by the principal components (PC) in Fig. 3 and 4).
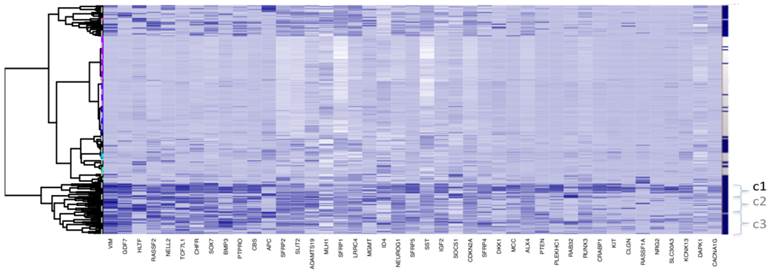
Clustering for Dataset 3 (all 118 adjacent healthy tissue samples included). Bayesian Clustering (BC) performed on D3 with all 118 available adjacent samples included. Comparing sample content of clusters with those from Fig. 1c (subset of adjacent healthy tissue samples only included), the overlap in c1 is about 70% and, for c2 and c3 taken together - about 80%. Both c2 and c3 correspond to intermediary methylated tissues and the boundary between these clusters is very fuzzy, as they swap samples from Fig 1c to this figure.
Clustering indicates two main types of genes, based on both intensity and frequency of methyltion across all tissues.
- Those with clear association to high, intermediate and low methylation level tumour groups. These genes tend to be highly methylated for the CIMP-high tumours, to be less highly methylated for the tumour group / groups with intermediate methylation and to have low methylation level otherwise. These genes are marker candidates for different subtypes of colon cancers.
- Those with methylation levels showing little relation to tumour tissue grouping. Among these are those genes with relatively stable intermediate methylation values across all groups. These genes are examples of markers for colon cancer screening. There are also some genes with variable methylation levels across tumour groups, such as APC, HLTF and MGMT and it may be that different molecular mechanisms are responsible for methylation of these genes, but this can not be confirmed, based on the data available.
Principal Component Analysis
To independently assess the Bayesian Clustering results), datasets D1 and D3 were selected for Principal Component Analysis (PCA). For each sample in each of the datasets, the original BC cluster was labelled, so as to examine cluster separation when projecting onto the PC-space. Thus, the four tumour clusters and one adjacent healthy tissue cluster were pre-labelled for each dataset.
From the PCA, it was found that variability in locus-specific methylation could be ascribed to 3 main components. The first PC appears to discriminate further between previously observed diseased or healthy groups, according to average methylation level across all loci, (Fig. 3a; Fig. 4a). The initial groups (c1 to c4) are sequentially ordered from highest to lowest average methylation and this overall profile is complemented by adjacent healthy tissue grouping. As seen in the figures, the same clusters, c1 to c4, as determined by BC, are clearly distinguished by the first two PCs.
Principal Component (PC) Analysis on D1. Showing a) PC1 and PC2, with dots representing the projections of the tissues on the plane defined by PC1 and PC2. The different tissue groupings pre-labelled from c1 to c4 and 'adj' correspond to the separation into clusters, obtained with Bayesian Clustering (BC). The tissue projection onto the principal components gives clear agreement with BC cluster separation. b) PC2 and PC3. Tissue samples are represented by dots and genes by labelled arrows. Spatial proximity between arrows suggests that the corresponding genes have similar methylation profiles. Length of arrows is proportional to the importance of the respective gene to the tissue clustering. Proximity of an arrow to a cluster of dots represents the fact that the corresponding gene is important for the formation of this cluster of tissues. Again, c1 to c4 and 'adj' groupings correspond to the subclusters obtained in the previous BC analysis.
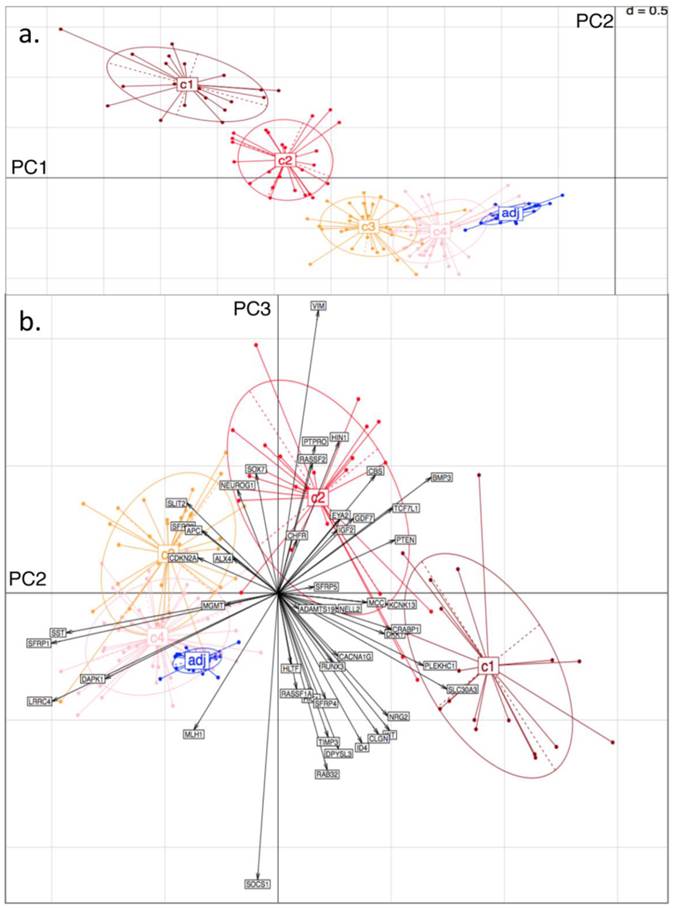
The second PC appears to separate tumours according to differences in locus specificity of methylation across tissues: tumour clusters 1 and 2 (specifically highly methylated at loci corresponding to genes of type (i) - with rather low frequency of hypermethylation across all tissues, see previous section) are contrasted against clusters 3 and 4 (distinguished by lower to no methylation of type (i) genes - or associated with adjacent healthy looking tissues). Performing projections of the gene variables onto the plane, (composed either of PC1 and PC2, or of PC2 and PC3), gives indications on which gene methylation profiles have influenced the formation of each cluster (with spatial proximity reflecting correlation), Figs. 3b and 4b.
For both D1 and D3 datasets, the following genes of type (i) are consistently associated with c1, or with both c1 and c2: RUNX3, KCNK13, CACNA1G, MCC, KIT, DKK1, NRG2, SFRP4, CRABP1, PLEKHC1, ID4, SLC30A3, CLGN, GDF7, CBS, BMP3, TCF7L1, NELL2, PTEN, IGF2. These genes have relatively long projections onto PC2, associated with c1 and c2. Genes with shorter projections on PC2 are less specific to c1 and c2. Such genes are: VIM, CHFR, HLTF, RASSF2, PTPRO, RASSF1A for D1: Note (Fig. 1a) that these are also methylated in c3.
Genes of type (ii) (methylation having little relation to BC tumour clusters), include: ALX4, SST, SFRP1, MGMT, CDKN2A, SLIT2, SFRP2, DAPK1, LRRC4, APC.
Finally, PC3 appears to distinguish tumour cluster c1 from c2 (plausibly CIMP-high enriched from CIMP-low enriched). Unfortunately, not all genes behave similarly in both datasets: genes such as BMP3, SFRP5 and PTEN are strongly methylated in both tumour clusters c1 and c2 in D1, but in the former only for D3.
Discriminant Analysis
Discriminant Analysis for Principal Components, (DAPC), was performed on the three datasets in order to determine which other differentially - methylated genes (with difference in mean methylation value > 0.15), behaved comparably to the subset of genes, used for detailed analysis. The larger difference in mean methylation value is chosen here, because we are ultimately searching for and characterising potential marker candidates, which clearly differentiate cancer from non-cancer. For the three datasets, 1260, 792 and 859 differentially methylated genes, respectively, are found, with an overlap of 613 genes. DAPC separates the small initial subset of genes into seven clusters (g1-g7) for D1 and D2 and six gene clusters (g1-g6) for D3. The gene clustes are projected onto the plane defined by the first two discriminant functions (DF). The seventh gene cluster (g7) is very small hence the following discussion refers only to the first six gene clusters. The remaining genes in the full set were then projected onto the same plane, with each assigned to one of the gene clusters.
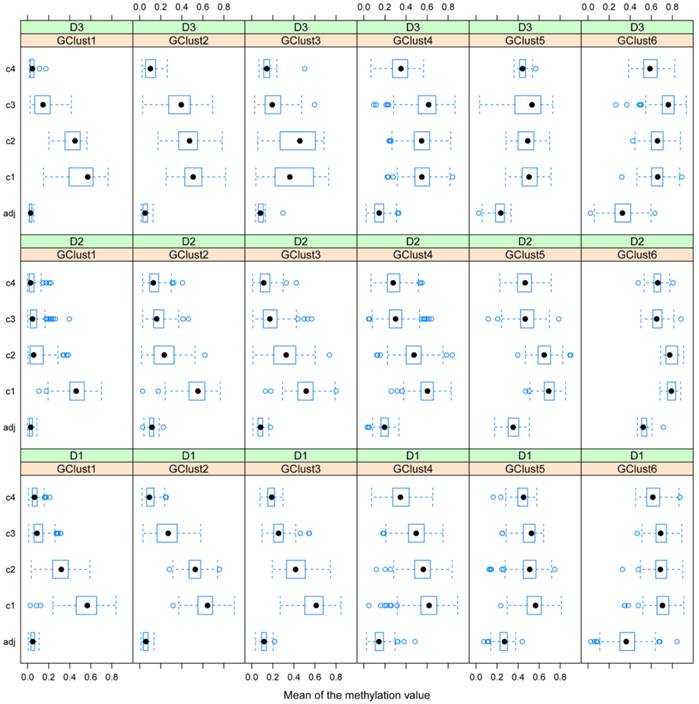
In general, DAPC shows that, despite some overall similarities, the three datasets exhibit considerable differences in detail. In Fig. 5, projections onto the DF1/DF2 - plane, defined by the initial gene subset analysis, (see Materials and Methods), are shown for the remaining genes from D1-D3. Any two gene clusters in different datasets are assigned the same annotation if their relative location on the plane is the same. Fig. 6 shows, the variability of the gene methylation values, for each gene cluster (g) in each dataset, across the four tumour tissue clusters, (c1-c4). The gene clusters (g1-g7) range from that associated with rather uniform methylation pattern across both tumours and healthy-looking tissues (extreme left in Fig. 5) to that associated with high methylation profiles in a reduced group of tumours (extreme right in Fig. 5). Incidence of tumours with high methylation decreases from g6 to g1, (Figs. 5 and 6). The overall gene localisation within gene clusters is very similar across the datasets, with most differences occurring in genes clusters at the far right, (Fig. 5).
Gene methylation variability. Variability of gene methylation values across the four tissue clusters c1-c4 for each gene cluster and each dataset. In order to find a biological sense to the 6 main clusters of genes, determined by DAPC, we look at the average methylation levels across the four tissue clusters in each of the newly obtained gene cluster. Each row of boxplots refers to one of D1-D3 and each column refers to one gene cluster, g1-g6. Note how the mean methylation value and corresponding variance for adjacent healthy tissues and for cancer tissues from c2 to c4 increase with gene cluster number g1-g6 across the three datasets.
D1 is obviously richer than D3 in those genes, which are highly methylated in a limited group of individuals (CIMP-high): (note the red dots to the far right in g1). In this gene cluster, for both D1 and D3, genes exhibit quite unique methylation profiles. Supplementary Table S3 shows the overlap between datasets for each gene cluster, with most of this due to genes from the centre of the cloud, (g4, Fig. 5 a-c), as well as the overlap found between D1 and D2, D1 and D3 and D2 and D3 separately.
Search for potential marker candidates
In the analyses described above, differentially-methylated genes, (identified from the literature on colon cancer samples), were investigated for three large-scale datasets. These genes, though implicated in colon tumours, may correspond to highly variable methylation profiles in patients, (such as those from gene clusters g1-g3 in Figs. 5 and 6 above). Although such profiles are useful to capture correlations among molecular events and highlight different subsets of tumours, they may be less reliable as single screening biomarkers, due to their multiple-peak distribution and high false negative rate. Thus, candidates for potential screening marker candidates were selected, based on overall assessment of the three datasets D1, D2 and D3, (from gene clusters with improved stability, namely g4 and g6). Probe sets featuring statistically significant differential methylation in the tumour groups (c1-c4) relative to that for adjacent healthy tissues were selected and 1260, 792 and 859 target candidate genes obtained from D1 to D3 respectively. ROC curves and Areas Under the Curve (AUCs) were computed for each differentially methylated gene in each dataset. Fig. 7 shows the overlap among genes, for which threshold AUC > 0.94, found in the three datasets respectively. By this criterion, the following genes were found to be common to all datasets: TRH, EYA4, GRIN2A, MDFI, MSC, TFPI2, RYR2, PCDHGC4, IRF4, KCNQ5 and FLJ25477. Notably, all genes in this list, (with the exception of PCDHGC4), belong to the same gene clusters (g) in D1 as in D3. Other intersection lists are given in Table 2.
Potential common methylation markers with very high AUC. Potential screening markers with AUC>0.94 common to the three GEO array-based datasets (given in the areas of circle overlap).
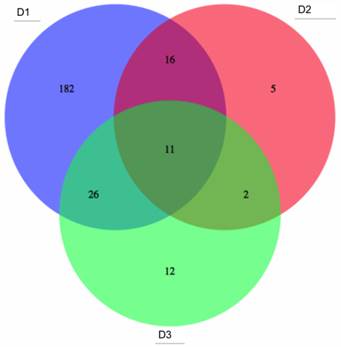
Common genes with AUC > 0.94: (90% specificity is achieved with more than 90% sensitivity) for D1, D2 and D3.
| Datasets | Potential methylation biomarker genes |
|---|---|
| 1. D1 and D2 | ESR1, SLC6A15, HSU79303, SFRP2, MAL, C2orf32, ATP8B2, EOMES, FLI1, GAS7, LRRC4, FOXE1, ITGA4, BASP1, FBN2, COL4A1 |
| 2. D2 and D3 | RLN3R1, RIC3 |
| 3. D1 and D3 | ALX4 (4), DLX5 (6), MSX1 (6), ADHFE1 (6), CBLN4 (6), GCM2 (6), VGCNL1 (6), SLIT2 (4), WT1 (5,6), NPY (6), HCN1 (6,4), BNC1 (6), SLC18A3 (6), GHSR (6), SFRP1 (6), DEPDC2 (4), FLJ46831 (6), NTRK3 (4,6), SCARF2 (6,4), GPR75 (6), GPC6 (6), POU3F1 (4,6), KHDRBS2 (6), ZNF677 (6), VIPR2 (4,6), LCAT(6) |
| 4. D1, D2 and D3 | TRH (6), EYA4 (4), GRIN2A (4), MDFI (4), MSC (6), TFPI2 (4), RYR2 (6), PCDHGC4 (5,4), IRF4 (4), KCNQ5 (6), FLJ25477 (6). |
Lists 3 and 4 should be noted, particularly, as the former gives the biomarker gene list overlap for the two larger datasets, while List 4 gives the overlap of these two with the smaller dataset D2. The corresponding gene cluster for D1 and D3 is given in brackets: (a single figure means that the gene clusters correspond).
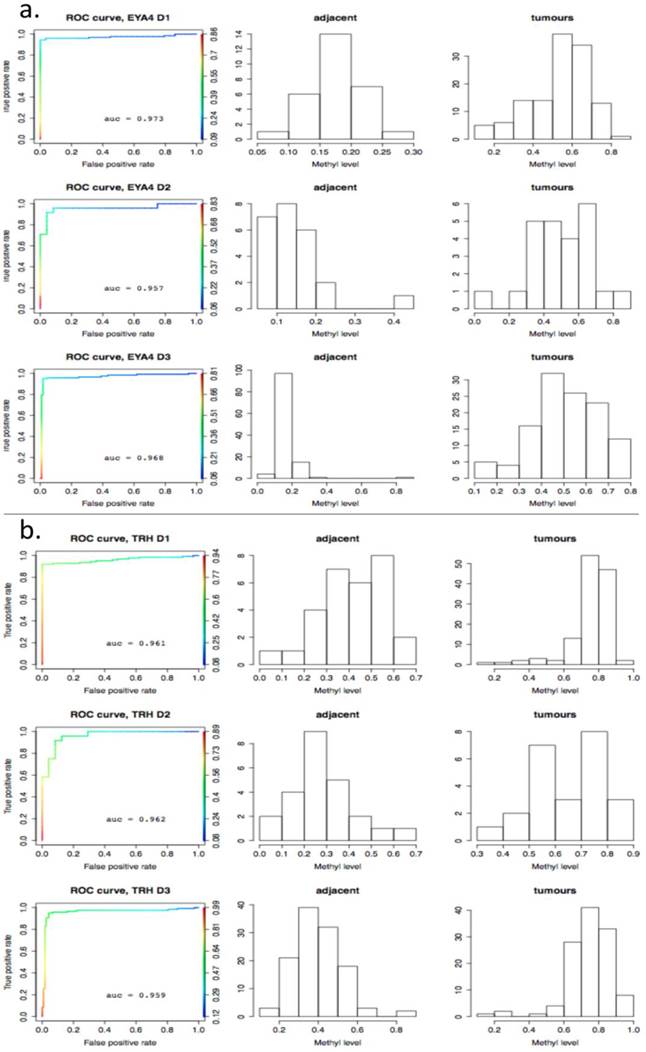
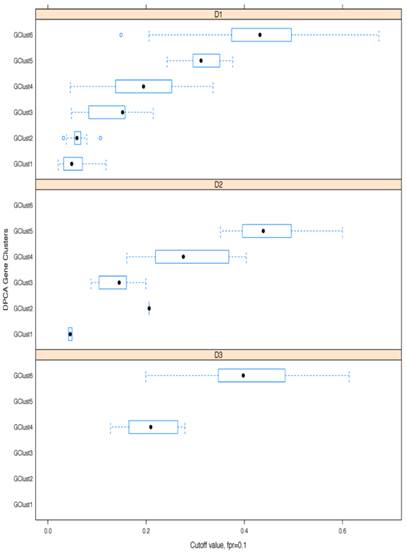
As a further step, methylation cut-off values, separating adjacent healthy tissues from tumours, with false positive rate (fpr) = 0.1 (i.e. specificity of 90%) were considered. Cut-off values vary noticeably from gene to gene, (as illustrated in Fig. 8, where gene methylation level distributions across colorectal cancer and adjacent tissues are shown for EYA4, (low threshold), and for TRH, (high threshold). Overlapping genes, TRH, FLJ25477 and RYR2, (all from g6), have particularly high AUCs for all three datasets, D1-D3, with methylation threshold = 0.5, (Fig. 8b), while genes, such as MDFI, EYA4, GRIN2A, TFPI2 and IRF4, (all from g4), have much lower threshold for separation of tissue type, ranging from 0.1 - 0.35, (Fig. 8a). Intermediate cut-off values apply to other genes, such as KCNQ5 (g6) and PCDHGC4 (g5, g4), but high, low and intermediate thresholds are relatively constant for all three datasets. Fig. 9 shows these cut-off values across gene clusters g1-g6 and datasets (D1-D3) for all genes with high AUC. For D2, cut-off values for g5 are close to those for g6 for both D1 and D3. Moreover, while D2 contains no genes with large AUC from g6, it includes many from g5, which suggests that g5 and g6 (combined), for D2, are equivalent to g6 in the larger datasets. Fig. 9 also confirms that genes from g4 and g6 are more representative of screening marker candidates: (the Binomial test for comparison of proportions (of marker candidates) yields highly significant p-values = 4.172×10⁻⁸, 7.59×10⁻⁵, for D1 and D2, respectively). In D3, all genes with large AUC are from g4 and g6. In terms of screening marker candidates, therefore, genes from g4 may be of most interest, given statistically significant lower cut-off methylation values: (t-test of difference in mean cut-off for g4 versus g6 giving p-values, respectively, of 2.2×10⁻¹⁶, 10-4 and 1.54×10⁻⁹, for datasets D1 and D3).
ROC-curves for two potential screening markers. a) EYA4 (from gene cluster g4 in D1 and D3) and b) TRH (from gene cluster g6 in D1 and D3), with AUC >0.94 in D1-D3. Left: ROC curves (horizontal axis: 1-specificity, left vertical axis: sensitivity, right vertical axis: the range of cut-off methylation values employed to build the ROC curve, colour-coded for each value); Middle: histograms for methylation levels in normal-looking tissues ajacent to tumours; Right: histograms for methylation levels in the tumours. The X axis gives the methylation level and the Y axis gives the number of tissues per methylation level group.
Boxplots of cut-off methylation values separating tumours from healthy-looking adjacent tissues. Calculations shown for specificity ≥ 90%; results given separately for each gene cluster (g) and each dataset (D).
Finally, Bayesian clustering was also performed for potential marker gene sets in D1, D2 and D3. This provided a strong demonstration of how much datasets can vary with respect to 'hitting' these targets. In D1 and D2 even the most uniformly methylated loci result in formation of coloured bands, (i.e 2 distinct clusters, Fig. 10, a and b), while in D3 the methylation of high AUC loci is surprisingly homogeneous (Fig. 10c).
Bayesian Clustering for selected potential screening markers in the three GEO array-based datasets. The right-hand side vertical bar indicates those rows corresponding to tumours tissues in dark-blue and those corresponding to healthy-looking adjacent tissues in white. a) D1 b) D2 c) D3.
Discussion
One objective of this study was to compare correlation structure of epigenetic events in colon cancer across large-scale datasets. Three large-scale methylation studies on colon cancer were available in GEO at the time of writing this report. Compared to the amount of colon cancer expression data, this is extremely sparse, but should improve, with several authors, e.g. [5, 11], noting that bead-chip array methods, for example, are effective for screening genes with promoter hypermethylation.
Methylation Distributions for different tissues and datasets
For methylation data from the three GEO array-based datasets, Bayesian Clustering, PCA and DAPC were performed for a selection of loci exhibiting differential methylation across tumours and healthy adjacent tissues. The comparison of methylation patterns across these datasets has revealed some similarities, but also specific differences between the datasets. While high-, intermediate- and low-methylation gene groups were found to occur in all datasets, only one dataset (D1) showed clear discrimination of tumour samples into four groups. Similar findings are due to [5], who considered unsupervised clustering for 1401 probes using a recursively-partitioned mixture model (RPMM) method. The alternative approach, described here, is based on bootstrap principles in that it allows identification of a reduced set of methylation targets of interest, before discriminant analysis is used to classify the rest of the loci. Despite the alternative approach, it is interesting to note that the four-band structure is conserved in the current analysis.
Notwithstanding the overall designation 'colon cancer', the condition actually involves a number of diseases, caused by different molecular pathways being disrupted. Thus, individuals from different clusters obtained may have followed somewhat different pathways leading to cancer initiation and progression.
In the BC results obtained here, a highly methylated cluster was observed in all three large-scale datasets (c1, Fig. 1), although of varied size, particularly for D3, with relatively few tissue samples involved compared to D1. The indicative (ind-) CIMP status calculated by us has also shown 15.5% ind-CIMP-high tumours compared to 8.5% ind-CIMP-low tumours in D3 (Fig. 1d). Recently, Hinoue and colleagues have reported that their highly methylated cluster was predominantly composed of tissues derived from female patients [5]. This smaller size of the highly methylated cluster in D3 may be due to the gender ratio in this dataset (with twice as many males as females), [11], as compared to the more balanced gender ratio from D1 [5].
All datasets show subgroups of intermediate methylation and, for D1, Hinoue and colleagues have indicated that the second highly methylated cluster is mostly representative of CIMP-low phenotype (according to the methylation status of CACNA1G, IGF2, NEUROG1, RUNX3, SOCS1 and MLH1 determined by the MethylLight assay [5]. In this dataset, this cluster is very distinct from the two others exhibiting lower / rarer levels of methylation. Intermediate methylation subgroups, possibly attributable to a CIMP-low-like phenotype, are obtained for the other two datasets: distinct in c2 for D2 and much less marked for D3: c2 and c3, (see overlap between c2 and c3 in PCA projection for D3 (Fig. 4a). Additionally, the ind-CIMP-low computations in D3 show high levels in both c2 and c3, as opposed to what is observed for D1 (Fig. 1d), suggesting that for D3, c3 is closer by its composition to c2. For the three datasets analysed here, tissues with rare and mosaic methylation are observed also and are clustered with adjacent healthy tissue, c3 and c4 for D1, c4 for D3. In D2, tumours and healthy tissue with such methylation are combined in one heterogeneous cluster, (to be expected perhaps from a small dataset). In D3, there is slightly better separation between tissue types with rare methylation and healthy adjacent tissue than for D2, but this is marginal and inconclusive, (Fig. 1c and Fig. 2).
Based on the data available, it is possible to further pinpoint the loci, specific to the tissue sample groups identified by BC. In this analysis, PCA and DPCA results were used to find consensus sets of genes, defining the different tissue groups. The approach was initially applied to a selected subset of genes with discriminant functions used to project the remaining genes onto the defined PC1/PC2-plane. While agreement in methylation profiles is obtained for some genes, (Supplementary Table S3 for DAPC), this is partial. SOCS1, (used in CIMP detection panels), appears specific for c1 in D1 and D2 but is not prominent in D3, for which it appears highly methylated in c3 also. Again, a locus such as MLH1, which in other studies appeared to be highly specific for CIMP-high/CIMP1 [2, 3], while it does show specificity for c1 in D1, is not even selected as differentially methylated for D2 and is not particularly prominent for the highly methylated cluster in D3. CDKN2A, used as an additional marker for CIMP-high detection, was not specific to c1 and c2, and spanned c3 and c4 too in D1, was specific to c1 and c2 in D2, and not at all prominent for c1 though specific to c2 in D3. Clearly, for such loci, CIMP-high specificity is not clear-cut and would appear to be dependent on the dataset. As D1 originates from Europe and North America [5] and D2 and D3 from Asia [10, 11], geographical region may influence the methylation patterns obtained in these datasets, but we can not exclude other factors, such as the different DNA extraction kits used in the three different studies. CIMP also seems to be a latent phenomenon [4, 11], representing more targets then those usually assessed.
It is noteworthy that, for no dataset, are adjacent tissues completely distinct from tumours. Specifically, methylation level distributions overlap for different genes and tissue types, and to greater extent in D2 and D3. This finding lends support to the hypothesis [14], that normal-looking colonic mucosa of patients with cancer is in fact, not 'normal' but 'epigenetically predisposed' to cancer, because of the acquisition of multiple somatically-heritable chromatin modifications. Indeed, a growing body of research has shown a relationship between epigenetic modifications and the environment, particularly in regard to dietary intake in the case of colorectal cancer, [14-17] and others. Clearly, once an individual develops cancer, all cells are exposed to the same environmental factors, with a spectrum of more or less severe consequences.
Consensus marker candidates for prospective
Many colorectal cancers initially evolve in an asymptomatic manner and, due to the invasive nature of colonoscopies, may often be diagnosed only at relatively late stages of the disease, with symptoms appearing when response to treatment has a lower success rate [1]. Some aberrantly-methylated genes, such as VIM, have been explored as marker candidates for noninvasive detection by stool testing, with moderately successful sensitivity, [18-20]. Despite the modest performance reported in some cases, (38.3%, 72.5% and 46% respectively), a commercially available fecal DNA test was developed, [1, 21] and VIM has been suggested as a serum [22] and stool marker ([23] and refs therein), both alone and in combination with other markers. In a recent study, [24], the authors selected BMP3, NDRG4, VIM and TFPI2 for testing as methylation markers for colorectal cancer and adenoma clinical screening, using quantitative allele-specific real-time target and signal amplification (QuARTS), and reported that methylated BMP3, NDRG4, VIM, and TFPI2 detected 84%, 92%, 86%, and 92% of colorectal cancers and 68%, 76%, 76%, and 88% of adenomas, respectively. In the datasets, considered here, only TFPI2 passed the AUC threshold (0.94) for all three. For D1, NDRG4 was indicated and also passed a lower threshold, AUC <0.83 for both D2 and D3; (for fpr= 0.2, the true positive rate (tpr) reaches a max of 0.7), while BMP3 passed the threshold for D1 but had AUCs < 0.63 for both D1 and D3. For VIM, the AUC was close to our threshold for D1 (0.931) and < 0.85 for D2 and D3 (with 60% to 80% sensitivity for 90% specificity across the three datasets).
The aim is to select genes (such as TFPI2), exhibiting higher sensitivities and specificities for all three GEO colon cancer tissue datasets, as these may be promising candidates for high performance, minimally - invasive clinical screening, based on stool or serum samples. The ROC analysis, performed on D1-D3, identified 11 targets for which AUC is larger than 0.94 (see Table 2, summarizing markers, endorsed by the comparative approach). Of these, TFPI2 and EYA4 have already been proposed as biomarkers for D3, [11], with TFPI2 reported in stool from colorectal cancers with notable sensitivity (76% to 89%) and specificity (79% to 93%), [25]. For MSP assays, sensitivity of 100% and specificity of 68.3% respectively have been reported, [26], for stool samples from pancreatic cancer patients, exhibiting AUC = 0.66 for TFPI2 methylation, [27]. Sensitivity of 68.3% with 100% specificity has been reported also for TFPI2 in stool samples using MS-PCR [1].
Further, methylated TFPI2 has been found also in sera from 18% patients with colorectal cancer (39 out of 215) and in 10% patients with gastric cancer (7 out of 73), [28]). In addition, MDFI has been identified as a potential marker for pancreatic cancer, with an AUC of 0.77 in stool samples from cancer patients, [27]. Found to be methylated in aggressive renal clear-cell carcinomas (RCCs), TRH, together with other genes, has been proposed as a 'hallmark' of CIMP [29]. Further, DNA locus-specific methylation of interferon regulatory factors (IRFs), transcription factors known to play a key role in innate and adaptive immune response, cell growth, apoptosis, and development, has been studied in [30] and IRF4, has been found to be methylated in gastric cancers. Moreover, KCNQ5, member of K(v)7 voltage-gated K(+) channel family and crucially important in regulation of smooth muscle activity, is found to yield high AUC values for our three datasets, lending some support also to its potential as a marker.
Finally, it is worth mentioning that gene methylation level distributions among colorectal cancer tissues do vary from gene to gene. For example, TRH, FLJ25477 and RYR2 genes (from DAPC gene cluster g4) for all three datasets D1-D3, have a methylation threshold AUC > 0.4 (Fig. 8a), while for genes such as MDFI, EYA4, GRIN2A, TFPI2 and IRF4 (g6) the separation threshold is much lower in all cases ( 0.1< AUC < 0.35). This relates to genes belonging to different gene clusters (g6 and g4 respectively), - as obtained by DAPC in the methylation distribution analysis across tissues.
Other genes associated with gene clusters obtained here, particularly g1 to g3, (hyper -methylated only in a fraction of tissues, Supplementary Table S3), may also be considered as candidates for stool and serum screening in combination with complementary markers for unmethylated tissues - such as KRAS mutations. For example, methylation of BMP3 (g2 in D1 and g1 in D2, D3) and NDRG4 (in g2) have been successfully used in combination with KRAS mutations to detect colon cancer presence from fecal samples at 98% of sensitivity and 90% specificity, [31].
Conclusion
In summary, this report presents a comparative exploratory investigation of methylation profiles in colorectal cancer, involving three distinct array-based datasets. A range of exploratory statistical techniques has been applied to these data, with the aim of determining similarities. Both discrepancies and similarities have been found across the three datasets. The datasets qualitatively behave quite similarly, but quantitative discrepancies are often large, which is unsurprising given sophistication of measurement. Nevertheless, candidates for markers having potential for differentiating cancer from healthy tissue have been identified. Six main genes clusters have been highlighted, for methylation distributions across tissues. Of these, three small clusters contain genes with high locus-specific methylation in a limited number of tissues (CIMP phenotypes), while three larger clusters are associated with more uniform methylation across the tissues. Results indicate a list of genes with potential as screening markers (and with high values both for sensitivity and specificity). Further studies are necessary to identify whether these genes are consistently methylated in stool and/or serum, with similar precision.
Supplementary Material
Supplementary Figures S1-S2. Supplementary Table S3.
Competing Interests
The authors have declared that no competing interest exists.
References
1. Kanthan R, Senger J.L, Kanthan S.C. Fecal molecular markers for colorectal cancer screening. Gastroenterol Res. Pract. 2012 Epub
2. Ogino S, Kawasaki T, Kirkner G.J. et al. Evaluation of markers for CpG island methylator phenotype (CIMP) in colorectal cancer by a large population-based sample. J. Mol. Diagn. 2007;9:305-314
3. Shen L, Toyota M, Kondo Y. et al. Integrated genetic and epigenetic analysis identifies three different subclasses of colon cancer. PNAS. 2007:104 (47)
4. Tanaka N, Huttenhower C, Nosho K. et al. Novel application of structural equation modeling to correlation structure analysis of CpG island methylation in colorectal cancer. Amer. J. Pathol. 2010;177(6):2731-40
5. Hinoue T, Weisenberger D.J, Lange C.P. et al. Genome-scale analysis of aberrant DNA methylation in colorectal cancer. Genome Res. 2012;22(2):271-82
6. Karpinski P, Walter M, Szmida E. et al. Intermediate- and low-methylation epigenotypes do not correspond to CpG island methylator phenotype (low and -zero) in colorectal cancer. Cancer Epidemiol. Biomarkers Prev. 2013;22(2):201-8
7. Yagi K, Akagi K, Hayashi H. et al. Three DNA methylation epigenotypes in human colorectal cancer. Clin. Cancer Res. 2010;16:21-33
8. Barrett T, Wilhite S.E, Ledoux P. et al. (2013) NCBI GEO: archive for functional genomics data sets--update. Nucleic Acids Res. 2013;41(Database issue):D991-5
9. Barat A, Ruskin H.J. A Manually Curated Novel Knowledge Management System for Genetic and Epigenetic Molecular Determinants of Colon Cancer. The Open Colorectal Cancer J. 2010;3:36-46
10. Kibriya M.G, Raza M, Jasmine F. et al. A genome-wide DNA methylation study in colorectal carcinoma. BMC Med. Genomics. 2011;4:50
11. Kim Y.H, Lee H.C, Kim S.Y. et al. Epigenomic analysis of aberrantly methylated genes in colorectal cancer identifies genes commonly affected by epigenetic alterations. Ann. Surg. Oncol. 2011;18(8):2338-47
12. Partovi Nia V, Davison A. High-Dimensional Bayesian Clustering with Variable Selection: The R Package bclust. J. of Stat. Software. 2012;47(5):1-22
13. Jombart T. adegenet: an R package for the multivariate analysis of genetic markers. Bioinformatics. 2008;24:1403-1405
14. Silviera M.L, Smith B.P, Powell J, Sapienza C. Epigenetic differences in normal colon mucosa of cancer patients suggest altered dietary metabolic pathways. Cancer Prev. Res. (Phila). 2012;5(3):374-84
15. Pufulete M. Intake of dairy products and risk of colorectal neoplasia. Nutr. Res. Rev. 2008;21(1):56-67
16. Vargas A.J, Thompson P.A. Diet and nutrient factors in colorectal cancer risk. Nutr. Clin. Pract. 2012;27(5):613-23
17. Williams E.A. Folate, colorectal cancer and the involvement of DNA methylation. Proc. Nutr. Soc. 2012;6:1-6
18. Chen W-D, Han Z.J, Skoletsky J. et al. Detection in fecal DNA of colon cancer-specific methylation of the non-expressed vimentin gene. J. Natl. Cancer Inst. 2005;97:1124-32
19. Itzkowitz S.H, Jandorf L, Brand R. et al. Improved fecal DNA test for colorectal cancer screening. Clin. Gastroenterol. Hepatol. 2007;5(1):111-7
20. Baek Y.H, Chang E, Kim Y.J. et al. Stool methylation-specific polymerase chain reaction assay for the detection of colorectal neoplasia in Korean patients. Dis. Colon Rectum. 2009;52(8):1452-1459
21. Ned R.M, Melillo S, Marrone M. Fecal DNA testing for Colorectal Cancer Screening: the ColoSure™ test. PLoS Curr. 2011;3:RRN1220
22. Shirahata A, Sakuraba K, Goto T. et al. Detection of vimentin (VIM) methylation in the serum of colorectal cancer patients. Anticancer Res. 2010;30(12):5015-8
23. Zou H, Harrington J.J, Shire A.M. et al. Highly methylated genes in colorectal neoplasia: implications for screening. Cancer Epidemiol. Biomarkers Prev. 2007;16(12):2686-96
24. Zou H, Allawi H, Cao X. et al. Quantification of methylated markers with a multiplex methylation-specific technology. Clin. Chem. 2012;58(2):375-83
25. Glöckner S.C, Dhir M, Yi J.M. et al. Methylation of TFPI2 in stool DNA: a potential novel biomarker for the detection of colorectal cancer. Cancer Res. 2009;69(11):4691-9
26. Zhang J, Yang S, Xie Y. et al. Detection of methylated tissue factor pathway inhibitor 2 and human long DNA in fecal samples of patients with colorectal cancer in China. Cancer Epidemiol. 2011;36(1):73-7
27. Kisiel J.B, Yab T.C, Taylor W.R. et al. Stool DNA testing for the detection of pancreatic cancer: assessment of methylation marker candidates. Cancer. 2012;118(10):2623-31
28. Hibi K, Goto T, Shirahata A. et al. Detection of TFPI2 methylation in the serum of gastric cancer patients. Anticancer Res. 2011;31(11):3835-8
29. Arai E, Chiku S, Mori T. et al. Single-CpG-resolution methylome analysis identifies clinicopathologically aggressive CpG island methylator phenotype clear cell renal cell carcinomas. Carcinogenesis. 2012;33(8):1487-93
30. Yamashita M, Toyota M, Suzuki H. et al. DNA methylation of interferon regulatory factors in gastric cancer and noncancerous gastric mucosae. Cancer Sci. 2010;101(7):1708-16
31. Lidgard G.P, Domanico M.J, Bruinsma J.J. et al. Clinical Performance of an Automated Stool DNA Assay for Detection of Colorectal Neoplasia. Clin. Gastroenterol. Hepatol. 2013;11(10):1313-8
Footnotes
GEO (Gene Expression Omnibus): a large public NIH-based international public data repository of genomic data, drawn from various technological platforms, [4].
The Beta-value (Illumina) in the range [0,1], quantifies methylation level and is interpreted as the percentage of methylation. It represents the ratio between the Illumina methylated probe intensity and total probe intensity (= sum of methylated and unmethylated probe intensities).
Author contact
![]() Corresponding author: anabaratie
Corresponding author: anabaratie