Impact Factor ISSN: 1837-9664

 Global reach, higher impact
J Cancer 2015; 6(8):786-794. doi:10.7150/jca.12251 This issue Cite
Research Paper
Could the Anti-Chaperone VER155008 Replace Temozolomide for Glioma Treatment
Leroy Shervington, Harshada Patil, Amal Shervington ![]()
Brain Tumour North West, Faculty of Science and Technology, University of Central Lancashire, Preston, PR1 2HE. UK.
Received 2015-3-26; Accepted 2015-6-11; Published 2015-7-4
Abstract
Cancer inducible molecular chaperone HSP90 is of great importance as an anticancer target. Proteomic analysis showed that inhibiting HSP90 by the geldanamycin derivative, 17-AAG elevated the expression of the co-chaperone Hsp70. In this study we used HSP90 selective inhibitor 17-AAG and HSP70/90 dual inhibitor, VER155008 (VER) in U87-MG glioma cells. miRNAs microarray technology was used to evaluate the efficacy of these inhibitory drugs compared with temozolomide (TMZ), used as a standard treatment for glioma. Microarrays data identified 154 differentially expressed miRNAs using stringent or unstringent parameters. 16 miRNAs were overlapped between treatments, 13 upregulated and one downregulated miRNA were overlapped between TMZ and VER. The miRNA target prediction software was used for these overlapped miRNAs and identified 6 of the 13 upregulated miRNAs target methyltransferase genes. The IC50, together with Akt and HSP70 and 90 protein level data favour VER and TMZ to 17-AAG, however due to the selectivity of VER to cancer cells as a potent antichaperon, it may be more favourable to the standard TMZ.
Keywords: HSP70, HSP90, miRNA, glioma cells, 17-AAG, VER (VER155008 ), TMZ
Introduction
Heat Shock proteins (HSPs) are established therapeutic targets for various disease such as Alzheimer's, Huntington's, cardiovascular and cancer (1). HSPs or stress proteins are highly conserved molecular chaperones that assist folding of misfolded proteins (2,3). The co-chaperones HSP90 and HSP70 are important members of the HSP family that are implicated in cellular processes by chaperoning oncogenic client proteins like Ras, p53 and Akt (4). Akt, also known as protein kinase B (PKB), is a serine/threonine-specific protein kinase that plays a key role in multiple cellular processes such as glucose metabolism, apoptosis, cell proliferation, transcription and cell migration. It is known to require HSP90 chaperone for proper folding, maturation and activity.
Although inhibiting HSP90 by the antibiotic geldanamycin derivative 17-allylamino-17-demethoxygeldanamycin (17-AAG), currently in phase III trial (5-7), it causes destabilization of its client proteins and induces cell apoptosis, proteomic analysis showed an elevated HSP70 expression compensating for the inhibition of HSP90 (8). Thus, in order to enhance the efficacy of treatment, both HSP90 and HSP70 need to be inhibited.
In this study 17-AAG was used to inhibit HSP90 activity, while VER155008 (VER) was used to inhibit both HSP70/90 in U87-MG glioma cells. VER is an adenosine-derived compound that is selective towards HSP70, however it's selectivity is not exclusive since it also binds to HSP90β (9). The standard treatment for glioblastoma is temozolomide (TMZ) and in this study was used as a positive control.
miRNA microarrays is a powerful tool that has facilitated our understanding of biological roles and offers a more detailed profile for comparing different treatments. This method was used to determine if there is a correlation between treatment efficacies.
miRNAs are evolutionarily conserved endogenously expressed small non-coding RNAs of 19-22 nucleotides in length that direct Argonaute proteins to bind and repress complementary mRNA targets (10,11). Over 60% of protein-coding genes are regulated by miRNA, which have diverse roles in cellular processes such as proliferation, apoptosis and cancer development (12,13).
Materials and methods
Normal Cell Culture Conditions
The human brain tumour cell lines 1321N1 (astrocytoma), GOS-3 (mixed astro-oligodendroglioma) and U87-MG (glioblastoma multiforme) were purchased from the European Collection of Cell Cultures (ECCAC, UK) and Deutsche Sammlung von Mikroorganismen und Zellkulturen (DMSZ, Germany). U87-MG cells were cultured in Eagle's Minimum Essential Medium (EMEM) (Lonza, UK) and GOS-3 and 1321N1 cells in Dulbecco's modified Eagle's medium (DMEM) (Sigma, UK). This cell culture medium was supplemented with 10% Fetal Bovine Serum (Lonza, UK), 2mM L-glutamine (Lonza, UK), 1% v/v non-essential amino acids (Lonza, UK), and 1mM sodium pyruvate (Lonza, UK). The normal brain cell line Normal Human Astrocytes (NHA) was used as a control. Cells were maintained in a humidified incubator at 37°C with 5% CO2 and filtered air. All cells were passaged to 70-80% confluence and restricted to 5-7 passages.
Drug Preparation
The 2 mM stock concentrations of 17-AAG (Invivogen, UK) and VER (Tocris, UK) and 10 mM stock concentration of TMZ (Provided by Royal Preston Hospital, UK) were reconstituted in DMSO. Steps were followed to ensure that the final concentration of DMSO in the cell culture experiments did not exceed 0.08%. All compounds were purchased in pure powder form.
Cell viability and Chemosensitivity assay
The glioma cells 1321N1, GOS-3 and U87-MG were seeded at a density of 2000 cells/well in 96-well plates in triplicate for 24 h. After which, they were incubated for further 48 h at various concentrations of drug (TMZ, 17-AAG and VER). The untreated cells were used as control for each cell line. The inhibitory concentrations (IC50) of the drugs were determined using CellTiter-Glo luminescent cell viability assay (Promega, UK) using Tecan GENios Pros (Tecan Austria) (14,15).
In order to determine the chemosensitivity of all three glioma cell lines towards the inhibitory compounds, cells were treated with the IC50 concentrations of 17-AAG, VER and TMZ (Table 1). After 48 h treatment, the luminescent signals were measured following the standard protocol (14).
Inhibitory concentrations of the pharmacological compounds for 1321N1, GOS-3 and U87-MG glioma cell lines.
| Cell lines | TMZ (μM) | 17-AAG (nM) | VER (μM) |
|---|---|---|---|
| 1321N1 | 135 ± 6 | 100 ± 2 | 12 ± 4 |
| GOS-3 | 147 ± 11 | 100 ± 9 | 12 ± 9 |
| U87-MG | 180 ± 3 | 80 ± 1 | 13 ± 1 |
(n=3, ±S.D)
Drug treatment for microarray analysis
U87-MG cells were seeded in 75 cm2 culture flasks 24 h prior to treatment. Cells were treated with IC50 concentrations of the three drugs TMZ, 17-AAG and VER. The untreated cells (control) and drug treated cells were harvested after 48 h and stored in RNA protected cell reagent (Qiagen, UK) at -80°C. The cell samples were then used for microRNA analysis (IMGM Laboratories, Germany).
miRNA Microarray analysis
Total RNA was isolated using the miRNeasy Mini Kit (Qiagen) according to manufacturer's instructions. Aliquots of total RNA samples were used to determine the RNA concentration and purity using the Nano Drop ND-1000 spectral photometer (peqlab). RNA integrity was assessed by capillary electrophoresis using RNA 6000 Nano LabChip Kits and Bioanalyzer 2100 (Agilent Technologies). As recommended, total RNA samples with RNA integrity number (RIN) value ≥ 7.5 was used for the labelling the reaction to achieve high quality cRNA.
Labelling and Microarray hybridization
The samples containing 100 ng of total RNA were spiked with in vitro synthesised oligonucleotides prior to labelling (MicroRNA Spike-in Kit, Agilent technologies). Sample's total RNA was then introduced into ligation-based labelling reaction. According to Agilent's miRNA Complete Labelling and Hyb Kit protocol, total RNA was treated with Calf Intestinal Alkaline Phosphatase (CIP) followed by labelling of dephosphorylated RNA using T4 RNA Ligase. This method involves ligation of one Cyanine 3-pCp molecule to the 3' end of a RNA molecule with greater than 90% efficiency, cyanine 3-pCp labels and hybridizes mature miRNA. The total amount of each cyanine 3-pCp-labeled miRNA sample was then prepared for one-color Hybridization. The Labelled miRNA samples were then incubated at 55°C for 20 h on Agilent Human miRNA Microarrays Release 19.0 in 8 × 60K format (AMADID 046064). The fluorescent signals were detected on an Agilent DNA microarray scanner and the images were extracted using the Feature Extraction software version 10.7.3.1.
Bioinformatics analysis
Normalization, quality control, statistical data analysis, miRNA annotation and visualization was carried out using statistical software such as Feature Extraction 10.7.3.1, GeneSpring GX 12.5 and Spotfire Decision Site 9.1.2. The raw data was normalised using Quantile Normalisation and similarities within and between differentially expressed miRNAs samples were evaluated using Pearson's correlation coefficient (r) and was also visualised using a correlation heat map. The application of Benjamini and Hochberg False Discovery Rate (FDR) adjustment was utilized to avoid multiple testing errors and estimated the corrected significance level (p value) (16). Fold change (FC) was calculated to determine differential expression of samples. PCA (Principle component analysis) plot, Dot plot and Hierarchical clustering were analysed for comparison of differential groups of data subsets and clustering of similar expressions.
miRNA Target prediction
Target predicting databases among which Target Scan Human 6.2, DIANA-microT, miRBD miRBase V18 and miRo- the miR ontology were used for predicting potential target genes. In order to reduce false target genes obtained, mRNA data sets of predicted targets were further filtered on the basis of co-predicted targets from different algorithms (17-19).
Protein extraction and Akt/ PKB kinase activity assay
The CelLytic™ M Cell Lysis Reagent (Sigma, UK) was used together with supplements of a protease inhibitor cocktail for collection and lysis of the cells (14). Total protein was isolated from the remaining cell debris by centrifugation at 13,000 rpm for 15 min. The protein concentration was determined using the Bradford protein assay. The non-radioactive Akt/PKB kinase activity assay was used to measure Akt/PKB kinase activity in the solution phase (Assay Designs, UK; Cat No. EKS-400A). From the total protein isolated as described above, 10 µg of protein from each sample were used to perform the Akt kinase assay (5).
Hsp70/90 ELISA assay
HSP70 ELISA assay (Assay Designs, UK; ADI-EKS-700B) and HSP90 ELISA assay (Assay Designs, UK; ADI-EKS-895) were used to determine and quantitate inducible HSP70 and 90 activities in the cell lysate samples, respectively. From the total protein isolated using 106-107 cells, 500 ng/ml of cell lysate from each sample was used to perform HSP70 and 90 assay according to the manufacturer's instructions.
Statistical analysis
The cell viability and chemo sensitivity data was analysed using PASW statistical 18 packages and Graph pad Prism for One-Sample Students T-test and Paired-Sample T-test. The data presented are the mean of three independent experiments ±SD (standard deviation) and the values of *p < 0.05 and **p < 0.001 were considered to be statistically significant.
Results
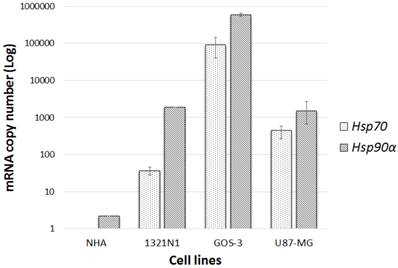
The mRNA transcription levels of hsp90α (the induced subunit of hsp90) and hsp70 were measured using qRT-PCR in glioma and NHA cell lines. Both glioma and NHA cell lines showed various levels of hsp90α transcription. Glioma cell lines transcribed hsp90α at induced levels in comparison to hsp70. Low constitutive hsp90α and no hsp70 mRNAs were detected in the normal NHA cells. Thus, only glioma cell lines were used for further analysis while the normal cell line was exempted (Fig.1).
hsp90α and hsp70 gene transcription level: Gene transcriptional levels compared normal cell lines (NHA) to glioma cell lines (1321N1, GOS-3 and U87-MG). Data represented (n=3, ±S.D).
Akt/PKB kinase acts as client proteins for the HSP90-HSP70 complex, playing an essential role in stabilising and in the activation of the multiprotein complex. Hence HSP70 and HSP90 activities were assessed by measuring the Akt/PKB kinase levels (Table 2).
Akt Kinase activity assay: Akt kinase activity levels in glioma cells before and after treatment. Untreated cells were used as controls (n=3, ±S.D)
| Cell lines | Kinase activity for 1 μg Protein |
|---|---|
| 1321N1 | 84 ± 37 |
| 1321N1 TMZ | 22 ± 3 |
| 1321N1 17-AAG | 7 ± 3 |
| 1321N1 VER | 52 ± 4 |
| GOS-3 | 201 ± 7 |
| GOS-3 TMZ | 69 ± 4 |
| GOS-3 17-AAG | 82 ± 6 |
| GOS-3 VER | 156 ± 5 |
| U87-MG | 121 ±15 |
| U87-MG TMZ | 17 ± 3 |
| U87-MG 17-AAG | 32 ± 5 |
| U87-MG VER | 20 ± 2 |
The data illustrates a significant inhibitory effect demonstrated by the IC50 of the three drugs on the U87-MG cells and therefore the U87-MG cells line was used for further studies.
U87-MG cells treated with TMZ, 17-AAG and VER were subjected to miRNA microarrays and the untreated U87-MG cells were used as a control.
The identification of significantly differentially expressed miRNAs on the three pair wise comparisons is presented in Table 3.
Summary of the number of significantly up and down regulated miRNAs from U87-MG cells treated with TMZ, 17-AAG and VER compared with the untreated cells as control.
| Comparison | p(Corrected) ≤ 0.05 FC ≥ 2 | p≤ 0.05 FC ≥ 2 | |||
|---|---|---|---|---|---|
| Up | Down | Up | Down | ||
| TMZ Vs Control | 0 | 0 | 19 | 7 | |
| 17-AAG Vs Control | 0 | 0 | 4 | 1 | |
| VER Vs Control | 9 | 4 | 61 | 62 | |
FC is fold change. The uncorrected p value uses non-stringent filtering. The multiple testing errors are not taken into account.
The magnitude of involving both up and down regulation of miRNAs from U87-MG cells treated with TMZ, 17-AAG and VER compared with the untreated cells as control are presented in Table 4.
Differential miRNAs expression
| TMZ vs control | 17-AAG vs control | VER vs control | |||||
|---|---|---|---|---|---|---|---|
| Up | FC | Up | FC | Up | FC | Down | FC |
| hsa-miR-215 | 164.61 | hsa-miR-3161 | 29.29 | hsa-let-7e-5p | 2.03 | hsa-miR-10b-3p | -31.15 |
| hsa-miR-194-5p | 138.93 | hsa-miR-557 | 18.90 | hsa-let-7g-5p | 2.26 | hsa-miR-1225-5p | -2.59 |
| hsa-miR-550a-3p | 64.87 | hsa-miR-3692-5p | 17.71 | hsa-miR-103a-3p | 2.62 | hsa-miR-1227-5p | -2.94 |
| hsa-miR-769-5p | 63.60 | hsa-miR-664b-5p | 17.18 | hsa-miR-107 | 2.21 | hsa-miR-1234-3p | -2.53 |
| hsa-miR-744-5p | 63.11 | hsa-miR-1180 | 23.93 | hsa-miR-1234-5p | -2.15 | ||
| hsa-miR-449a | 61.97 | hsa-miR-125a-5p | 2.62 | hsa-miR-135a-3p | -5.36 | ||
| hsa-miR-101-3p | 49.19 | hsa-miR-128 | 2.55 | hsa-miR-138-2-3p | -3.19 | ||
| hsa-miR-200c-3p | 33.26 | hsa-miR-1285-3p | 2.26 | hsa-miR-139-3p | -3.60 | ||
| hsa-miR-652-3p | 29.38 | hsa-miR-1306-3p | 2.15 | hsa-miR-1469 | -10.14 | ||
| hsa-miR-7-1-3p | 23.49 | hsa-miR-148b-3p | 2.32 | hsa-miR-1587 | -2.24 | ||
| hsa-miR-4521 | 23.13 | hsa-miR-152 | 2.84 | hsa-miR-1915-3p | -2.59 | ||
| hsa-miR-500a-3p | 19.00 | hsa-miR-185-5p | 2.22 | hsa-miR-197-5p | -2.33 | ||
| hsa-miR-4758-3p | 18.65 | hsa-miR-194-5p | 62.83 | hsa-miR-2861 | -2.90 | ||
| hsa-miR-557 | 17.92 | hsa-miR-1972 | 2.03 | hsa-miR-3137 | -2.11 | ||
| hsa-miR-382-5p | 16.00 | hsa-miR-204-5p | 2.02 | hsa-miR-3188 | -2.25 | ||
| hsa-miR-192-5p | 4.94 | hsa-miR-215 | 60.74 | hsa-miR-3196 | -3.11 | ||
| hsa-miR-324-5p | 2.10 | hsa-miR-23b-3p | 2.18 | hsa-miR-3663-3p | -2.02 | ||
| hsa-miR-331-3p | 2.08 | hsa-miR-26a-5p | 2.20 | hsa-miR-371b-5p | -3.13 | ||
| hsa-miR-148b-3p | 2.03 | hsa-miR-30c-2-3p | 2.19 | hsa-miR-3940-5p | -2.01 | ||
| hsa-miR-30d-5p | 2.03 | hsa-miR-4428 | -3.08 | ||||
| hsa-miR-30e-3p | 2.05 | hsa-miR-4430 | -3.13 | ||||
| hsa-miR-3152-3p | 2.39 | hsa-miR-4446-3p | -2.63 | ||||
| hsa-miR-3158-5p | 2.16 | hsa-miR-4462 | -2.58 | ||||
| hsa-miR-3161 | 2.18 | hsa-miR-4478 | -2.23 | ||||
| Down | FC | Down | FC | hsa-miR-324-5p | 2.12 | hsa-miR-4505 | -2.48 |
| hsa-miR-3654 | -72.55 | hsa-miR-345-5p | -2.03 | hsa-miR-342-3p | 2.71 | hsa-miR-4507 | -2.08 |
| hsa-miR-335-3p | -70.32 | hsa-miR-3617-5p | 61.40 | hsa-miR-4515 | -2.30 | ||
| hsa-miR-3620-5p | -49.68 | hsa-miR-374b-5p | 2.11 | hsa-miR-4530 | -2.89 | ||
| hsa-miR-431-3p | -41.62 | hsa-miR-379-5p | 54.30 | hsa-miR-4532 | -2.02 | ||
| hsa-miR-4636 | -32.06 | hsa-miR-382-5p | 57.71 | hsa-miR-4538 | -2.04 | ||
| hsa-miR-193a-5p | -2.20 | hsa-miR-432-5p | 2.15 | hsa-miR-4634 | -3.26 | ||
| hsa-miR-4697-5p | -2.06 | hsa-miR-4443 | 3.03 | hsa-miR-4636 | -33.24 | ||
| hsa-miR-4458 | 92.84 | hsa-miR-4647 | -26.47 | ||||
| hsa-miR-4484 | 3.37 | hsa-miR-4656 | -2.26 | ||||
| hsa-miR-449a | 76.65 | hsa-miR-4665-5p | -2.81 | ||||
| hsa-miR-449c-5p | 43.48 | hsa-miR-4721 | -2.10 | ||||
| hsa-miR-4506 | 42.65 | hsa-miR-4728-5p | -2.03 | ||||
| hsa-miR-4521 | 55.63 | hsa-miR-4739 | -2.04 | ||||
| hsa-miR-4710 | 39.07 | hsa-miR-4741 | -2.47 | ||||
| hsa-miR-4726-5p | 2.16 | hsa-miR-4767 | -42.21 | ||||
| hsa-miR-486-5p | 23.39 | hsa-miR-4787-3p | -36.67 | ||||
| hsa-miR-493-5p | 18.18 | hsa-miR-4787-5p | -2.66 | ||||
| hsa-miR-497-5p | 2.01 | hsa-miR-5001-5p | -2.42 | ||||
| hsa-miR-498 | 2.11 | hsa-miR-5006-5p | -2.07 | ||||
| hsa-miR-500a-3p | 17.46 | hsa-miR-503-5p | -51.76 | ||||
| hsa-miR-5010-5p | 17.79 | hsa-miR-513a-5p | -3.22 | ||||
| hsa-miR-502-3p | 32.91 | hsa-miR-513b | -3.27 | ||||
| hsa-miR-5196-5p | 37.43 | hsa-miR-513c-5p | -3.49 | ||||
| hsa-miR-520c-3p | 2.24 | hsa-miR-548q | -126.10 | ||||
| hsa-miR-532-3p | 2.71 | hsa-miR-5585-3p | -95.73 | ||||
| hsa-miR-550a-3p | 81.24 | hsa-miR-575 | -3.96 | ||||
| hsa-miR-6134 | 2.23 | hsa-miR-6068 | -3.95 | ||||
| hsa-miR-652-3p | 40.79 | hsa-miR-6089 | -2.57 | ||||
| hsa-miR-7-1-3p | 61.35 | hsa-miR-6090 | -2.01 | ||||
| hsa-miR-744-5p | 43.32 | hsa-miR-6125 | -3.06 | ||||
| hsa-miR-758-5p | 3.04 | hsa-miR-638 | -2.83 | ||||
| hsa-miR-769-5p | 48.11 | hsa-miR-650 | -15.32 | ||||
| hsa-miR-885-5p | 28.68 | hsa-miR-6722-3p | -2.22 | ||||
| hsa-miR-9-5p | 2.38 | hsa-miR-718 | -8.71 | ||||
| hsa-miR-98-5p | 2.63 | hsa-miR-921 | -5.53 | ||||
| hsa-miR-940 | -3.82 | ||||||
miRNAs are known to regulate the expression of several distinct mRNA targets. Examples of the target genes of differentially expressing miRNA were determined using different target predicting algorithms such as Target Scan Human 6.2, DIANA-microT and miRBD miRBase V18. The miRNAs were overlapped and genes predicted with two or more algorithms were used to avoid false targeting (Table 5).
The 14 overlapped miRNA between TMZ and VER, 13 upregulated and one downregulated with their fold change and the predicated genes they control.
| Upregulated miRNA | TMZ vs control FC | VER vs control FC | Gene | |
|---|---|---|---|---|
| hsa-miR-215 C* | 164.61 | 60.74 | Alcam Activate leukocyte cell adhesion molecule | CD166 antigen is transmembrane glycoprotein that in humans it is encoded by the ALCAM gene. CD166 has also been used as a potential cancer stem cell marker. |
| hsa-miR-194-5p | 138.93 | 62.83 | Dnmt3a DNA methyl transferase 3A | This gene encodes a DNA methyltransferase which is thought to function in epigenetic CPG methylation, rather than maintenance methylation. |
| TRD1 tRNA aspartic acid methyltransferase1 | This gene encodes a protein responsible for the methylation of aspartic acid transfer RNA, specifically at the cytosine-38 residue in the anticodon loop. This enzyme also possesses residual DNA-(cytosine-C5) methyltransferase activity. | |||
| hsa-miR-550a-3p | 64.87 | 81.24 | Dnmt3a DNA methyl transferase 3A | This gene encodes a DNA methyltransferase which is thought to function in epigenetic CPG methylation, rather than maintenance methylation. |
| hsa-miR-769-5p C* | 63.60 | 48.11 | TRD1 tRNA aspartic acid methyltransferase 1 | This gene encodes a protein responsible for the methylation of aspartic acid transfer RNA, specifically at the cytosine-38 residue in the anticodon loop. This enzyme also possesses residual DNA-(cytosine-C5) methyltransferase activity. |
| hsa-miR-744-5p C* | 63.11 | 43.32 | DNAJC16 | HSP40, subfamily C, member 16 |
| hsa-miR-449a | 61.97 | 76.65 | Cyclin E2 | Distinct functions of cyclin in development and cancer |
| Cyclin Dependent Kinase (Cdk6) | Knockdown of cdk6 enhances glioma sensitivity of chemotherapy. | |||
| hsa-miR-652-3p | 29.38 | 40.79 | TRMT5 tRNA methyltransferase 5 | TRMT5 posttranscriptionally methylates the N1 position of guanosine-37 (G37) in selected tRNAs using S-adenosyl methionine |
| hsa-miR-7-1-3p | 23.49 | 61.35 | TARDBP TAR DNA binding protein | Overexpression caused partially P53 dependent G2/M arrest and P53 independent cell death |
| Dnmt3a DNA methyl transferase 3A | This gene encodes a DNA methyltransferase which is thought to function in epigenetic CPG methylation, rather than maintenance methylation. | |||
| hsa-miR-4521 | 23.13 | 55.63 | GABARAPL2 | GABA(A) receptor-associated protein-like 2 |
| hsa-miR-500a-3p C* | 19.00 | 17.46 | FBXW7 F-box and WD repeat domain contain 7, E3 ubiquitin protein ligase | FBXW7 beta form is suppressed in human glioma cells |
| hsa-miR-382-5p | 16.00 | 57.71 | TOP1 topoisomerase (DNA) I | DNA topoisomerase controls and alters the topologic states of DNA during transcription. |
| hsa-miR-324-5p | 2.10 | 2.12 | MGAT3 Mannose (beta-1,4)-glycoprotein beta-1,4-acetylglucosaminyltransferase | Transfection of the gene in glioma cells effect glycoconjugate and enhance cell death |
| hsa-miR-148b-3p | 2.03 | 2.32 | Dnmt3B DNA methyl transferase 3 beta | DNA (cytosine-5-)-methyltransferase 1 has a role in the establishment and regulation of tissue-specific patterns of methylated cytosine residues. Aberrant methylation patterns are associated with certain human tumours. |
| downregulated miRNA | ||||
| hsa-miR-4636 | -32.06 | -33.24 | TXNDC5 thioredoxin domain containing 5 (endoplasmic reticulum) | This gene encodes a protein-disulfide isomerase. Its expression is induced by hypoxia and its role may be to protect hypoxic cells from apoptosis |
C* Corrected p value
HSP70 and 90 protein levels were measured using specific Elisa kits for treated and untreated cells (Table 6).
HSP70 and 90 activity assays: HSP70 and 90 activity levels in U87-MG cells before (control) and after treatment.
| HSP70 activity for 0.5 µg protein | HSP90 activity for 0.5 µg protein | |
|---|---|---|
| Control | 77 ± 11 | 558 ± 62 |
| TMZ | 67 ± 17 | 92 ± 12 |
| 17-AAG | 77 ± 9 | 322 ± 36 |
| VER | 62 ± 6 | 198 ± 16 |
(n=3, ±S.D)
Discussion
The co-chaperones, HSP70 and 90 proteins are key mediators in regulating cell survival by affecting proliferating pathways, cell cycle progression and apoptosis. Due to their low constitutive and highly induced cancer expression levels, HSP70 and 90 proteins are considered valid anti-glioma targets.
The mRNA levels of hsp70 and 90 were initially determined in three glioma cell lines, namely; 1321N1, GOS-3 and U87-MG and compared to the normal human astrocyte cell line, NHA. Although, the glioma cell lines showed induced transcription levels of both genes, hsp90 is more upregulated than hsp70. Because hsp90 was marginally transcribed at a constitutive level and no hsp70 mRNAs were detected in the normal cell line NHA, the investigation focussed only on the three glioma cell lines.
The glioma cell lines were subjected to the IC50 using two different treatments, VER and 17-AAG to inhibit HSP70 and 90 expressions, respectively. The cell lines treated with glioma chemotherapeutic drug TMZ were used as positive controls, while the untreated cell lines were used as negative controls. The average IC50 for 17-AAG, TMZ and VER in the three glioma cell lines were 0.09, 153 and 13 μM, respectively, suggesting that the antichaperones are more potent compounds than TMZ.
HSP70/90 proteins stabilised with client proteins such as Akt/PKB kinase behave as oncoproteins suppressing cell proliferation and regulating apoptosis of malignant cells (20). Hence, measuring Akt kinase activities in glioma cell lines can be indicative of HSP70/90 activity. Akt/PKB kinase activities were measured using ELISA kits in treated and untreated cells. Akt kinase activity in 1321N1 cells treated with TMZ, 17-AAG and VER were reduced to 26, 8 and 62 %, respectively. GOS-3 cells were reduced upon treatment to 34, 41 and 78 %, respectively, while U87-MG cells showed a reduction to 14, 26 and 17 %, respectively. In all three cell lines, Akt kinase was reduced to varying degrees on treatment with TMZ, 17-AAG and VER.
Interestingly TMZ inhibited Akt kinase at varying levels in the three cell lines used in this study.
Although there is a significant Akt kinase inhibition following treatment with VER and 17-AAG in all three cell lines, U87-MG showed almost equal inhibition between the two treatments. Based on this data and previous findings from our lab, the U87-MG cell line was employed for further investigations.
Inhibiting HSP90 protein highly induced HSP70 and subsequently compromised the treatment efficacy (8), furthermore, blocking both HSP70 and 90 using pharmacological inhibitors assisted treatment (21).
In this study miRNA profiling was used in order to assess the treatment between 17-AAG and VER as HSP90 and 70 inhibitors, respectively in glioma cells in comparison to TMZ.
U87-MG cells were treated with the IC50 of 17-AAG, VER and TMZ. The differentially transcribed miRNA in each group of the treated cells were compared to the untreated cells. The microarrays were carried out in duplication for accuracy. Differential miRNA expressions were assessed for three pair wise comparisons. Stringent filtering delivered very few miRNAs in cells treated with VER (9 upregulated and 4 downregulated), thus, non-stringent filtering was applied to the data (uncorrected) and resulted in the identification of 154 miRNAs, 84 of which were upregulated. The cells treated with VER were the only cohort that were subjected to stringent filtering where multiple testing errors were taken into account and false discovery rate was controlled and limited to a maximum level of 5%.
17-AAG was the first geldanamycin analogue to enter clinical trials (22). Previously we demonstrated the effectiveness of 17-AAG using U87-MG [5,14]. Interestingly in this study, 17-AAG influenced miRNA expression profile by the upregulation of four and downregulation of one miRNA, however, the only treatment that showed corrected data that stands against the stringent filter was the VER treated cells.
The data showed overlapping of 16 miRNAs between treatments, 14 of the 16 overlapped miRNAs were shared between TMZ and VER treated cells. Of the 14 overlapped miRNAs, 13 that upregulated were further analysed for gene prediction using software packages to include; Target Scan Human 6.2, DIANA-microT, miRBD miRBase V18 and miRo- the miR ontology.
Although miRNA may regulate more than one gene, we limited our miRNA gene prediction study to those with top scorer prediction or validated.
miR-215 was upregulated by 165 and 61 fold in cells treated with TMZ and VER, respectively, and below the fold change detection in cells treated with 17-AAG. It has been reported that miR-215 upregulation leads to down regulation of Alcam in the human gastric epithelial cell line (HFE145) (23).
miR-449 regulates Cyclin E2 and Cyclin Dependent Kinase 6 (Cdk 6) by inhibiting cell progression activity in cancer cells and also indirectly regulates Cdk4, as its 3'UTR is dissimilar to the miR-449 sequence (24). miR-744-5p targets DNAJ, also known as HSP40 a molecular chaperone protein. This family of proteins contain a 70 amino acid consensus sequence known as the J domain which is known to interact with HSP70. DNAJC16 belongs to the evolutionarily conserved DNAJ/HSP40 family of proteins (25).
miR-194-5p was upregulated by 139 and 63 fold in cells treated with TMZ and VER, respectively and has been identified on Chromosome 1 and targets Dnmt3a (26). Interestingly, miR-550a-3p, miR-7-1-3p also targets Dnmt3a and miR-148b-3p targets Dnmt3b. miR-194-3p and miR-769-5p target TRD1 tRNA aspartic acid methyltransferase1. miR652-3p targets TRMT5 tRNA methyltransferase 5.
The human genome contains hundreds of miRNAs and each miRNA can repress hundreds of genes, regulating almost every cellular process. Gene repressing or silencing may occur either via mRNA degradation or preventing mRNA from being translated (27). If there is a complete complementation between the miRNA and the target mRNA sequence, Ago2 can cleave the mRNA and lead to mRNA degradation. However, if there is incomplete complementation, the silencing is achieved by preventing translation (28).
As previously listed, 6 of 13 upregulated overlapped miRNAs target various types of methyltransferases, suggesting that TMZ and VER treatments downregulate methyation processes through enhanced corresponding miRNAs, albeit via different mechanisms.
HSP70 or HSP1A1 is a ubiquitous molecular chaperone that contributes to cancer cell survival via anti-apoptotic functions. It functions in various biological processes including modulation of polypeptide folding, protein degradation, translocation across membranes, and protein-protein interactions. HSP70 is post-translationally modified by phosphorylation, ubiquitination and glycosylation. Enhanced HSP70 methylation is detected in various types of human cancer although the methylation was barely detectable in the corresponding non-neoplastic tissues. These findings demonstrate a crucial role for HSP70 methylation in human carcinogenesis (29).
VER is a potent inhibitor of Hsp70 which has been shown to inhibit HSP70 as well as heat shock cognate 71 kDa protein (Hsc70) and 78 kDa glucose-regulated protein (Grp78). It is known to have an affinity to bind to HSP90β to a lesser extent (30). X-ray crystallography analysis reveals that VER binds to the ATPase pocket of Hsp70 leading to the inhibition of the intrinsic ATPase activity of HSP70 and subsequent downstream events. VER binding to HSP70 could inhibit methylation via negative feedback or post-translational processes triggering enhanced selective miRNAs.
On the other hand, the therapeutic benefit of TMZ depends on its ability to alkylate/methylate DNA, which, most often occurs at the N-7 or O-6 positions of guanine residues. This methylation damages the DNA and triggers the death of tumour cells (31). The interaction between c-Myc and Dnmt3a would then activate DNA methyltransferase which increases local de novo DNA methylation in the CpG islands of the MGMT promoter. MGMT promoter methylation silences MGMT gene expression and this sensitizes glioma cells to TMZ (32). However, data from our studies and others showed the lack of MGMT methylation in some cell lines including U87-MG (31,32), suggesting the downregulation of methylation activity, which supports our findings. Furthermore, the protein data showed that the HSP70 protein was inhibited on treatment with TMZ, 17-AAG and VER by 13, 0 and 20 %, respectively, while HSP90 protein was inhibited by 84, 43 and 65 %, respectively, clearly highlighting the affinity of these three compounds towards HSP90 compared to HSP70. TMZ and VER showed better inhibition of HSP90 and 70 than 17-AAG, which could suggest that TMZ may share some pathways with the chaperones.
Conclusion
Previously we reported that RNAi mediated hsp90α knockdown in combination with 17-AAG showed a therapeutic value for glioma in vitro and in vivo. However, further proteomic studies from our laboratory and others showed that downregulating HSP90 protein was compensated by the induction of the cochaperone HSP70 protein. Here, 17-AAG was used to selectively inhibit HSP90 activity, while VER was used to dual inhibit HSP70 and 90. The overall expression inhibitory effects of 17-AAG and VER were compared to the standard glioma treatment TMZ using miRNA profiling.
The novel findings of this study indicate that miRNA profiling showed minimum variation between 17-AAG treated and untreated U87-MG cells and some overlap between treatments, which was rather surprising because 17-AAG and VER share common antichaperone inhibitory activities with some variation in selectivity. Furthermore, Akt kinase, HSP70 and 90 protein levels were found to be higher in 17-AAG treated cells than VER and TMZ treated cells suggesting less inhibition of the chaperone activity. This agrees with our previous findings that HSP70 compensates for the inhibited activity of HSP90.
Unexpectedly, VER and TMZ show greater inhibition of Akt kinase, HSP70 and 90 protein levels and shares 13 upregulated miRNAs, suggesting a similarity in the mode of action. However, VER may be a better therapeutic alternative to TMZ due to its potent activity with a lower IC50 and selectivity to cancer cells only due to the induced chaperone activity, reducing the toxic side effects.
Future investigations to include the use of glioma and other primary cancer cells are required in order to evaluate VER as a strong chaperone inhibitor and a therapeutic agent.
Acknowledgements
The authors would like to thank The University of Central Lancashire, School of Pharmacy & Biomedical Science for partly sponsoring this research and Dr Stefan Kotschote, head of laboratory of IMGM for his help in the analysis.
Conflicts of Interest
The authors would like to declare that there are no conflicts of interest.
References
1. Mcconnell JR, Mcalpine SR. Heat shock proteins 27, 40, and 70 as combinational and dual therapeutic cancer targets. Bioorganic & Medicinal Chemistry Letters. 2013;23:1923-1928
2. Matokanovic M, Barisic K, Filipovic-Grcic J, Maysinger D. Hsp70 silencing with siRNA in nanocarriers enhances cancer cell death induced by the inhibitor of Hsp90. Euro. J. Pharmaceutical Sciences. 2013;50:149-158
3. Ciocca DR, Arrigo AP Calderwood SK. Heat shock proteins and heat shock factor 1 in carcinogenesis and tumor development: an update. Archives of Toxicology. 2013;87:19-48
4. Powers MV, Jones K, Barillari C, Westwood I, Montfort RLM, Workman P. Targeting HSP70: The second potentially druggable heat shock protein and molecular chaperone? Cell Cycle. 2010;9:1542-1550
5. Mehta A, Shervington A, Howl J, Jones S, Shervington L. Can RNAi-mediated hsp90α knockdown in combination with 17-AAG be a therapy for glioma? FEBS Open Bio. 2013;3:271-278
6. Zajac M, Gomez G, Benitez J, Martinez-Delgado B. Molecular signature of response and potential pathways related to resistance to the HSP90 inhibitor, 17-AAG, in breast cancer. BMC Medical Genomics. 2010;3:44-57
7. Chiosis G, Huezo H, Rosen N, Mimnaugh E, Whitesell L, Neckers L. 17-AAG: Low target binding affinity and potent cell activity-Finding an explanation. Molecular Cancer Therapeutics. 2003;2:123-129
8. Munje C, Shervington L, Khan Z, Shervington A. Could Upregulated Hsp70 Protein Compensate for the Hsp90-Silence-Induced Cell Death in Glioma Cells? Int. J. Brain Science. 2014. 2014 Article ID 652643
9. Macias AT, Williamson DS, Allen N, Borgognoni J, Clay A, Daniels Z, Dokurno P, Drysdale MJ, Francis GL, Graham CJ, Howes R, Matassova N, Murray JB, Parsons R, Shaw T, Surgenor AE, Terry L, Wang Y, Wood M, Massey AJ. Adenosine-Derived Inhibitors of 78 kDa Glucose Regulated Protein (Grp78) ATPase: Insights into Isoform Selectivity. J. Medicinal Chemistry. 2011;54:4034-404
10. Volinia S, Calin GA, Liu CG, Ambs S, Cimmino A, Petrocca F, Visone R, Iorio M, Roldo C, Ferracin M, Prueitt RL, Yanaihara N, Lanza G, Scarpa A, Vecchione A, Negrini M, Harris CC, Croce CM. A microRNA expression signature of human solid tumors defines cancer gene targets. PNAS. 2006;103:2257-2261
11. Ryu B, Hwang S, Alani RM. MicroRNAs as an emerging target for melanoma therapy. The Journal of Investigative Dermatology. 2013;133:1137-1139
12. Zhang A, Hao J, Wang K, Huang Q, Yu K, Kang C, Wang G, Jia Z, Han L, Pu P. Down-regulation of miR-106b suppresses the growth of human glioma cells. J. Neuro-Oncology. 2013;112:179-189
13. Kureel J, Dixit M, Tyagi AM, Mansoori MN, Srivastava K, Raghuvanshi A. Maurya R, Trivedi R, Goel A, Singh D. miR-542-3p suppresses osteoblast cell proliferation and differentiation, targets BMP-7 signaling and inhibits bone formation. Cell Death Disease. 2014;5:e1050
14. Mehta A, Shervington L, Munje C, Shervington A. A novel therapeutic strategy for the treatment of glioma, combining chemical and molecular targeting of Hsp90. Cancers. 2011;3:4228-4244
15. Cruickshanks N, Shervington L, Patel R, Munje C, Thakkar D, Shervington A. Can hsp90alpha-targeted siRNA combined with TMZ be a future therapy for glioma? Cancer Investigation. 2010;28:608-614
16. Benjamini Y, Hochberg Y. Controlling the false discovery rate: A practical and powerful approach to multiple testing. J. Royal Statistical Society, Series B (Methodological). 1995;57:289-300
17. Griffiths-Jones S. miRBase: microRNA sequences and annotation. In Book Current Protocols in Bioinformatics, Editor Andreas D.Baxevanis, John Wiley & Sons, Inc. USA. 2010 Chapter 12: 1934-3396
18. Griffiths-Jones S, Saini HK, Van Dongen S, Enright AJ. miRBase: tools for microRNA genomics. Nucleic Acids Research. 2008(Supp):D154-158
19. Park K, Kim KB. miRTar Hunter: a prediction system for identifying human microRNA target sites. Molecules and Cells. 2013;35:195-201
20. Picard D. Heat-shock protein 90, a chaperone for folding and regulation. Cellular and Molecular Life Sciences CMLS. 2002;59:1640-1648
21. Zhang L, Fok JJL, Mirabella F, Aronson LI, Fryer RA, Workman P, Morgan GJ, Davies FE. Hsp70 inhibition induces myeloma cell death via the intracellular accumulation of immunoglobulin and the generation of proteotoxic stress. Cancer Letters. 2013;339:49-59
22. Goetz MP, Toft DO, Ames MM, Erlichman C. The Hsp90 chaperone complex as a novel target for cancer therapy. Annals of Oncology. 2003;14:1169-1176
23. Jin Z, Selaru FM, Cheng Y, Kan T, Agarwal R, Mori Y, Olaru AV, Yang J, David S, Hamilton JP, Abraham JM, Harmon J, Duncan M, Montgomery EA, Meltzer SJ. MicroRNA-192 and -215 are upregulated in human gastric cancer in vivo and suppress ALCAM expression in vitro. Oncogene. 2011;30:1577-1585
24. Yang X, Feng M, Jiang X, Wu Z, Li Z, Aau M, Yu Q. miR-449a and miR-449b are direct transcriptional targets of E2F1 and negatively regulate pRb-E2F1 activity through a feedback loop by targeting CDK6 and CDC25A. Genes & Development. 2009;23:2388-2393
25. Qiu XB, Shao YM, Miao S, Wang L. The diversity of the DnaJ/Hsp40 family, the crucial partners for Hsp70 chaperones. Cellular and molecular life sciences. 2006;63:2560-2570
26. Soni N, Mittal M. In silico mining identifies tumor suppressor gene's expression regulating DNA methyl transferases (DNMT) as miRNA targets in cancer. Int. J. Advanced Life Sciences (IJALS). 2012:5 ISSN 2277 - 758X
27. Broderick JA, Zamore PD. MicroRNA therapeutics. Gene Therapy. 2011;18:1104-1110
28. Lim LP, Lau NC, Garrett-Engele P, Grimson A, Schelter JM, Castle J, Bartel DP, Linsley PS, Johnson JM. Microarray analysis shows that some microRNAs downregulate large numbers of target mRNAs. Nature. 2005;433:769-73
29. Cho HS, Shimazu T, Toyokawa G, Daigo Y, Maehara Y, Hayami S, Ito A, Masuda K, Ikawa N, Field HI, Tsuchiya E, Ohnuma S, Ponder BA, Yoshida M, Nakamura Y, Hamamoto R. Enhanced HSP70 lysine methylation promotes proliferation of cancer cells through activation of Aurora kinase B. Nat Commun. 2012;3:1072
30. Massey AJ, Williamson DS, Browne H, Murray JB, Dokurno P, Shaw T, Macias AT, Daniels Z, Geoffroy S, Dopson M, Lavan P, Matassova N, Francis GL, Graham CJ, Parsons R, Wang Y, Padfield A, Comer M, Drysdale MJ, Wood M. A novel, small molecule inhibitor of Hsc70/Hsp70 potentiates Hsp90 inhibitor induced apoptosis in HCT116 colon carcinoma cells. Cancer Chemotherapy and Pharmacology. 2010;66:535-545
31. Patel R, Shervington L, Lea R, Shervington A. Epigenetic silencing of telomerase and non-alkylating agent as a novel therapeutic approach for glioma. Brain Res. 2008;1188:173-181
32. Pyko I, Nakada M, Sabit H, Teng L, Furuyama N, Hayashi Y, Kawakami K, Minamoto T, Fedulau A, Jun-ichiro H. Glycogen synthase kinase 3β inhibition sensitizes human glioblastoma cells to temozolomide by affecting O6-methylguanine DNA methyl-transferase promoter methylation via c-Myc signalling. Carcinogenesis. 2013;34(10):2206-2217
Author contact
![]() Corresponding author: Telephone: +44 (0) 1772893519, Fax: +44 (0) 1772892929, Email: aashervingtoncom
Corresponding author: Telephone: +44 (0) 1772893519, Fax: +44 (0) 1772892929, Email: aashervingtoncom