Impact Factor ISSN: 1837-9664

 Global reach, higher impact
J Cancer 2015; 6(4):394-402. doi:10.7150/jca.11212 This issue Cite
Research Paper
Clinical Implication of Performance Status in Patients with Hepatocellular Carcinoma Complicating with Cirrhosis
Hiroki Nishikawa1, ![]() , Ryuichi Kita1, Toru Kimura1, Yoshiaki Ohara1, Azusa Sakamoto1, Sumio Saito1, Norihiro Nishijima1, Akihiro Nasu1, Hideyuki Komekado1, Yukio Osaki1
, Ryuichi Kita1, Toru Kimura1, Yoshiaki Ohara1, Azusa Sakamoto1, Sumio Saito1, Norihiro Nishijima1, Akihiro Nasu1, Hideyuki Komekado1, Yukio Osaki1
1Department of Gastroenterology and Hepatology, Osaka Red Cross Hospital, Osaka, Japan
Received 2014-11-30; Accepted 2015-1-18; Published 2015-2-26
Abstract
Background and aims: The aims of our study were to elucidate the relationship between baseline characteristics of hepatocellular carcinoma (HCC) patients complicating with liver cirrhosis (LC) and performance status (PS) and to investigate the impact of PS on survival in patients with HCC complicating with LC.
Methods: In a total of 1003 patients diagnosed with HCC complicating with LC, we divided into two groups of PS ≥1 (n=251) and PS 0 (n=752) as evaluated by using the Eastern Cooperative Oncology Group criteria at the time of HCC diagnosis. Baseline characteristics between these two groups were compared. We also performed univariate and multivariate analyses of factors contributing to overall survival (OS).
Results: The median follow-up period was 1.6 years in the PS ≥1 group and 3.1 years in the PS 0 group. The 1-, 3- and 5-year OS rates after each initial therapy for HCC were 90.3%, 67.4% and 49.8%, respectively, in the PS 0 group and 73.4%, 42.0% and 17.7%, respectively, in the PS ≥1 group (P<0.001). A worse PS was significantly associated with age, gender, Child-Pugh classification, HCC stage, Japan Integrated Staging score, initial treatment option for HCC, maximum tumor size, alanine aminotransferase value, hypoalbuminemia, hyperbilirubinemia, renal insufficiency, hyponatremia, prothrombin time prolongation, platelet count and tumor marker level. In multivariate analyses, poorer PS was an independent predictor linked to OS with a hazard ratio of 1.773 (P<0.001).
Conclusions: PS was closely associated with status of HCC patients with LC and could be an important predictor for these populations.
Keywords: Hepatocellular carcinoma, Liver cirrhosis, Performance status, Prognostic factor, Propensity score matching
Introduction
Hepatocellular carcinoma (HCC) is the most common carcinoma worldwide. [1, 2] Treatment options for HCC vary depending on the liver function and HCC stage, and these include liver transplantation, surgical resection (SR), percutaneous ablative therapies (PATs), transcatheter arterial chemotherapy with or without embolization, systemic chemotherapy with molecular-targeted therapy (MTT) such as sorafenib and radiation therapy (RT). [3-5] HCC also carries a high risk of recurrence even when curative therapy was achieved at the initial therapy, with any underlying liver disease and tumor characteristics important predictors affecting the risk of HCC recurrence or survival. [1, 3, 4]
The performance status (PS) scale measures how the daily living ability is affected by the underlying disease. The PS scale recommended by the Eastern Cooperative Oncology Group (ECOG) is widely used by clinicians to assess the functional status in patients with various cancers. [6] It also serves as an indicator of cancer therapy and predictor of patient survival. The PS scale is a major survival determinant in patients with HCC and is specifically included in the Barcelona Clinic Liver Cancer (BCLC) staging system as an essential parameter for treatment guidance for HCC. [7, 8]
The most commonly identified complications in patients with liver cirrhosis (LC) include ascites, hepatic encephalopathy, esophageal varices, kidney dysfunction, susceptibility for infections such as spontaneous bacterial peritonitis, and development of HCC. Furthermore, severe muscle wasting or sarcopenia is one of the most common and frequently hidden complications in patients with LC, which negatively effect on survival and quality of life. All of these complications may potentially lead to deterioration of PS. [9, 10]
However, to our knowledge, there are few studies specifically evaluated the role of PS in patients with HCC complicating with LC. [11-14] These studies have been reported from Asian country only. Clinical factors linked to PS in patients with HCC complicating with LC have not been fully determined and also the prognostic significance of the PS has not been systematically assessed in these populations. The objectives of the present study were thus to elucidate the relationship between characteristics of HCC patients complicating with LC and PS and to investigate the impact of PS on survival in patients with HCC complicating with LC.
Patients and methods
Patients
A total of 1003 consecutive treatment-naïve patients diagnosed with HCC complicating with LC were admitted to the Department of Gastroenterology and Hepatology, Osaka Red Cross Hospital, Japan, between April 2005 and June 2014. LC was determined based on radiologic findings including typical computed tomography (CT) or ultrasound findings, laboratory parameters such as platelet count (less than 10 ×104/mm3) and/or histological findings obtained by surgical specimens or liver biopsy. We divided these patients into two groups of PS ≥1 (n=251) and PS 0 (n=752). PS was evaluated by using the ECOG performance scale ranging from 0 (asymptomatic) to 4 (confined to bed). We compared the overall survival (OS) rate between the PS ≥1 group and the PS 0 group. Prior to therapy for HCC, written informed consent for HCC therapy was obtained from all subjects. The ethics committee of our department approved the protocol for this study. The present study comprised a retrospective analysis of patients' medical records in our database and all treatments were performed in an open-label manner.
Diagnosis of HCC and HCC therapy
HCC was diagnosed based on the results from abdominal ultrasound and dynamic CT scan (hyperattenuation during the arterial phase in the entire or part of the tumor, and hypoattenuation in the portal-venous phase) and/or magnetic resonance imaging mainly as recommended by the American Association for the Study of Liver Diseases. [7] Arterial and portal phase dynamic CT images were obtained approximately 30 seconds and 120 seconds after injection of contrast material. In our hospital, abdominal angiography combined with CT (angio-CT) was routinely performed before therapy for HCC after obtaining informed consent from them for performing abdominal angiography. This was performed based on the fact that this technique was useful for detecting small satellite nodules as reported by Yamasaki et al. [15] Then, we confirmed HCC using CT during hepatic arteriography (CTHA) and CT during arterial-portography (CTAP). HCC stage was determined by TNM staging system by the Liver Cancer Study Group of Japan. [16] As for HCC therapy, the most appropriate treatment modality such as SR, PATs, transcatheter arterial therapy, MTT or RT for each patient was selected through discussion with surgeons, hepatologists and radiologists considering tumor status and liver function. [17, 18] Best supportive care was provided when treatment efficacy was considered limited or patients refused therapy for HCC. In the present analysis, there was no patient treated with liver transplantation.
Follow-up after initial therapy for HCC
Follow-up observation consisted of regularly blood tests and monitoring of tumor markers, including alpha-fetoprotein (AFP) and des-γ-carboxy prothrombin (DCP), which was measured using a chemiluminescent enzyme immunoassay (Lumipulse PIVKAII Eisai, Eisai, Tokyo, Japan). Dynamic CT scan was performed every 3-4 months after initial therapy for HCC. When HCC recurrence or disease progression was detected based on radiologic findings, most appropriate therapy was performed in each patient. [18]
Statistical analysis
The primary end point is OS. Continuous variables were compared by unpaired t test, and categorical variables were compared by Fisher's exact test. Data were analyzed using univariate and multivariate analyses. To analyze the significance of prognostic predictors, continuous variables were divided by the median values (or close to them) and treated as dichotomous covariates. The cumulative OS rate was calculated by Kaplan-Meier method and tested by log-rank test. A Cox proportional hazard model was used for multivariate analyses of factors with P value <0.01 in univariate analyses. These statistical methods were used to estimate the interval from each date of diagnosis for HCC until the date of death or last follow up date. Data were analyzed using SPSS software (SPSS Inc., Chicago, IL, USA) for Microsoft Windows. Data are expressed as mean ± standard deviation. A P value less than 0.05 were considered to be statistically significant.
Stratification by Japan Integrated Staging score and propensity score analysis
To compare the OS between patients with PS ≥1 and patients with PS 0, in three subgroups stratified by Japan Integrated Staging (JIS) score (group of JIS score of 0 or 1, group of JIS score of 2 or 3, and group of JIS score of 4 or 5), a propensity score model was used with an attempt to reduce potential biases in survival analysis. [19, 20] JIS score was calculated by summation of TNM stage score (stage I=0, stage II=1, stage III=2 and stage IV=3) and Child-Pugh classification (A=0, B=1 and C=2) as reported by Kudo, et al. [21] Possible variables associated with long-term survival of HCC patients, including age, sex, HCC stage, maximum tumor size, tumor number, cause of liver disease and Child-Pugh classification were included comprehensively for propensity score generation. With these selected variables, a logistic regression was applied to generate a continuous propensity score from 0 to 1. One-to-one matches between the PS ≥1 group and the PS 0 group patients were introduced into the subsequent analysis.
Results
Patient demographic characteristics between patients with PS 0 and PS ≥1
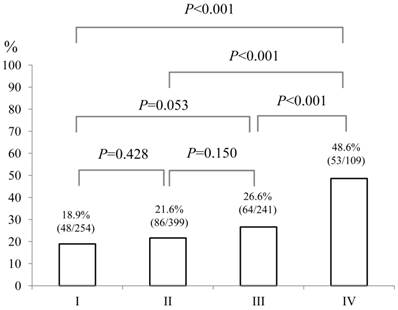
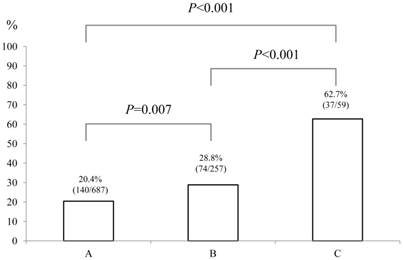
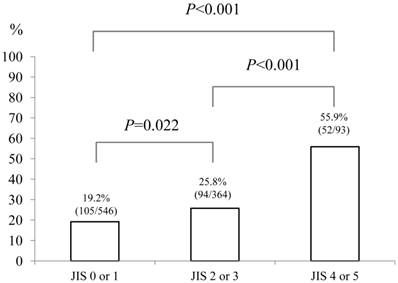
Baseline demographic characteristics of patients in PS 0 (n=752) and PS ≥1 (n=251: n=125 in PS 1, n=87 in PS 2, n=26 in PS 3 and n=13 in PS 4) are shown in Table I. A worse PS was significantly associated with age (P<0.001), gender (P=0.001), Child-Pugh classification (P<0.001), HCC stage (P<0.001), JIS score (P<0.001), initial treatment option for HCC (P<0.001), maximum tumor size (P<0.001), alanine aminotransferase (ALT) value (P<0.001), hypoalbuminemia (P<0.001), hyperbilirubinemia (P=0.038), renal insufficiency (P=0.005), hyponatremia (P<0.001), prothrombin time prolongation (P=0.029), platelet count (P=0.002), AFP value (P=0.016) and DCP value (P=0.012). In terms of proportion of patients with poor PS (PS ≥1), significant differences between HCC stage I (48/254, 18.9%) and IV (53/109, 48.6%) (P<0.001), II (86/399, 21.6%) and IV (P<0.001) and III (64/241, 26.6%) and IV (P<0.001) were found. (Fig. 1) Similarly, there were significant differences between Child-Pugh A (140/687, 20.4%) and B (74/257, 28.8%) (P=0.007), B and C (37/59, 62.7%) (P<0.001) and A and C (P<0.001) and between JIS score of 0 or 1 (105/546, 19.2%) and JIS score of 2 or 3 (94/364, 25.8%) (P=0.022), JIS score of 2 or 3 and JIS score of 4 or 5 (52/93, 55.9%) (P<0.001) and JIS score of 0 or 1 and JIS score of 4 or 5 (P<0.001). (Fig. 2 and 3)
Baseline characteristics between the performance status (PS) ≥1 group (n=251) and the PS 0 group (n=752).
| Variables | PS ≥1 (n=251) | PS 0 (n=752) | P value |
|---|---|---|---|
| Age (years) | 73.4 ± 8.1 | 68.1 ± 8.8 | <0.001a |
| Gender, male / female | 132 / 119 | 483 / 269 | 0.001b |
| Causes of liver disease | |||
| B / C / non B and non C /B and C | 19 / 177 / 51 / 4 | 77 / 524 / 141 / 10 | 0.624b |
| Child-Pugh, A / B / C | 140 / 74 / 37 | 547 / 183 / 22 | <0.001b |
| HCC stage, I /II / III / IV | 48 / 86 / 64 / 53 | 206 / 313 / 177 / 56 | <0.001b |
| JIS score, 0 / 1 / 2 / 3 / 4 / 5 | 32 / 73 / 58 / 36 / 36 / 16 | 162 / 279 / 192 / 78 / 40 / 1 | <0.001b |
| Initial therapy for HCC | |||
| SR / PAT / TAT / MTT / RT / none | 32 / 111 / 82 / 2 / 0 / 24 | 145 / 422 / 163 / 2 / 1 / 19 | <0.001b |
| Maximum tumor size (cm) | 3.9 ± 3.0 | 3.0 ± 2.2 | <0.001a |
| Tumor number (single/multiple) | 123 / 128 | 422/ 330 | 0.057b |
| AST (IU/L) | 67.8 ± 51.3 | 69.8 ± 54.5 | 0.593a |
| ALT (IU/L) | 45.8 ± 33.8 | 57.8 ± 47.3 | <0.001a |
| Total bilirubin (mg/dL) | 1.31 ± 1.33 | 1.11 ± 0.83 | 0.038a |
| Serum albumin (g/dL) | 3.44 ± 0.60 | 3.69 ± 0.50 | <0.001a |
| ALP (IU/L) | 426.7 ± 252.7 | 397.6 ± 221.7 | 0.105a |
| GGT (IU/L) | 113.5 ± 141.8 | 109.5 ± 139.6 | 0.695a |
| Serum creatinine (mg/dL) | 1.10 ± 1.23 | 0.87 ± 0.52 | 0.005a |
| Serum sodium (mmol/L) | 139.2 ± 4.0 | 140.2 ± 2.5 | <0.001a |
| Diabetes mellitus, yes/no | 74 / 177 | 177 / 578 | 0.052b |
| Prothrombin time (%) | 77.4 ± 17.1 | 80.1 ± 14.2 | 0.029a |
| Platelets (×104/mm3) | 11.0 ± 5.6 | 9.8 ± 4.5 | 0.002a |
| AFP (ng/mL)† | 15240 ± 84452 | 2147 ± 15350 | 0.016a |
| DCP (mAU/mL)‡ | 6882 ± 26369 | 2403 ± 14784 | 0.012a |
Data are expressed as number or mean ± standard deviation. HCC; hepatocellular carcinoma, JIS score; Japan integrated staging score, SR; surgical resection, PAT; percutaneous ablative therapies, TAT; transcatheter arterial therapies, MTT; molecular targeting therapy, RT; radiation therapy, AST; aspartate aminotransferase, ALT; alanine aminotransferase, ALP; alkaline phosphatase, GGT; gamma glutamyl transpeptidase, AFP; alpha-fetoprotein, DCP; des-γ-carboxy prothrombin, a; unpaired t test, b; Fisher's exact test. †; missing data, n=2, ‡; missing data, n=15
The proportion of patients with poor performance status (PS) of ≥1 according to HCC stage (I [n=254], II [n=399], III [n=241] and IV [n=109]). Significant differences between HCC stage I and IV (P<0.001), II and IV (P<0.001) and III and IV (P<0.001) were observed.
The proportion of patients with poor performance status (PS) of ≥1 according to Child-Pugh classification (A [n=687], B [n=257] and C [n=59]). There were significant differences between Child-Pugh A and B (P=0.007), B and C (P<0.001) and A and C (P<0.001).
The proportion of patients with poor performance status (PS) of ≥1 according to Japan Integrated Staging (JIS) score (0 or 1 [n=546], 2 or 3 [n=364] and 4 or 5 [n=93]). There were significant differences between JIS score of 0 or 1 and JIS score of 2 or 3 (P=0.022), JIS score of 2 or 3 and JIS score of 4 or 5 (P<0.001) and JIS score of 0 or 1 and JIS score of 4 or 5 (P<0.001).
As an initial therapy for HCC, in the PS ≥1 group, SR was performed in 32 patients, PATs in 111, trancatheter arterial chemotherapy with or without embolization in 82, MTT in 2 and no specific therapy in 24, whereas in the PS 0 group, SR was performed in 145 patients, PATs in 422, trancatheter arterial chemotherapy with or without embolization in 163, MTT in two, RT in one and no specific therapy in 19 (P<0.001).
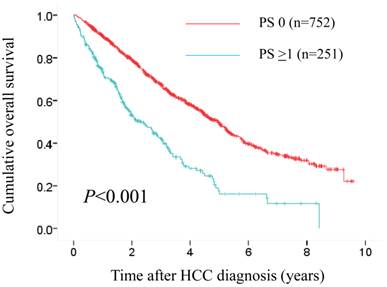
The median follow-up period was 1.6 years (range, 0.1-8.4 years) in the PS ≥1 group and 3.1 years (range, 0.1-9.6 years) in the PS 0 group. One hundred and fifty-three patients (61.0%) in the PS ≥1 group died during the follow-up period. The causes of death were HCC progression (80 patients), liver failure (46 patients) and miscellaneous (27 patients). Three hundred and fifty-seven patients (47.5%) in the control group died during the follow-up period. The causes of death were HCC progression (190 patients), liver failure (136 patients) and miscellaneous (31 patients). The 1-, 3- and 5-year OS rates after each initial therapy for HCC were 90.3%, 67.4% and 49.8%, respectively, in the PS 0 group and 73.4%, 42.0% and 17.7%, respectively, in the PS ≥1 group (P<0.001). (Fig. 4)
Cumulative overall survival (OS) rates in patients with PS ≥1 (n=251) and PS 0 (n=752). The 1-, 3- and 5-year OS rates after each initial therapy for HCC were 90.3%, 67.4% and 49.8%, respectively, in the PS 0 group and 73.4%, 42.0% and 17.7%, respectively, in the PS ≥1 group (P<0.001).
Univariate and multivariate analysis of factors contributing to OS
Using univariate analyses of factors contributing to OS, HCC stage (P<0.001), tumor number (P<0.001), maximum tumor size ≥2.5 cm (P<0.001), Child-Pugh classification (P<0.001), PS (P<0.001), AST ≥57 IU/L (P<0.001), alkaline phosphatase (ALP) ≥346 IU/L (P<0.001), gamma glutamyl transpeptidase (GGT) ≥64 IU/L (P<0.001), serum sodium >140 mmol/L (P<0.001), serum creatinine ≥0.8 mg/dL (P=0.036), AFP ≥30 ng/mL (P<0.001) and DCP ≥54 mAU/mL (P<0.001) were found to be significant factors (Table II). The multivariate analyses involving eleven factors with P<0.01 in the univariate analysis showed that tumor number (P=0.020), Child-Pugh classification (P<0.001), HCC stage (P<0.001), PS (P<0.001), AST ≥57 IU/L (P<0.001), ALP ≥346 IU/L (P<0.001), and DCP ≥54 mAU/mL (P<0.001) were significant independent predictors linked to OS. The hazard ratios (HRs), 95% confidence interval and P value for these factors are detailed in Table II.
Univariate and multivariate analyses of factors contributing to overall survival.
| Variables | n | Univariate Analysis | Multivariate Analysis | |
|---|---|---|---|---|
| Hazard Ratio (95% CI) | P valuea | |||
| Gender, male vs. female | 615 / 388 | 0.371 | ||
| Age (years), ≥70 vs. <70 | 538 / 465 | 0.402 | ||
| Tumor number, single vs. multiple | 545 / 458 | <0.001 | 1.458 (1.063-2.000) | 0.020 |
| Maximum tumor size (cm), ≥2.5 vs. <2.5 | 502 / 501 | <0.001 | 1.057 (0.792-1.412) | 0.706 |
| Child-Pugh, A / B / C | 687 / 257 / 59 | <0.001 | ||
| Child-Pugh A | Reference | |||
| Child-Pugh B | 2.049 (1.441-2.915) | <0.001 | ||
| Child-Pugh C | 3.597 (2.381-5.435) | <0.001 | ||
| HCC stage, I / II / III / IV | 254 / 399 / 241 / 109 | <0.001 | ||
| HCC stage I | Reference | |||
| HCC stage II | 3.817 (2.857-5.102) | <0.001 | ||
| HCC stage III | 4.525 (3.096-6.623) | <0.001 | ||
| HCC stage IV | 5.025 (2.857-8.850) | <0.001 | ||
| Performance status, 0 vs. ≥1 | 752 / 251 | <0.001 | 1.773 (1.429-2.198) | <0.001 |
| Cause of liver disease, B / C / B and C / NBNC | 96 / 701 / 14 / 192 | 0.218 | ||
| AST (IU/l), ≥57 vs. <57 | 500 / 503 | <0.001 | 1.479 (1.214-1.802) | <0.001 |
| ALT (IU/l), ≥44 vs. <44 | 493 / 510 | 0.101 | ||
| ALP (IU/l), ≥346 vs. <346 | 501 / 502 | <0.001 | 1.406 (1.161-1.704) | <0.001 |
| GGT (IU/l), ≥64 vs. <64 | 503 / 500 | <0.001 | 0.904 (0.744-1.097) | 0.306 |
| Serum sodium (mmol/l), >140 vs. ≤140 | 458 / 545 | <0.001 | 0.947 (0.787-1.140) | 0.564 |
| Platelet count (×104 / mm3), ≥9.2 vs. <9.2 | 507 / 496 | 0.399 | ||
| Diabetes mellitus, yes vs. no | 248 / 755 | 0.193 | ||
| Serum creatinine (mg/dl), ≥0.8 vs. <0.8 | 539 / 464 | 0.036 | ||
| AFP (ng/ml), ≥30 vs. <30† | 498 / 503 | <0.001 | 1.029 (0.849-1.246) | 0.772 |
| DCP (mAU/ml), ≥54 vs. <54‡ | 493 / 495 | <0.001 | 2.114 (1.724-2.591) | <0.001 |
CI; confidence interval, HCC; hepatocellular carcinoma, NBNC; non B and non C, AST; aspartate aminotransferase, ALT; alanine aminotransferase, ALP; alkaline phosphatase, GGT; gamma glutamyl transpeptidase, AFP, alpha-fetoprotein; DCP, des-γ-carboxy prothrombin, a; Cox proportional hazard model, †; missing data, n=2, ‡; missing data, n=15
Propensity score matching analyses in three subgroups stratified by JIS score
Baseline demographic characteristics of patients after propensity score matching in each subgroup (groups of JIS 0 or 1 [74 pairs], JIS 2 or 3 [41 pairs] and JIS 4 or 5 [29 pairs]) are shown in Table III. In terms of baseline characteristics, no significant difference was observed between patients with PS ≥1 and PS 0 in each subgroup.
Baseline characteristics between the performance status (PS) ≥1 group and the PS 0 group in each subgroup stratified by Japan Integrated Staging (JIS) scoring system after propensity score matching.
| Variables | JIS 0 or 1 (n=148, 74 pairs) | JIS 2 or 3 (n=82, 41 pairs) | JIS 4 or 5 (n=58, 29 pairs) | ||||||
|---|---|---|---|---|---|---|---|---|---|
| PS ≥1 | PS 0 | P value | PS ≥1 | PS 0 | P value | PS ≥1 | PS 0 | P value | |
| Age (years) | 73.8 ± 6.5 | 74.0 ± 6.2 | 0.867a | 71.6 ± 7.0 | 70.7 ± 7.9 | 0.615a | 69.4 ± 9.9 | 65.7 ± 7.8 | 0.118a |
| Gender, male / female | 55 / 19 | 52 / 22 | 0.714b | 20 / 21 | 19 / 22 | >0.999b | 23 / 6 | 21 / 8 | 0.760b |
| Causes of liver disease | |||||||||
| B / C / non B and non C / B and C | 2 / 59 / 12 / 1 | 3 / 58 / 12 / 1 | >0.999b | 4 / 32 / 5 / 0 | 3 / 32 / 4 / 2 | 0.671b | 3 / 17 / 7 / 2 | 4 / 21 / 4 / 0 | 0.366b |
| Child-Pugh, A / B / C | 65 / 9 / 0 | 66 / 8 / 0 | >0.999b | 17 / 22 / 2 | 18 / 21 / 2 | >0.999b | 0 / 21 / 8 | 0 / 21 / 8 | >0.999b |
| HCC stage, I / II / III / IV | 32 / 42 / 0 / 0 | 32 / 42 / 0 / 0 | >0.999b | 1 / 12 / 25 / 3 | 1 / 11 / 25 / 4 | >0.999b | 0 / 0 / 7 / 22 | 0 / 0 / 7 / 22 | >0.999b |
| Maximum tumor size (cm) | 2.2 ± 0.9 | 2.3 ± 1.0 | 0.630a | 3.6 ± 2.2 | 3.8 ± 2.3 | 0.614a | 6.2 ± 3.5 | 6.9 ± 3.2 | 0.409b |
| Tumor number, single / multiple | 65 / 9 | 70 / 4 | 0.245b | 12 / 29 | 8 / 33 | 0.441b | 4 / 25 | 3 / 26 | >0.999b |
| AST (IU/L) | 51.9 ± 28.7 | 57.3 ± 33.7 | 0.294a | 62.4 ± 28.6 | 70.3 ± 49.7 | 0.380a | 110.7 ± 91.9 | 141.0 ± 137.6 | 0.330a |
| ALT (IU/L) | 40.1 ± 24.7 | 48.7 ± 37.0 | 0.102a | 47.8 ± 29.8 | 57.4 ± 59.9 | 0.362a | 57.3 ± 41.3 | 82.2 ± 89.9 | 0.183a |
| ALP (IU/L) | 325.6 ± 131.9 | 336.4 ± 122.7 | 0.607a | 421.5 ± 259.9 | 394.6 ± 175.5 | 0.584a | 577.9 ± 321.5 | 524.5 ± 283.2 | 0.505a |
| GGT (IU/L) | 68.4 ± 67.7 | 66.1 ± 88.4 | 0.862a | 97.3 ± 110.6 | 88.0 ± 95.9 | 0.688a | 203.2 ± 164.5 | 157.2 ± 152.5 | 0.275a |
| Platelets (×104/mm3) | 10.2 ± 4.5 | 9.9 ± 4.1 | 0.644a | 10.5 ± 4.6 | 10.3 ± 6.7 | 0.892a | 14.0 ± 9.4 | 10.0 ± 4.6 | 0.090a |
| AFP (ng/mL) | 171.3 ± 424.5 | 508.8 ± 1581.3 | 0.080a | 2203.9 ± 9771.3 | 1920.7 ± 5473.1 | 0.872a | 47179 ± 164649 | 4366.8 ± 8142.3 | 0.173a |
| DCP (mAU/mL) | 490.7 ± 2214.4 | 411.3 ± 1710.5 | 0.808a | 2453.3 ± 7323.3 | 4190.6 ± 9477.2 | 0.356a | 21669 ± 40251 | 13832 ± 27880 | 0.399a |
HCC; hepatocellular carcinoma, AST; aspartate aminotransferase, ALT; alanine aminotransferase, ALP; alkaline phosphatase, GGT; gamma glutamyl transpeptidase, AFP; alpha-fetoprotein, DCP; des-γ-carboxy prothrombin, a; unpaired t test, b; Fisher's exact test.
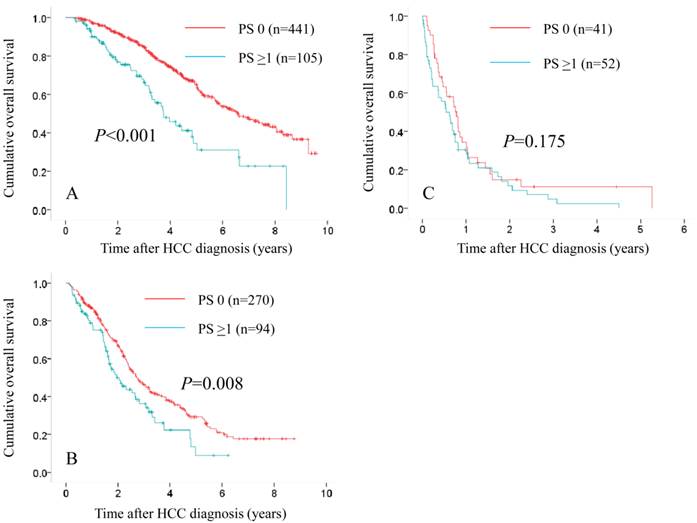
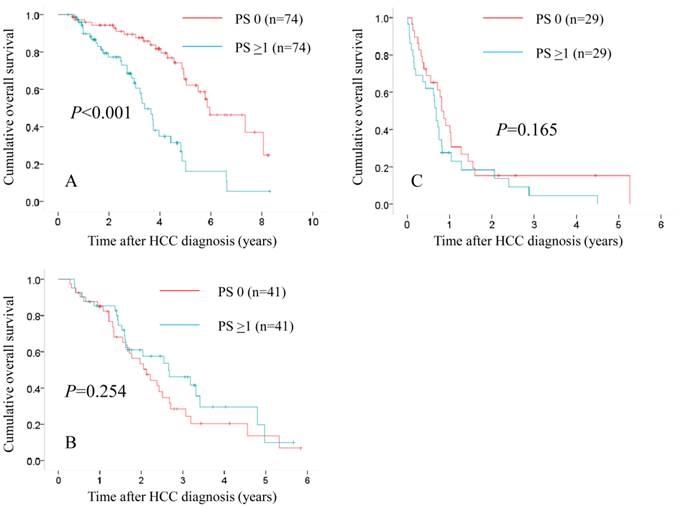
In patients with JIS 0 or 1, in terms of OS, the difference reached significance before (P<0.001) and after (P<0.001) propensity score matching. (Fig. 5A and 6A) In patients with JIS 2 or 3, in terms of OS, significant difference was found in terms of OS before propensity score matching (P=0.008), whereas after propensity score matching, such significance was diminished (P=0.254). (Fig. 5B and 6B) On the other hand, in patients with JIS 4 or 5, in terms of OS, the difference did not reach significance before (P=0.175) and after (P=0.165) propensity score matching. (Fig. 5C and 6C)
Subgroups analyses in terms of overall survival stratified by JIS score ([A]: 0 or 1 [n=441 in the PS 0 group and n=105 in the PS ≥1 group, P<0.001], [B]: 2 or 3 [n=270 in the PS 0 group and n=94 in the PS ≥1 group, P=0.008] and [C]: 4 or 5 [n=41 in the PS 0 group and n=52 in the PS ≥1 group, P=0.175]).
Subgroups analyses in terms of overall survival stratified by JIS score after propensity score matching ([A]: 0 or 1 [n=74 in the PS 0 group and n=74 in the PS ≥1 group, P<0.001], [B]: 2 or 3 [n=41 in the PS 0 group and n=41 in the PS ≥1 group, P=0.254] and [C]: 4 or 5 [n=29 in the PS 0 group and n=29 in the PS ≥1 group, P=0.165]).
Comparison of OS in the two groups according to treatment modality
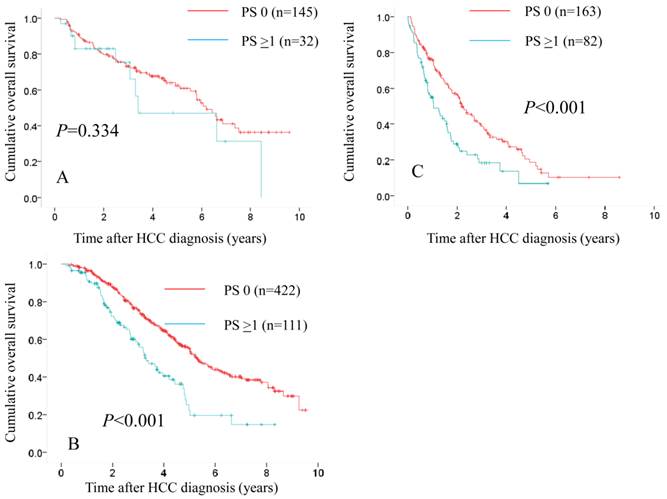
We also performed subgroup analyses according to treatment modality. In patients treated with SR (n=145 in PS 0 and n=32 in PS ≥1), the difference in the two groups did not reach significance (P=0.334) (Fig. 7A), whereas in patients treated with PATs (n=422 in PS 0 and n=111 in PS ≥1) and those treated with trancatheter arterial therapies (n=163 in PS 0 and n=82 in PS ≥1), there were significant differences in the two groups (P<0.001 for both). (Fig. 7B and 7C)
Comparison of overall survival in the two groups according to treatment modality. In patients treated with SR (n=145 in PS 0 and n=32 in PS ≥1), the difference in the two groups did not reach significance (P=0.334). (A) While in patients treated with percutaneous ablative therapies (n=422 in PS 0 and n=111 in PS ≥1) and those treated with trancatheter arterial therapies (n=163 in PS 0 and n=82 in PS ≥1), there were significant differences in the two groups (P<0.001 for both). (B and C)
Comparison of OS in patients with PS 0, PS 1 and PS ≥2
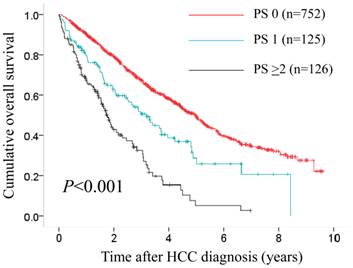
In patients with PS ≥1 (n=251), we divided them into two groups of patients with PS 1 (n=125) and those with PS ≥2 (n=126). In the two groups, a worse PS was significantly associated with Child-Pugh classification (P=0.015), hypoalbuminemia (P=0.001), hyponatremia (P=0.022) (data not shown). In terms of OS, the difference in the three groups of PS 0, PS 1 and PS ≥2 reached significance (P<0.001). (Fig. 8)
In terms of overall survival, the difference in the three groups of PS 0 (n=752), PS 1 (n=125) and PS ≥2 (n=126) reached significance (P<0.001).
Discussion
Previous studies have shown that the PS scale is a major survival determinant in patients with HCC. [6, 12, 17, 18] In fact, in our multivariate analyses, PS ≥1was demonstrated to be independent predictor linked to OS with a HR of 1.773 (P<0.001). Furthermore, in our three groups of PS 0, PS 1 and PS ≥2, significant difference was observed in terms of OS. However, there have been few studies focusing on PS in HCC patients complicating with LC. [11-14] The proportion of elderly patients with HCC who have potentially poorer PS are increasing in Japan. [2] Thus, it seems to be of importance to investigate clinical characteristics and outcomes in HCC patients in terms of PS and there is urgent need for clarifying these issues. Hence, we conducted current analyses. Since survival impact between patients with PS ≥1 and PS 0 could be confounded by significantly different baseline characteristics as shown in our results, we further analysed using propensity score matching method to reduce these selection biases.
In our analyses, subjects with PS ≥1 had significantly higher Child-Pugh score, higher total bilirubin level and lower serum albumin level as compared with those with PS 0. Furthermore, we found that patients with deteriorated PS had lower serum sodium level and higher creatinine level. These two findings are likely the result of portal hypertension and peripheral vasodilatation in patients with advanced LC. [22] These findings highlight that PS may comprehensively reflect a variety of complications of LC in patients with HCC. On the other hand, subjects with poorer PS had larger tumor burden or more advanced HCC stage in this study. Cachexia resulted from worsened portal hypertension with ascites and larger tumor status with extrahepatic metastases could all or in part contribute to a poorer PS. [23]
In our three subgroups stratified by JIS score after propensity score matching, significant differences between patients with PS ≥1 and PS 0 were observed only in patients with JIS 0 or 1 in terms of OS. Patients with JIS score of 2 or more may have poor functional poor reserve or advanced tumor status, which is considered to mainly effect on survival for these populations irrespective of PS scale. While, in patients with well-preserved liver function and/or early stage HCC such as in patients with JIS score of 0 or 1, PS could be an important predictor for their survival.
The optimal therapy for HCC with PS ≥1 remains highly debatable. According to the current EASL guidelines, HCC patients with PS ≥1 are classified as BCLC stage C or D and are not candidates for SR. [5] However, in this study, 32 out of 251 patients with PS ≥1 (12.7%) were treated with SR. The difference of treatment algorithm for HCC between European countries and Asian countries may be attributed to these results. [5, 17, 18] A recent report from Asia demonstrated that in their propensity score model, HCC patients with PS 1 or 2 undergoing aggressive HCC therapies such as SR (n=166) had significantly better long-term survival as compared with those receiving targeted therapy or chemotherapy or best supportive care (n=166) (P<0.0001). [14] In addition, in our subjects treated with SR, patients with PS ≥1 had comparable prognosis as compared with those with PS 0 (P=0.334). Further prospective studies will be needed to confirm these results.
Our study included several limitations. Firstly, inter-observer bias for assessing PS could exist although the PS scale was determined at the time of HCC diagnosis. Secondly, HCC patients with PS ≥1 were highly heterogenous and comprised HCC patients from mildly symptomatic to completely bedridden status. Thirdly, there are several missing values in this study. However, the number of subjects with missing values was very small considering large sample of our study, which may not effect on interpretation of our results. Lastly, it should be noted that the sample size in three subgroups of JIS score after propensity score matching was small for analyses. Hence, caution should be exercised for interpretation of our results. However, our study results imply that PS has a differential prognostic impact and well correlated with baseline profiles in HCC patients complicating with LC.
In conclusion, PS was closely associated with status of HCC patients with LC and could be an important predictor for these populations.
Abbreviations
HCC: hepatocellular carcinoma, SR: surgical resection, PATs: percutaneous ablative therapies, MTT: molecular targeted therapy, RT: radiation therapy, PS: performance status, ECOG: the Eastern Cooperative Oncology Group, BCLC: Barcelona Clinic Liver Cancer, LC: liver cirrhosis, CT: computed tomography, OS: overall survival, AFP: aplpha-fetoprotein, DCP: des-γ-carboxy prothrombin, JIS: Japan Integrated Staging, AST: aspartate aminotransferase, ALT: alanine aminotransferase, ALP: alkaline phosphatase, GGT: gamma glutamyl transpeptidase, 95% CI:95% confidence interval, HR: hazard ratio.
Acknowledgements
We would like to thank Haruko Takada for the data collection.
Competing interests
The authors declare that they have no conflicts of interest. In addition, none of the authors had any financial relationship (within the past 12 months) with biotechnology manufacturers, pharmaceutical companies, or other commercial entities that have any interest in the subject matter, materials, or processes discussed in the manuscript.
References
1. El-Serag HB. Epidemiology of viral hepatitis and hepatocellular carcinoma. Gastroenterology. 2012;142:1264-1273
2. Nishikawa H, Osaki Y. Non-B, non-C hepatocellular carcinoma (Review). Int J Oncol. 2013;43:1333-1342
3. Bruix J, Gores GJ, Mazzaferro V. Hepatocellular carcinoma: clinical frontiers and perspectives. Gut. 2014;63(5):844-855
4. El-Serag HB. Hepatocellular carcinoma. N Engl J Med. 2011;365:1118-1127
5. de Lope CR, Tremosini S, Forner A, Reig M, Bruix J. Management of HCC. J Hepatol. 2012;56(Suppl 1):S75-87
6. Oken MM, Creech RH, Tormey DC, Horton J, Davis TE, McFadden ET. et al. Toxicity and response criteria of the Eastern Cooperative Oncology Group. Am J Clin Oncol. 1982;5:649-655
7. Bruix J, Sherman M; Practice Guidelines Committee, American Association for the Study of Liver Diseases. Management of hepatocellular carcinoma. Hepatology. 2005;42:1208-1236
8. Bruix J, Sherman M; American Association for the Study of Liver Diseases. Management of hepatocellular carcinoma: an update. Hepatology. 2011;53(3):1020-1022
9. Montano-Loza AJ. Clinical relevance of sarcopenia in patients with cirrhosis. World J Gastroenterol. 2014;20(25):8061-8071
10. Iwasa M, Hara N, Terasaka E, Hattori A, Ishidome M, Mifuji-Moroka R. et al. Evaluation and prognosis of sarcopenia using impedance analysis in patients with liver cirrhosis. Hepatol Res. 2014;44(10):E316-E317
11. Hsu CY, Lee YH, Hsia CY, Huang YH, Su CW, Lin HC. et al. Performance status in patients with hepatocellular carcinoma: determinants, prognostic impact, and ability to improve the Barcelona Clinic Liver Cancer system. Hepatology. 2013;57(1):112-119
12. Liu PH, Lee YH, Hsia CY, Hsu CY, Huang YH, Chiou YY. et al. Surgical resection versus transarterial chemoembolization for hepatocellular carcinoma with portal vein tumor thrombosis: a propensity score analysis. Ann Surg Oncol. 2014;21(6):1825-1833
13. Liu PH, Lee YH, Hsu CY, Huang YH, Chiou YY, Lin HC. et al. Survival advantage of radiofrequency ablation over transarterial chemoembolization for patients with hepatocellular carcinoma and good performance status within the milan criteria. Ann Surg Oncol. 2014;21(12):3835-3843
14. Hsu CY, Liu PH, Lee YH, Hsia CY, Huang YH, Chiou YY. et al. Aggressive Therapeutic Strategies Improve the Survival of Hepatocellular Carcinoma Patients with Performance Status 1 or 2: A Propensity Score Analysis. Ann Surg Oncol. 2014 [Epub ahead of print]
15. Yamasaki T, Kurokawa F, Shirahashi H, Kusano N, Hironaka K, Okita K. Percutaneous radiofrequency ablation therapy with combined angiography and computed tomography assistance for patients with hepatocellular carcinoma. Cancer. 2001;91:1342-1348
16. Liver Cancer Study Group of Japan. Jpn J Surg. 1989;19(1):98-129
17. Park JW, Amarapurkar D, Chao Y, Chen PJ, Geschwind JF, Goh KL. et al. Consensus recommendations and review by an International Expert Panel on Interventions in Hepatocellular Carcinoma (EPOIHCC). Liver Int. 2013;33:327-337
18. Kudo M, Izumi N, Kokudo N, Matsui O, Sakamoto M, Nakashima O, et al; HCC Expert Panel of Japan Society of Hepatology. Management of hepatocellular carcinoma in Japan: Consensus-Based Clinical Practice Guidelines proposed by the Japan Society of Hepatology (JSH) 2010 updated version. Dig Dis. 2011;29:339-364
19. Austin PC. A comparison of 12 algorithms for matching on the propensity score. Stat Med. 2014;33:1057-1069
20. D'Agostino RB Jr. Propensity score methods for bias reduction in the comparison of a treatment to a non-randomized control group. Stat Med. 1998;17:2265-2281
21. Kudo M, Chung H, Osaki Y. Prognostic staging system for hepatocellular carcinoma (CLIP score): its value and limitations, and a proposal for a new staging system, the Japan Integrated Staging Score (JIS score). J Gastroenterol. 2003;38(3):207-215
22. Biggins SW, Kim WR, Terrault NA, Saab S, Balan V, Schiano T. et al. Evidence-based incorporation of serum sodium concentration into MELD. Gastroenterology. 2006;130:1652-1660
23. Huo TI, Hsu CY, Huang YH, Su CW, Lin HC, Lee RC. et al. Prognostic prediction across a gradient of total tumor volume in patients with hepatocellular carcinoma undergoing locoregional therapy. BMC Gastroenterol. 2010;10:146
Author contact
![]() Corresponding author: Hiroki Nishikawa, M.D. Department of Gastroenterology and Hepatology, Osaka Red Cross Hospital, 5-30 Fudegasaki-cho, Tennoji-ku, Osaka 543-0027, Japan. Tel: +81-6-6774-5111; Fax: +81-6-6774-5131; E-mail: h-nishikawajrc.or.jp
Corresponding author: Hiroki Nishikawa, M.D. Department of Gastroenterology and Hepatology, Osaka Red Cross Hospital, 5-30 Fudegasaki-cho, Tennoji-ku, Osaka 543-0027, Japan. Tel: +81-6-6774-5111; Fax: +81-6-6774-5131; E-mail: h-nishikawajrc.or.jp