Impact Factor ISSN: 1837-9664

 Global reach, higher impact
J Cancer 2015; 6(3):247-253. doi:10.7150/jca.10747 This issue Cite
Research Paper
Non-invasive Analysis of Genomic Copy Number Variation in Patients with Hepatocellular Carcinoma by Next Generation DNA Sequencing
Hongtao Xu1, Xia Zhu2, Zulong Xu3, Yue Hu2, Shiping Bo2, Tongjing Xing1 ![]() , Kuichun Zhu2
, Kuichun Zhu2 ![]()
1. Department of Infectious Diseases, Taizhou People's Hospital, Taizhou, Jiangsu, China.
2. Yikon Genomics Inc. Taizhou, Jiangsu, China.
3. Department of Laboratory Medicine, Taizhou People's Hospital, Taizhou, Jiangsu, China.
Received 2014-10-7; Accepted 2014-12-9; Published 2015-1-18
Abstract
To explore new molecular diagnosis approaches for early detection and differential diagnosis of hepatocellular carcinoma (HCC), we analyzed genomic copy number variations (CNV) using plasma cell-free DNA from patients with HCC by next generation DNA sequencing. Plasma samples from 31 patients with HCC and 8 patients with chronic hepatitis or cirrhosis were analyzed. In HCC group, most samples with large tumor size (tumor dimension greater than 50 mm) showed CNVs that are visually recognizable at chromosome CNV plots, few samples with small tumor and none samples with chronic liver diseases showed CNVs recognizable at CNV plots. CNV Z score analysis showed significant CNVs in samples with HCC and chronic liver diseases although more significant changes were found in HCC group, some are differentially valuable (such as gain in 1q, 7q, and 19q in HCC), while others are less differentially valuable (such as loss in 4q, 13q, gain in 17q, 22q). We proposed a CNV scoring method that generated positive result in 26 of the 31 HCC patients (83.9%) or 11 of the 16 HCC with tumor dimension 50 mm or less (68.8%) or 4 of the 7 HCC with tumor dimension 30 mm or less (57.1%), while all the 8 samples with chronic hepatitis or cirrhosis scored negative. Ten HCC patients had normal or low serum AFP levels, among them, 7 were scored positive by CNV analysis, including 4 with tumor dimension 50 mm or less. Our study suggested that non-invasive genomic CNV analysis using plasma samples could be a valuable tool for early detection and differential diagnosis of HCC. Although CNV analysis itself cannot establish the diagnosis, it can help identify patients at high risk for HCC among patients with chronic liver diseases, which would prompt closer and more frequent surveillance for early tumor detection and intervention.
Keywords: Genomic Copy Number Variation, HCC, DNA sequencing
Introduction
According to WHO GLOBOCAN 2012 statistics, liver cancer is the fifth most common cancer type in men, and the second most common cause of death from cancer worldwide. Hepatocellular carcinoma (HCC) develops often with underlying chronic liver diseases such as chronic hepatitis (CH) or cirrhosis (CR). Most patients were diagnosed at late stages, having a survival time often less than 6 months after initial diagnosis. However, the 5-year survival rate for patients with early HCC after resection ranged from 27% to 81% [1]. Early detection and differential diagnosis is the key to the success of tumor resection and good prognosis. Current HCC screening methods include mainly serum AFP test, computed tomography scan and ultrasonography examination.
In the past several years, DNA sequencing technology has evolved dramatically. Next generation DNA sequencing (NGS) has brought genome sequencing to clinical laboratories. The huge reduction in the sequencing cost and increase in sequencing efficiency, the incomparable sequencing throughput, sensitivity, and accuracy all make NGS the most promising laboratory technology for cancer genomics, cancer genetics, early diagnosis and personalized treatment of cancer patients in next decade [2-4]. Combined with the superior NGS technology, non-invasive diagnosis of cancers using plasma cell-free DNA (cfDNA) from cancer patients has proven to be feasible. The use of cfDNA circumvents biopsy or surgery, but still being able to get relatively representative and complete genomic and genetic information of cancer cells [5-9].
Cancer is a genetic disorder. Advanced cancer cells carry an array of genetic variants and genomic abnormalities, mutations, insertions, deletions, translocations, inversions, amplification are some of the most common genetic and genomic changes in cancer cells. Deletion and amplification can be identified by copy number variation (CNV) analysis. Different kinds of CNVs have been reported in HCC, mostly by comparative genomic hybridization analysis with genetic materials from tumor tissues. The most common CNVs reported in HCC include gain in 1q, 8q, 17q, 20q, and loss in 4q, 13q, 14q, 16q,1p, 8p, 9p, 17p [10-13].
We aimed to screen for genomic CNVs using plasma cfDNA from HCC patients by NGS technology, and such CNVs might help for early detection or differential diagnosis of HCC in the context of underlying chronic liver diseases. After thorough analysis of the CNV data, we proposed a CNV scoring method that showed good performance in our study and with our set of clinical data.
Materials and Methods
Patients
All patients involved in the study were recruited at local hospital for diagnosis and treatment of liver diseases. Diagnosis of chronic hepatitis (CH), cirrhosis (CR), and hepatocellular carcinoma (HCC) were made following guidelines from Society of Hepatology, Chinese Medical Association, and blood samples were collected at the diagnosis of the diseases. Measurement of tumor dimension was performed by computed tomography scan. Patients with single tumor or nodule were included in the study. Serum AFP test was performed with chemiluminescence method with reference value less than 10 ng/ml, HBV DNA copy number was measured with fluorescence qPCR method, both were performed using commercial kits approved for use in clinical laboratories by the Ministry of Health. Blood samples were drawn into tubes with EDTA as anti-coagulant. Plasma was prepared by centrifuging blood samples at 2000 g for 5 mins, stored in aliquots at -80 °C, and sent for test within 3 months.
The use of human blood samples for clinical research was performed following Institutional Review Board requirements and with written informed consent from patients. The study was approved by the Ethical and Scientific Committees of Taizhou People's Hospital.
Cell-free DNA isolation
Cell-free DNA (cfDNA) was extracted from plasma using BloodGen mini kit (CoWin Inc, Beijing, China) following manufacturer's protocol.
Library construction, sequencing, and general data processing
Sequencing library construction, QC, NGS sequencing, general data processing were performed as described previously [14]. For CNV analysis, Illumina flowcells (single read length 40 bp) were used for sequencing, with 10-15 M reads each sample and targeted sequencing depth at 0.1-0.2 x.
CNV analysis
Mapped reads were normalized to relative reads number at 1000/150kb per bin after GC correction. Relative reads number in each bin was compared with that in the control group to calculate CNV. CNV Z score analysis with Z-test was performed as described previously [9]. CNV control consists of data from 259 healthy subjects. CNV analysis was performed using a set of proprietary Perl scripts, CNV visualization was processed with a proprietary R script. In this study, 150 kb per bin data were used for chromosome CNV plots, and 1 M bp per bin data were used for CNV Z score analysis, and only data from autosomes were included in CNV Z score analysis.
Major CNVs identified were verified by fluorescence qPCR. One representative HCC sample and one CR1 sample were chosen for the purpose of verification. qPCR target regions were chosen based on the CNV Z score analysis results, one bin for each chromosome arm was chosen as amplification target region, and two sets of qPCR primers were designed from two different regions in the bin chosen. The two housekeeping genes (β-actin and β-tubulin) were used as internal controls for the qPCR. The qPCR was performed using UltraSYBR qPCR Mix (CoWin Inc, Beijing, China), 4 ng cfDNA template per reaction, and Roche LightCycle 480 System. The Ct values of housekeeping genes were used to normalize input DNA between samples. Ct values of target regions in each sample were compared with Ct values of housekeeping genes of the same sample for estimation of CNVs. Primer sequences were shown in Table A.
Primer sequences used in qPCR analysis.
| Primer name | Primer sequence |
|---|---|
| 1qaF | CAGATTTGGATGCGCTTTTT |
| 1qbF | GAAGCCTCACAATCACAGCA |
| 7qaF | AAGTGACGATTTTGGCCCAC |
| 7qbF | TATCTCCGGGCCACAACTTT |
| 19qaF | GGGAAGGAACAGCAGCTCTA |
| 19qbF | TTGCAACACTACACACCAGC |
| 1qaR | CTGGAACGCTACGAGGATGT |
| 1qbR | AACCCCTTCCACTTGGTTCT |
| 7qaR | AAGCCAAGGATTCGTACCCA |
| 7qbR | ACGAGAATTGCTTGAACCCG |
| 19qaR | TGGGAGCCATTGAAGCATTT |
| 19qbR | TGTGCAGCATAGTGAGACCA |
| actinF | TACACCCCCACTCAAGGGA |
| actinR | CTCCCCAGGTACCCCAGTTT |
| tubulinF | CACCAAGGAAGTGGACCAGCAAC |
| tubulinR | ATGTCCATCCCTTCGCTGGTGTA |
Results
Patients and plasma cfDNA
Thirty one patients with HCC were included in the study. Patient information was summarized in Table 1. Seven patients had tumor size no more than 30 mm, 16 patients had tumor size no more than 50 mm. Serum AFP level was elevated to different extents in 26 patients. All but two had HBV infection.
Summary of clinical information of HCC patients
| patient ID | age | gender | tumor size (length, mm) | tumor size (width, mm) | Serum AFPa | Serum HBV DNAb |
|---|---|---|---|---|---|---|
| HCC1 | 56 | F | 19 | 18 | M | L |
| HCC2 | 65 | F | 22 | 17 | L | L |
| HCC3 | 27 | M | 41 | 28 | H | L |
| HCC4 | 62 | M | 31 | 27 | L | H |
| HCC5 | 59 | M | 30 | 30 | N | L |
| HCC6 | 55 | M | 19 | 17 | M | L |
| HCC7 | 57 | M | 35 | 29 | N | L |
| HCC8 | 55 | M | 37 | 32 | H | L |
| HCC9 | 53 | M | 35 | 26 | N | N |
| HCC10 | 43 | M | 20 | 18 | N | H |
| HCC11 | 65 | M | 48 | 40 | H | N |
| HCC12 | 54 | M | 16 | 14 | N | L |
| HCC13 | 49 | F | 36 | 30 | H | M |
| HCC14 | 29 | M | 45 | 28 | H | L |
| HCC15 | 64 | F | 35 | 33 | H | H |
| HCC16 | 32 | M | 65 | 58 | H | L |
| HCC17 | 49 | M | 88 | 60 | M | M |
| HCC19 | 49 | M | 88 | 52 | H | M |
| HCC20 | 76 | M | 75 | 58 | M | L |
| HCC21 | 71 | M | 96 | 89 | H | H |
| HCC23 | 60 | M | 99 | 83 | H | L |
| HCC24 | 46 | M | 93 | 70 | H | L |
| HCC26 | 47 | M | 60 | 50 | L | H |
| HCC27 | 56 | M | 56 | 54 | N | L |
| HCC28 | 44 | M | 78 | 49 | H | L |
| HCC29 | 80 | F | 65 | 36 | H | L |
| HCC30 | 40 | M | 119 | 106 | H | M |
| HCC29a | 57 | M | 90 | 81 | N | M |
| HCC29b | 53 | M | 95 | 60 | H | L |
| HCC29c | 73 | F | 114 | 86 | H | H |
| HCC5a | 59 | M | 28 | 21 | H | H |
a: unit: ng/ml serum. N:<10; L: 10-50; M: 51-500; H: >500.
b: unit: copies/ml serum. N: undetectable; L: <500; M: 500-10000; H: >10000.
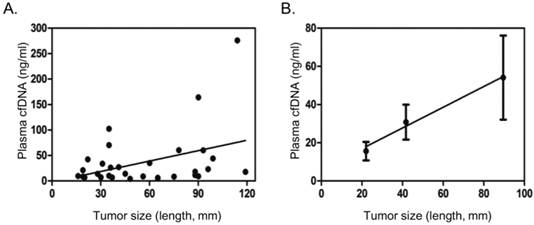
cfDNA was successfully extracted using a commercial kit from all the 31 cancer plasma samples. Plasma cfDNA from most cancer patients was found in the range of 5 - 50 ng/ml, with a few patients with large tumor size having plasma cfDNA over 100 ng/ml (Table 2). Blood samples with hemolysis were excluded. The plasma cfDNA concentration showed poor correlation with tumor size in general (Fig. 1A). If patients were divided into three groups, with tumor size 30 mm or less, 31-60 mm, greater than 60 mm, it was found that plasma cfDNA concentration steadily increased with the increase of tumor size (Fig.1B).
CNV analysis of cfDNA samples from patients with HCC
| patient ID | cfDNA (ng/ml) | AFP | CNV plot change | 1q+ | 7q+ | 19q+ | 1p- | 9q- | 14q- | CNV scorea |
|---|---|---|---|---|---|---|---|---|---|---|
| HCC1 | 8.36 | M | - | - | - | - | - | + | - | 0.5 |
| HCC2 | 42.39 | L | - | - | + | - | - | + | + | 3 |
| HCC3 | 27.10 | H | - | - | - | + | - | - | - | 2 |
| HCC4 | 33.83 | L | - | + | - | - | - | - | + | 2.5 |
| HCC5 | 7.03 | N | - | - | - | - | - | - | + | 0.5 |
| HCC6 | 21.00 | M | - | - | - | + | + | + | - | 3 |
| HCC7 | 70.32 | N | - | - | - | - | - | + | - | 0.5 |
| HCC8 | 6.93 | H | - | - | - | - | + | + | - | 1 |
| HCC9 | 10.23 | N | - | - | + | - | - | + | - | 2.5 |
| HCC10 | 6.98 | N | - | - | - | - | - | + | - | 0.5 |
| HCC11 | 4.15 | H | - | - | + | - | - | + | - | 2.5 |
| HCC12 | 9.63 | N | + | - | - | + | - | + | - | 5.0 |
| HCC13 | 26.08 | H | + | + | + | - | + | - | - | 8.5 |
| HCC14 | 14.09 | H | + | - | - | - | + | + | - | 6.5 |
| HCC15 | 102.38 | H | + | + | + | + | + | + | + | 11.5 |
| HCC16 | 6.00 | H | - | + | - | - | + | - | - | 2.5 |
| HCC17 | 18.08 | M | - | - | - | - | + | + | + | 1.5 |
| HCC19 | 11.46 | H | - | + | - | + | - | - | + | 4.5 |
| HCC20 | 8.44 | M | - | + | - | - | + | - | - | 2.5 |
| HCC21 | 23.10 | H | + | + | - | - | - | - | - | 6 |
| HCC23 | 44.12 | H | + | + | + | + | + | + | + | 11.5 |
| HCC24 | 60.03 | H | - | - | - | - | + | + | + | 1.5 |
| HCC26 | 35.00 | L | + | + | + | + | + | + | + | 11.5 |
| HCC27 | 8.88 | N | + | + | + | - | + | + | + | 9.5 |
| HCC28 | 60.25 | H | + | + | - | - | - | - | + | 6.5 |
| HCC29 | 5.13 | H | + | + | - | + | + | + | + | 9.5 |
| HCC30 | 17.75 | H | - | + | - | + | - | + | + | 5 |
| HCC29a | 164.00 | N | + | + | + | + | + | + | - | 11 |
| HCC29b | 9.03 | H | + | + | + | + | + | + | - | 11 |
| HCC29c | 275.82 | H | + | + | + | + | + | + | + | 11.5 |
| HCC5a | 13.88 | H | - | + | - | + | - | - | - | 4 |
a: Underlined numbers indicate samples with normal or low serum AFP levels.
Correlation of plasma cfDNA concentration with tumor size. A. Scatter dot plot showing distribution cfDNA concentration and tumor size (length in mm). B. Average tumor size and cfDNA concentration in three different groups based on tumor size (<=30 mm, 31-60 mm, >60 mm), showing general trend of increase in plasma cfDNA concentration with tumor size. Dots and error bars represent Means and SD of each group.
Eight patients with CH or CR were also included in the study as controls. Plasma cfDNA from chronic liver diseases was found in the range of 3 - 25 ng/ml (Table 3).
Patient information and CNV analysis of cfDNA samples from patients with chronic liver diseasesa
| patient ID | age | gender | serum AFP | serum HBV DNA | plasma cfDNA | 1p- | 9q- | 14q- | CNV score |
|---|---|---|---|---|---|---|---|---|---|
| CR1 | 56 | F | M | N | 25.5 | 0 | |||
| CR2 | 34 | M | N | L | 15.75 | + | 0.5 | ||
| CR3 | 53 | F | M | H | 17.63 | + | 0.5 | ||
| CR4 | 59 | F | L | H | 3.27 | + | 0.5 | ||
| CH1 | 44 | F | L | H | 16.75 | 0 | |||
| CH2 | 52 | M | H | H | 7.05 | 0 | |||
| CH3 | 33 | M | L | H | 10.45 | + | 0.5 | ||
| CH4 | 63 | M | N | H | 7.35 | + | + | 1 |
a: see Table 1 and text for detailed description.
Chromosome CNV analysis
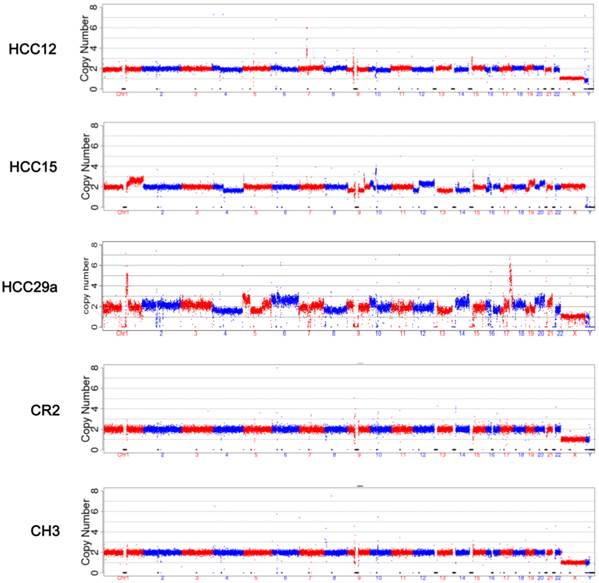
The mapped reads from NGS were processed through GC correction, normalization, and comparison with the reads in the CNV control group in each window (bin) for chromosome CNV ratio calculation. Visual CNV change was defined as visible intense segmental increase or decrease in the CNV ratio in the 150 kb per bin CNV plots. Scattered dots above or below the baseline were not counted. Read breaks due to repeat sequences (close to centromere or telomere) that appear in every sample were ignored (such as in the middle of Chr 1 and Chr 9 in Figure 2). Among 31 samples from HCC patients, 13 showed visible CNV changes, including 4 with tumor size 50 mm or less, and 1 with tumor size 30 mm or less. None of the CH or CR samples showed CNV changes that can be recognized at 150 kb per bin CNV plots (Figure 2). Common CNVs observed include gain in 1q, 7q, 17q, 19q, 20q, and loss in 1p, 4q, 13q, 17p. Additional visual CNV change was summarized in Supplementary Material: Figure S1.
CNV analysis. CNV analysis was performed as described in Materials and Methods. The plots were based on data with bin size at 150 kb. The five samples represent 5 different groups respectively: HCC with tumor <= 30 mm, HCC with tumor 31-50 mm, HCC with tumor >50 mm, cirrhosis, and chronic hepatitis.
CNV Z score analysis
Although in the CNV plots some cancer samples showed chromosome CNVs, no CH or CR samples showed recognizable changes, even some samples with tumor size 50 mm or less showed CNVs, most tumor samples showed no recognizable CNV changes. To look into details in the sub-cytoband level (1 M per bin), we performed CNV Z score analysis. Many potential CNV changes with Z score outside -3 to +3 range could be observed in both HCC samples as well as CH or CR samples, although more extensive changes showed in HCC samples. At 1-M bin level, CNVs such as gain in 17q, 22q, loss in 4q, 13q were found to be common but with less value of differential diagnosis in our sample set. It is difficult to find one significant CNV change in a given cytoband of a chromosome that is common in cancer samples but negative in CH or CR samples.
To focus on more specific and significant CNV changes, we counted changes meeting following criteria as positive CNV changes for a given chromosome arm (p or q): 1. At least two 1-M bins in one chromosome arm with Z score either greater than 4.0 (gain) or less than -4.0 (loss), or 2. At least one 1-M bin in one chromosome arm with Z score either greater than 4.0 (gain) or less than -4.0 (loss) plus at least four other bins in the same arm with Z score either greater than 3.0 or less than -3.0 (same direction). With these criteria, gain in 1q, 7q, 19q were only found in HCC samples, while loss in 1p, 9q, 14q were found frequently in HCC samples, but uncommon in CH or CR samples (Table 2).
To verify CNVs identified by NGS, we used fluorescence qPCR method to amplify selected regions in 1q, 7q, 19q in two representative samples, one for HCC, one for CR. As shown in Table 4, the copy number results of the amplified regions by qPCR correlate well with CNV findings by NGS, significant gains in HCC sample with target regions having average Ct values 4-6 lower than the internal controls, but only minor changes in the CR sample.
Verification of NGS results by qPCRa
| patient ID | 1q | 7q | 19q | Internal control |
|---|---|---|---|---|
| HCC15 | 23.11 ± 0.80 | 22.32 ± 1.06 | 23.83 ± 0.64 | 28.51 ± 0.78 |
| CR1 | 30.32 ± 1.84 | 26.84 ± 1.57 | 27.84 ± 0.23 | 28.51 ± 1.03 |
a: Mean and SD of Ct values of 4 amplification reactions of two target regions in the same bin were shown.
CNV scoring and diagnosis performance
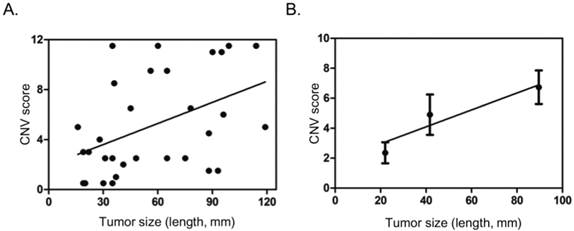
Gain in 1q, 7q, 19q, and loss in 1p, 9q, 14q meeting the criteria above seemingly carry some value in differential diagnosis. We then tried to score these sub-cytoband CNV changes: 2 points for each gain in 1q, or 7q, or 19q, 0.5 point for each loss in 1p, 9q, or 14q. After comparing scores in each sample in HCC and CH, CR groups, a threshold of 1.5 points was set for high risk for HCC (positive). In addition, a sample with any CNV that could be observed in the 150k per bin CNV plot was automatically considered as high risk for HCC, scored 4.0 points. With these scoring method, positive result (high risk for HCC) was found in 26 of the 31 HCC patients (83.9%) or 11 of the 16 HCC with tumor dimension 50 mm or less (68.8%) or 4 of the 7 HCC with tumor dimension 30 mm or less (57.1%), while all the 8 samples with CH or CR scored negative (Table 2, Table 3). Ten HCC patients had normal or low serum AFP levels, among them, 7 were scored positive by CNV analysis, including 4 with tumor dimension 50 mm or less (Table 2). The CNV scores showed poor correlation with tumor size in general (Fig. 3A). If patients were divided into three groups, with tumor size 30 mm or less, 31 - 60 mm, greater than 60 mm, it was found that CNV scores steadily increased with the increase of tumor size (Fig. 3B).
Correlation of CNV scores with tumor size. A. Scatter dot plot showing distribution of CNV scores and tumor size (length in mm). B. Average tumor size and CNV score in three different groups based on tumor size (<=30 mm, 31-60 mm, >60 mm), showing general trend of increase in CNV score with tumor size. Dots and error bars represent Means and SD of each group.
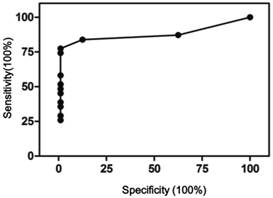
It should be noted that scoring negative does not mean no CNVs, only meaning CNVs present were not sufficient to meet the criteria set here. The CNV scores were used to perform receiver operating characteristic (ROC) curve analysis using Prism 5. As shown in Figure 4, the area under curve was 0.95, 95% confidence interval at 0.89 - 1.01. At 1.5 cutoff point, a sensitivity of 84% and specificity of 100% were achieved.
ROC curve of the CNV scoring method. Area under curve 0.95, 95% CI 0.89 - 1.01, p<0.001.
Discussions
Next generation DNA sequencing technology brought immense opportunities for molecular diagnosis in clinical settings. The use of non-invasive specimen, plasma cfDNA, as sources of genetic materials, coupled with NGS, offers a great option for cancer screening, early detection, treatment guiding, and disease monitoring. For an “acute cancer” such as HCC, often with significant underlying diseases as CH or CR, early detection and differential diagnosis are very critical. In this pilot study, we made efforts to identify potential genomic changes by CNV analysis that might shed light on early detection of HCC among patients with underlying CH or CR.
cfDNA quality is critical, could easily affect the test outcome. The main concern here is the lysis of patient non-tumor cells that would release large amount of non-tumor DNA into the plasma, diluting the tumor DNA present in the sample, thus dramatically reducing the test sensitivity. More controlled sample collecting and processing conditions include: using EDTA as anticoagulant, adding stabilizing agent to reduce cell lysis, complete removal of cells at plasma isolation, plasma isolation using fresh blood samples, discarding hemolytic samples, transferring plasma to -80°C timely, and avoiding repeated freezing and thawing etc. Samples obtained under more strictly controlled conditions could offer higher quality and more reliable test results.
Equally important is the standardization of methods used in sequencing library construction, sequencing method and platform, data processing and analysis software and programs. All these could affect the test outcome significantly. Before standardized methods can be established and applied in different clinical laboratories, there would be no widely accepted diagnosis criteria or threshold.
Our results could have significant clinical implications. Currently the diagnosis of HCC mainly consists of ultrasonic or CT scan to find tumor mass (nodules) and pathology exam to verify malignancy nature and cellular origin. Many HCC developed with significant underlying liver diseases such as CH or CR. Often it is difficult to draw a line between the underlying disease and HCC, yet early detection of HCC is very critical for the prognosis. Serum AFP is often elevated in HCC patients, but HCC patients could have normal or low level of AFP, patients with CH and CR could have elevated serum AFP, as shown in our data. Although there are studies in protein or RNA expressions, epigenetics and microRNAs in HCC [15], fundamentally intensive genomic abnormalities are characteristics of all cancers including HCC, especially at advanced stages. The method we proposed here could identify over two thirds of HCC no more than 50 mm, more than half of HCC no more than 30 mm, with no positive results from 8 CH and CR patients in our study. Of course, such a test only suggests high or low risk for HCC, itself alone could not be used for diagnosis. Considering it is a non-invasive method, it really has the potential to be explored and developed into a mature method that could be used in combination of imaging exams for early detection and differential diagnosis of HCC from underlying CH and CR. Chan et al. performed a similar study previously with CNV and methylation exams in liver cancer. They proposed to use the percentage of bins with CNV and or methylation change for HCC diagnosis [9]. In our study, we found that 7 of the 8 CH, CR patients had abnormal CNV counts over 120 per sample, while 12 of 16 HCC patients with tumor size 50 mm or less had abnormal CNV counts less than 120 per sample, including 4 with visible CNVs in CNV plots (data not shown). Therefore, we searched for CNVs that are much less common in CH or CR, but much more common in HCC, with a focus on HCC with small tumor sizes, excluding those less differential CNVs.
The study with our limited sample set showed encouraging findings. Studies with much larger samples and in different laboratories are necessary in future to verify, improve, or reshape the diagnostic application of cfDNA-NGS-CNV approach in the early detection and differential diagnosis of HCC. As stated above, scoring negative does not mean no CNVs, only meaning CNVs present were not sufficient to meet the criteria set here. The criteria for CNVs, for diagnosis threshold, the components included in the criteria, and the scoring methods could vary significantly in different laboratories and in future studies. All studies of this kind together would be able to bring mature high-tech, high throughput, highly sensitive and specific diagnostic methods to clinics that could help solve many challenging current clinical issues in patient diagnosis and treatment.
Supplementary Material
Fig.S1.
Competing Interests
The authors have declared that no competing interest exists.
References
1. Lim KC, Chow PK, Allen JC. et al. Systematic review of outcomes of liver resection for early hepatocellular carcinoma within the Milan criteria. Br J Surg. 2012;99(12):1622-1629
2. Gullapalli RR, Lyons-Weiler M, Petrosko P. et al. Clinical integration of next-generation sequencing technology. Clin Lab Med. 2012;32(4):585-599
3. Ong FS, Lin JC, Das K. et al. Translational utility of next-generation sequencing. Genomics. 2013;102(3):137-139
4. Ulahannan D, Kovac MB, Mulholland PJ. et al. Technical and implementation issues in using next-generation sequencing of cancers in clinical practice. Br J Cancer. 2013;109(4):827-835
5. Leary RJ, Sausen M, Kinde I. et al. Detection of chromosomal alterations in the circulation of cancer patients with whole-genome sequencing. Sci Transl Med. 2012;4(162):162ra154
6. Forshew T, Murtaza M, Parkinson C. et al. Noninvasive identification and monitoring of cancer mutations by targeted deep sequencing of plasma DNA. Sci Transl Med. 2012;4(136):136ra68
7. Shaw JA, Page K, Blighe K. et al. Genomic analysis of circulating cell-free DNA infers breast cancer dormancy. Genome Res. 2012;22(2):220-231
8. Murtaza M, Dawson SJ, Tsui DW. et al. Non-invasive analysis of acquired resistance to cancer therapy by sequencing of plasma DNA. Nature. 2013;497(7447):108-112
9. Chan KC, Jiang P, Chan CW. et al. Noninvasive detection of cancer-associated genome-wide hypomethylation and copy number aberrations by plasma DNA bisulfite sequencing. Proc Natl Acad Sci U S A. 2013;110(47):18761-18768
10. Guan XY, Fang Y, Sham JS. et al. Recurrent chromosome alterations in hepatocellular carcinoma detected by comparative genomic hybridization. Genes Chromosomes Cancer. 2000;29(2):110-116
11. Zondervan PE, Wink J, Alers JC. et al. Molecular cytogenetic evaluation of virus-associated and non-viral hepatocellular carcinoma: analysis of 26 carcinomas and 12 concurrent dysplasias. J Pathol. 2000;192(2):207-215
12. Wang G, Zhao Y, Liu X. et al. Allelic loss and gain, but not genomic instability, as the major somatic mutation in primary hepatocellular carcinoma. Genes Chromosome Cancer. 2001;31(3):221-227
13. Furge KA, Dykema KJ, Ho C. et al. Comparison of array-based comparative genomic hybridization with gene expression-based regional expression biases to identify genetic abnormalities in hepatocellular carcinoma. BMC Genomics. 2005;6:67
14. Zhu L, Hu Y, Wang J, Zhu X. et al. Screening for gene mutations in hypertrophic cardiomyopathy by targeted exon amplification and next generation DNA sequencing: a pilot study with three Chinese families. Exp Clin Cardiol. 2014;20(8):4340-4354
15. Xing TJ, Xu HT, Yu WQ. et al. Methylation regulation of liver-specific microRNA-122 expression and its effects on the proliferation and apoptosis of hepatocellular carcinoma cells. Genet Mol Res. 2013;12(3):3588-3597
Author contact
![]() Corresponding author: kzhu68com; xingtj518com
Corresponding author: kzhu68com; xingtj518com