Impact Factor ISSN: 1837-9664

 Global reach, higher impact
J Cancer 2014; 5(5):328-335. doi:10.7150/jca.8310 This issue Cite
Research Paper
Differentiation of Benign Fluid Collections from Soft-Tissue Sarcomas on FDG-PET/CT
Behrang Amini1 ![]() , John E. Madewell1, Hubert H. Chuang2, Tamara Miner Haygood1, Brian P. Hobbs3, Patricia S. Fox3, Roland L. Bassett3, Colleen M. Costelloe1
, John E. Madewell1, Hubert H. Chuang2, Tamara Miner Haygood1, Brian P. Hobbs3, Patricia S. Fox3, Roland L. Bassett3, Colleen M. Costelloe1
1. Department of Diagnostic Radiology, The University of Texas MD Anderson Cancer Center;
2. Department of Nuclear Medicine, The University of Texas MD Anderson Cancer Center;
3. Department of Biostatistics, The University of Texas MD Anderson Cancer Center, Houston, TX 77030, USA.
Received 2013-12-8; Accepted 2014-2-18; Published 2014-3-22
Abstract
Objective: To assess the diagnostic performance of 18F-FDG PET-CT in differentiating soft tissue sarcomas (STSs) from benign fluid collections (BFs).
Materials and methods: Four readers independently reviewed 100 lesions on 18F-FDG PET-CT and subjectively classified each lesion as an STS or BF and scored the spatial pattern of 18F-FDG avidity (SP) of each on a 4-point ordered scale (thin, moderate, thick, solid).
Results: Subjective assessment by readers allowed sensitive (91%-98%) differentiation of STSs from BFs, with lower specificity (59%-91%). The STSs had significantly higher SUVmax (median 10.7, range: 2.0-33.7) than BFs (median 2.8, range: 1.1-12.3). Reader agreement in assessment of SP had average κ = 0.61 (range 0.46-0.70). Classification of thick or solid SP as STS yielded an inter-reader averaged sensitivity and specificity of 69% and 98%, respectively. The presence of thick or solid SP resulted in 14.1-fold increase in partial odds of STS. Each unit increase in SUVmax resulted in 1.35-fold increase in partial odds of STS. The receiver operating characteristic (ROC) curves and 95% intervals for SUVmax alone and SUVmax + SP overlapped. The average subjective assessments for the four readers and estimated performance of using SP alone were both contained within the 95% intervals of the two ROC curves.
Conclusions: 18F-FDG PET-CT is a sensitive modality for differentiating STSs from BFs. SUVmax and SP are significantly associated with STS. Classification schemes based upon SUVmax alone or augmented with SP can be useful for distinguishing STS from BF.
Keywords: FDG PET-CT, Sarcoma, Benign Fluid Collections, Hematoma, Seroma, Abscess.
Introduction
Soft-tissue sarcomas (STSs) are mesenchymal-origin neoplasms characterized by locally aggressive behavior and a propensity for metastases [1]. Intra-lesional heterogeneity, a well-documented phenomenon in STSs [2-8], can lead to imaging characteristics on US, CT, MRI, and 18F-fluorodeoxyglucose (FDG) PET that can be confused with those of benign fluid collections (BFs), such as hematomas, abscesses, and post-operative fluid collections [3, 9-33].
This overlap in imaging appearance leads to diagnostic dilemmas in two main clinical situations: at initial diagnosis of a soft-tissue mass, and in differentiation of recurrent STS from a BF on post-operative imaging. In either setting, the clinician must decide between biopsy and short-term follow-up imaging, each with its own limitations and important implications for patient care. Biopsy of all suspected lesions would not only be costly, but sampling error can lead to equivocal results. Follow-up imaging can avoid this issue by demonstrating growth, stability, or regression, but can delay the diagnosis and appropriate treatment of malignant lesions.
18F-FDG PET-CT offers the potential of non-invasively helping to make this distinction. However, previous studies of differentiating STSs from benign lesions have met with variable success and have included few or no BFs [2, 13, 34-36]. In addition, the majority of these studies have used the degree of 18F-FDG avidity, as assessed by metrics such as standardized uptake values (SUVs), while ignoring other data available in 18F-FDG PET examinations, such as the spatial pattern of 18F-FDG avidity (SP). SP has not been as extensively investigated as SUV [36-42], and may provide additional information about the biological behavior of soft-tissue lesions on 18F-FDG PET [37].
This study will test two hypotheses about the use of 18F-FDG PET-CT in differentiation of STSs and BFs. We hypothesized that 1) 18F-FDG PET-CT can differentiate STSs from BFs, and 2) SP can provide useful information in differentiating STSs from BFs in addition to that provided by SUVmax.
Materials and Methods
Patient Population
Institutional review board approval was obtained for this HIPAA-compliant protocol. A retrospective study was performed using a search of FDG-PET/CT reports from 1/1/2006 to 12/31/2011 using keywords "hematoma," "seroma," "abscess," and "sarcoma." Reports were reviewed for all 3,938 cases. Images were reviewed when a report was unclear or indicated the presence of an STS or BF in the extremity. A total of 100 cases (44 BFs and 56 primary, recurrent, or metastatic STSs) met our inclusion criteria (Table 1). We limited the study to lesions in the extremities in order to decrease the likelihood of interpretation errors caused by normal adjacent structures such as bowel. When multiple studies were available from the same patient, the study on which the finding first appeared was selected. In cases of multiple lesions, only a single representative lesion from the patient was selected in order to avoid the bias toward malignancy when a large numbers of lesions were present. The readers were directed to the specific lesion in question prior to opening the study. The reference standard for STS was biopsy. The reference standard for BF was biopsy, decrease in size, or stability for at least 6 months off treatment as per imaging, or development immediately following surgery (too quickly for a malignancy to typically develop). Abscesses were confirmed by aspiration and microbiological analysis.
Inclusion criteria for lesions.
| Reference Standard | |
| - STS: Biopsy | |
| - BFs: Biopsy, or appearance immediately after surgery, or no growth on imaging > 6 months off therapy. | |
| Size > 3.0 cm | |
| Location in the extremities (including hips, buttocks and shoulders) | |
| Image Quality | |
| - Lesion completely visualized on PET | |
| - Lack of significant misregistration | |
| Absence of confounding lesions | |
| - Adjacent malignancy in cases of BF | |
| - Adjacent fluid collection in case of STS | |
Imaging
All 18F-FDG PET/CTs were performed at our institution according to standard guidelines and uniform image acquisition and processing protocols. Patients were instructed to fast for at least 6 hours prior to imaging and had a measured blood glucose level of less than 150 mg/dL at the time of radiopharmaceutical administration. Patients received 10 to 20 mCi of 18F-FDG, and were allowed to rest quietly in a darkened room for about 60 minutes before images were acquired on a PET/CT scanner (Discovery, GE Healthcare, Milwaukee, WI). CT images were acquired without oral or intravenous contrast, and used for attenuation correction of PET data.
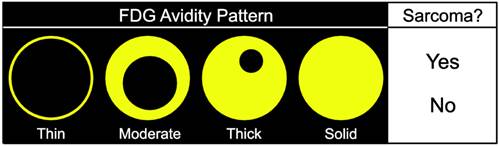
Four readers with 7 years, 6 years, 6 years, and 3 years of experience in interpretation of 18F-FDG PET/CT at a large cancer center that specializes in the care of STS underwent a 30-minute training session using cases not included in the subsequent imaging review. The readers were told that the lesions that they would be assessing would either be STSs (primary, recurrent, or metastatic) or BFs (post-operative collection, hematoma, or abscess). The readers independently reviewed the images on dedicated workstations (Advantage Workstation (AW), GE Healthcare, Milwaukee, WI) and were allowed to review all PET and CT images in the selected study using custom and adjustable window settings, but were blinded to historical data, other studies, and the final diagnoses. The readers were asked to 1) assess the SP of a specific lesion on a 4-point scale (thin, moderate, thick, or solid) independently of the degree of 18F-FDG avidity on a score sheet (Fig. 1), and 2) make a subjective determination based on their experience as to whether each lesion represented an STS.
Score sheet used by readers to assess the spatial pattern of 18F-FDG avidity (SP) of lesions on a 4-point scale. The readers were also asked to make a determination based on their experience as to whether each lesion represented an STS.
Standardized uptake value (SUV) was calculated as
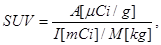
where A is the tissue tracer activity in microcuries per gram, I is the injected radiotracer dose in millicuries, and M is the patient mass in kilograms. The maximum SUV (SUVmax) for each lesion was measured by placing a 3D volume of interest around each lesion.
Statistical Analysis
Kruskal-Wallis tests were used to compare the 4-point ordered avidity scale by reference standard diagnosis, and Wilcoxon rank-sum tests were used to compare SUVmax. Kappa statistics were used to assess reader agreement of SP. Agreement was classified by convention based on Kappa values as slight (0.00-0.2), fair (0.21-0.40), moderate (0.41-0.60), substantial (0.61-0.80), and almost perfect (0.81-1.00) [43].
Logistic regression analysis was used to evaluate the diagnostic utility of using SUVmax alone and combined with SP for differentiation of STS from BF. The resultant receiver operating characteristic (ROC) curves are provided. The discrimination analysis for SUVmax alone used frequentist inference with Delong's 95% confidence interval (CI) [44] for the area under the ROC curve (AUC). The bootstrapping approach provided in the pROC library was used to compute 95% pointwise CIs for the ROC shape. Youden's optimal threshold using SUVmax alone is reported [45].
Because independent variable SP is assessed with uncertainty among the four readers, a joint model was used to conduct inference using all of the observed information. The combined inference used a Bayesian hierarchical model to integrate over the inherent inter-reader variability for evaluating SP. For each patient, the presence of thick or solid SP was treated as a binary random variable. Let πi denote the probability that the ith patient presents thick or solid SP (i = 1, …, n). A conditional multiple logistic regression model was used to adjust the ith patient's log-odds ratio for presence of STS as a linear combination of an intercept, a partial effect modifying SUVmax, and a partial effect modifying πi. Beta (1, 1) prior distributions were assumed for the πis reflecting maximum entropy. Non-informative normal prior distributions were assumed for the intercept and regression coefficients. Results are reported to reflect discrimination of STS in the presence of the estimated inter-reader variability for evaluating SP in the form of marginal 95% pointwise posterior credible intervals (pCI) for the AUC and ROC shape. Summaries of the resultant partial regression coefficients associated SUVmax and SP are provided. All statistical analyses were performed using SAS 9.3, R.2.12.2, and OpenBUGS 3.2.1.
Results
There were 100 patients, ranging from 9 to 89 years of age (median age 54 years), with 42 females and 58 males. There were 100 lesions (Table 2), of which 56 were STSs and 44 were BFs. Of the 56 STSs, 38 (68%) were primary, 14 (25%) were recurrences, and 4 (7%) were metastases. Of the 44 BFs, 32 (72.8%) were post-operative fluid collections, 9 (20.5%) were hematomas, and 3 (6.8%) were abscesses. Of the 9 hematomas 3 were of unknown etiology, 3 related to catheter placement, 2 were related to surgery, and 1 was related to anticoagulation. The abscesses were associated with immunocompromised status in patients receiving chemotherapy, either related to direct inoculation following minor injury or in the setting of systemic bacteremia.
Number and type of lesions studied.
| Lesion | Number (%) | |
|---|---|---|
| Total | 100 | |
| Soft-tissue sarcomas | 56 | |
| Malignant fibrohistiocytic tumors | 17 (30.4) | |
| Undifferentiated sarcomas (NOS) | 13 (23.2) | |
| Synovial sarcoma | 6 (10.7) | |
| Liposarcoma | 5 (8.9) | |
| Leiomyosarcoma | 4 (7.2) | |
| PNET/Ewing sarcoma | 3 (5.4) | |
| Alveolar soft part sarcoma | 2 (3.6) | |
| Epithelioid sarcoma | 2 (3.6) | |
| MPNST | 2 (3.6) | |
| Clear cell sarcoma of soft tissue | 1 (1.8) | |
| Rhabdomyosarcoma | 1 (1.8) | |
| BFs | 44 | |
| Post-operative fluid collection | 32 (72.8) | |
| Hematoma | 9 (20.5) | |
| Abscess | 3 (6.8) | |
Histological subtypes of sarcomas according to the American Joint Committee on Cancer classification [48]. MPNST, malignant peripheral nerve sheath tumor; NOS, not otherwise specified; PNET, primitive neuroectodermal tumor.
The diagnostic performance of 18F-FDG PET-CT using the subjective assessments of the 4 readers is shown in Table 3. The mean sensitivity of the readers for detection of STSs was 93% (range: 91% - 98%) and the mean specificity was 77% (range: 59% - 91%).
Reader performance by subjective assessment.
| Reader | Sensitivity | Specificity |
|---|---|---|
| 1 | 91 % | 91 % |
| 2 | 93 % | 75 % |
| 3 | 98 % | 59 % |
| 4 | 91 % | 82 % |
| Mean | 93 % | 77 % |
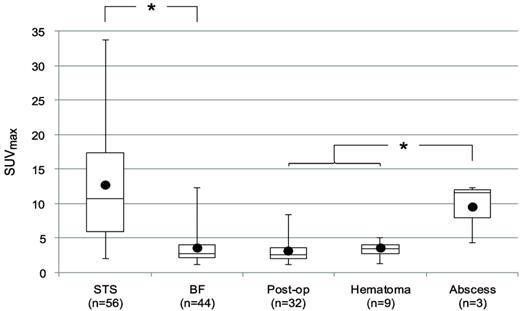
We next assessed the data available in 18F-FDG PET studies, including SUVmax and SP. The SUVmax for the lesions is shown in Fig. 2. The median SUVmax for all lesions was 5.5 (range: 1.1-33.7). The STSs had a significantly higher SUVmax (median 10.7, range: 2.0-33.7) than BFs (median 2.8, range: 1.1-12.3) (p<0.0001). The median SUVmax of abscesses (11.6, range 4.3 -12.3) was higher than that of the other BFs (2.7, range 1.1-8.4) (p=0.009).
SUVmax by type of lesion. Bars represent the range, boxes represent the 25th-75th percentile range, black circles represent the mean, and horizontal lines represent the median. The median SUVmax of STSs was 10.7 (range: 2.0 -33.7). The median SUVmax of all BFs was 2.8 (range: 1.1 -12.3). The median SUVmax of post-operative fluid collections (Post-op), hematomas, and abscesses were 2.7 (range: 1.1 -8.4), 3.5 (range: 1.3 -5.1), and 11.6 (range: 4.3 -12.3), respectively. *, statistically significant difference (p < 0.05).
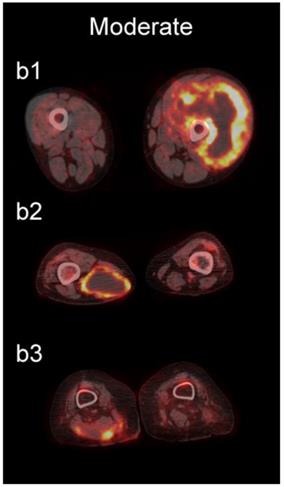
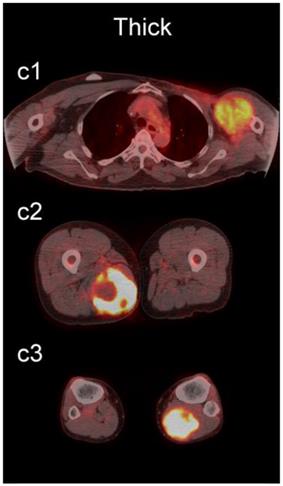
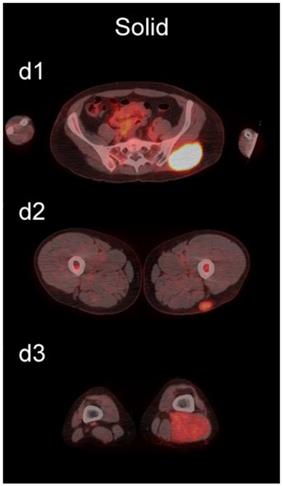
The readers scored the SP of the STSs and BFs on the 4-point avidity scale (Fig. 1). Reader agreement was substantial (κ = 0. 61) and varied among the different SPs, being highest for the thin SP (κ = 0.70) and lowest for the thick SP (κ = 0.46, Table 4). Examples of SPs with 100% reader agreement are shown in Fig. 3.
Reader Agreement of Spatial Pattern of 18F-FDG Avidity
| Pattern | Kappa | p-value |
|---|---|---|
| Thin | 0.70 | <0.0001 |
| Moderate | 0.60 | <0.0001 |
| Thick | 0.46 | <0.0001 |
| Solid | 0.63 | <0.0001 |
| All | 0.61 | <0.0001 |
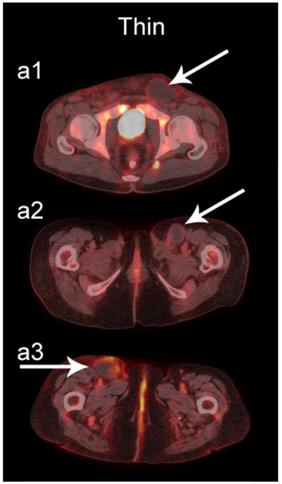
Examples of lesions with 100% observer agreement on assessment of SP. a Thin SP a1 A 77-year-old woman with a seroma (arrow) 17 days following excisional nodal biopsy (SUVmax = 1.7). a2 A 66-year-old woman with a seroma (arrow) 3 months following excisional nodal biopsy (SUVmax = 2.0). a3 A 21-year-old man with a seroma (arrow) 10 days following excisional nodal biopsy and hydrocele repair (SUVmax = 3.9). b Moderate SP: b1 A 46-year-old man with undifferentiated sarcoma (SUVmax = 19.4). b2 A 38-year-old man with a fungal abscess (SUVmax = 11.6). b3 A 78-year-old woman with recurrent myxoid pleomorphic undifferentiated sarcoma (SUVmax = 5.9). c Thick SP: c1 A 67-year-old man with metastatic undifferentiated sarcoma (SUVmax = 6.3). c2 A 65-year-old man with pleomorphic undifferentiated sarcoma (SUVmax = 30.3). c3 A 45-year-old man with synovial sarcoma (SUVmax = 10.9). d Solid SP: d1 A54-year-old woman with rhabdomyosarcoma (SUVmax = 15.7). d2 A 43-year-old man with pleomorphic undifferentiated sarcoma (SUVmax = 2.7). d3 A 48-year-old woman with myxoid liposarcoma (SUVmax = 2.9).
The SP of STSs was more likely to be assessed as thick or solid by all readers (p<0.0001). Modeling the diagnostic efficacy of a system that classified lesions with a thick or solid SP as an STS yielded an inter-reader averaged sensitivity and specificity of 69% and 98%, respectively.
Bayesian multiple logistic regression analysis attained significance for both SUVmax and SP. The presence of thick or solid SP resulted in an estimated 14.1-fold increase in the partial odds of STS with 95% pCI=(3.74, 54.1). Moreover, each unit increase in SUVmax was associated with a 1.35-fold increase in the partial odds of STS with 95% pCI=(1.18, 1.60).
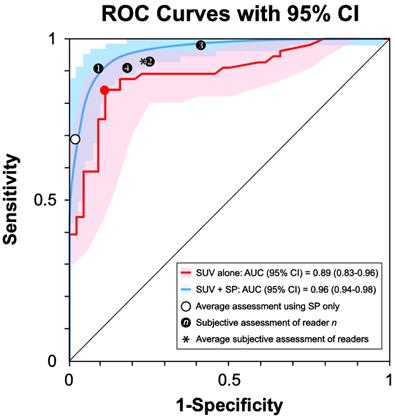
The ROC curve based on SUVmax alone (Fig. 4, red curve) produced an AUC=0.89 (95% CI 0.83 - 0.96). The optimal discrimination between STS and BF was at SUVmax = 5.15 (Fig. 4, red dot), yielding a sensitivity of 84% and specificity of 89%. Classification using both SUVmax and SP (Fig. 4, blue curve) resulted in an AUC=0.96 (95% pCI = 0.94 - 0.98). Comparing the two interval estimates of AUC revealed that the resultant improvement in the discriminability of STS from BF using both SUVmax and SP did not achieve statistical significance at the 0.05 level. The average of the subjective assessments for the four readers (Fig. 4, see asterisk) and estimated performance of using SP alone (Fig. 4, see open circle) were contained within the 95% interval estimates of both ROC shapes.
Receiver Operating Characteristics (ROC) Curves. ROC curves and 95% CIs for SUVmax (red) and SUVmax + SP (blue) in the classification of a lesion as an STS. The two CIs overlap. The average performance of the readers (*) is within the 95% CI of the two curves. The estimated performance of using SP alone (open circle) is also within the 95% CI of the two curves.
Discussion
Our results showed that 18F-FDG PET-CT is a sensitive (mean 93%, range: 91% - 98%) modality for the differentiation of STSs from BFs (Table 3). The mean specificity of 77% (range: 59% - 91%) was lower than the sensitivity. However, given the importance of making a prospective diagnosis of a sarcoma, the high sensitivity affirms the value of 18F-FDG PET-CT in the early diagnostic workup of patients suspected of having a primary or recurrent sarcoma, especially given that the studies were interpreted in the absence of historical and clinical data. Our results are in the range of sensitivity (91% - 100%) and specificity (73% - 100%) reported in the literature on differentiating STS from benign soft-tissue lesions [5, 6, 16, 35, 36, 46], although these studies included few or no BFs.
We found statistically significant differences in the SUVmax of STSs (10.7, range: 2.0-33.7) and BFs (2.8, range: 1.1-12.3). In addition, SUVmax was significantly independently associated with STS in the presence of SP.
We also examined the contribution SP to the differentiation of STSs from BFs. SP has not been as extensively investigated as SUV [36-42], and may provide additional information about the biological behavior of soft-tissue lesions on 18F-FDG PET [37]. SP can be assessed qualitatively or quantitatively. Qualitative assessments of heterogeneity, degree of peripheral nodularity, and apparent peripheral thickness of lesions have been used in the past to differentiate benign from malignant lung [38] and peripheral nerve sheath [39] tumors, and to distinguish between high-grade and low-grade STSs [36]. Quantitative algorithms for objective characterization of SP have been used to estimate prognosis in patients with STSs [37, 40, 41] and to assess treatment response in patients with head and neck cancers [42]. Widespread adoption of these quantitative methods has likely been hampered by practical concerns such as time constraints in busy clinical practices. We chose to focus on a qualitative assessment of SP to provide a more readily applied clinical method using an intuitive 4-point scale (Fig. 1) for subjective evaluation of SP (Fig. 3).
Agreement among the readers in scoring the SPs had a mean κ = 0.61 (range 0.46-0.70). This mild degree of inter-observer variability is likely subjective. STSs were more likely to be assessed as thick or solid across all readers (p<0.0001), and we found that SP was significantly independently associated with STS in the presence of SUVmax.
The shape of the ROC curves may suggest that the incorporation of SP (Fig. 4, blue curve) improves discrimination of STS from BF compared to SUVmax alone (Fig. 4, red curve); however, the difference between the AUCs lacked statistical significance, and the shapes of the 95% intervals overlapped. The average of the subjective assessments for the four readers (Fig. 4, see asterisk) and estimated performance of using SP alone (Fig. 4, open circle) were contained within the 95% interval estimates of both ROC shapes, suggesting that the sensitivity/specificity tradeoffs derived from the subjective assessments of the 4 readers are similar to the tradeoffs provided by the quantitative methods.
Our study has several limitations. First, it was retrospective and 18F-FDG PET-CT is not routinely used for detecting abscesses or hematomas in our clinical practice. This likely introduced a selection bias regarding our patient population, which tended to include large numbers of simple post-operative fluid collections (72.8%) detected on routine surveillance, and relatively few hematomas (20.5%) and abscesses (6.8), which are usually characterized by MRI or ultrasound at our institution. Given that inflammatory lesions such as hematomas and abscesses tend to have higher SUVmax and present greater diagnostic challenges, our results will need prospective validation with a more diverse population of lesions.
We found an "optimal" SUVmax threshold of 5.15 for classification of STS using SUVmax alone, arbitrarily assuming equal costs for misclassification of a lesion as an STS and a BF. In clinical practice, the implications of a false negative diagnosis of an STS would likely outweigh those of a false positive diagnosis; however, in the interest of objectivity we adopted the more conventional assumption of equal costs in our analysis, avoiding specification of subjective utility weights. In addition, this SUVmax threshold should be used with caution, given the variability that exists in SUV measurements across institutions [47].
An apparent limitation of our study concerns the inclusion of lesions with the solid SP. It can be argued that these cases present little or no diagnostic challenge, since they would be expected to represent STSs. Given the degree of inter-observer variability for the solid SP (κ = 0.63, Table 4), our results indicate that this SP is not necessarily straightforward. This may be secondary to the “blooming” effect that is evident when FDG uptake is indicated on fused images.
Conclusion
18F-FDG PET-CT is a sensitive modality for the differentiation of STSs from BFs. Multivariate analysis showed that SUVmax and SP are both significantly independently associated with STS. Classification schemes based upon SUVmax, alone or augmented with SP are expected to help effectively discriminate STS.
Acknowledgements
The authors would like to thank Dr. Naveen Garg, M.D. for creating the software used to search the RIS database and Dr. Wei-Lien Wang, M.D. for a helpful discussion on classification of STSs. The work was partially supported by the NIH/NCI under award number P30CA016672 and used the biostatistics research group.
Conflict of Interest
None.
References
1. Ceyssens S, Stroobants S. Sarcoma. Methods Mol Biol. 2011;727:191-203
2. Nieweg OE, Pruim J, van Ginkel RJ. et al. Fluorine-18-fluorodeoxyglucose PET imaging of soft-tissue sarcoma. J Nucl Med. 1996;37:257-261
3. Adler LP, Blair HF, Makley JT. et al. Noninvasive grading of musculoskeletal tumors using PET. J Nucl Med. 1991;32:1508-1512
4. Griffeth LK, Dehdashti F, McGuire AH. et al. PET evaluation of soft-tissue masses with fluorine-18 fluoro-2-deoxy-D-glucose. Radiology. 1992;182:185-194
5. Lodge MA, Lucas JD, Marsden PK, Cronin BF, O'Doherty MJ, Smith MA. A PET study of 18FDG uptake in soft tissue masses. Eur J Nucl Med. 1999;26:22-30
6. Schwarzbach MH, Dimitrakopoulou-Strauss A, Willeke F. et al. Clinical value of [18-F]] fluorodeoxyglucose positron emission tomography imaging in soft tissue sarcomas. Ann Surg. 2000;231:380-386
7. Eary JF, Conrad EU, Bruckner JD. et al. Quantitative [F-18]fluorodeoxyglucose positron emission tomography in pretreatment and grading of sarcoma. Clin Cancer Res. 1998;4:1215-1220
8. Kole AC, Nieweg OE, van Ginkel RJ. et al. Detection of local recurrence of soft-tissue sarcoma with positron emission tomography using [18F]fluorodeoxyglucose. Ann Surg Oncol. 1997;4:57-63
9. Hamada K, Myoui A, Ueda T. et al. FDG-PET imaging for chronic expanding hematoma in pelvis with massive bone destruction. Skeletal Radiol. 2005;34:807-811
10. Sreenivas M, Nihal A, Ettles DF. Chronic haematoma or soft-tissue neoplasm? A diagnostic dilemma. Arch Orthop Trauma Surg. 2004;124:495-497
11. Metser U, Miller E, Lerman H, Even-Sapir E. Benign nonphysiologic lesions with increased 18F-FDG uptake on PET/CT: characterization and incidence. AJR Am J Roentgenol. 2007;189:1203-1210
12. Takahama M, Yamamoto R, Nakajima R, Izumi N, Tada H. Extrathoracic protrusion of a chronic expanding hematoma in the chest mimicking a soft tissue tumor. Gen Thorac Cardiovasc Surg. 2010;58:202-204
13. Aoki J, Watanabe H, Shinozaki T. et al. FDG-PET for preoperative differential diagnosis between benign and malignant soft tissue masses. Skeletal Radiol. 2003;32:133-138
14. Imaizumi S, Morita T, Ogose A. et al. Soft tissue sarcoma mimicking chronic hematoma: value of magnetic resonance imaging in differential diagnosis. J Orthop Sci. 2002;7:33-37
15. Dimitrakopoulou-Strauss A, Strauss LG, Schwarzbach M. et al. Dynamic PET 18F-FDG studies in patients with primary and recurrent soft-tissue sarcomas: impact on diagnosis and correlation with grading. J Nucl Med. 2001;42:713-720
16. Watanabe H, Shinozaki T, Yanagawa T. et al. Glucose metabolic analysis of musculoskeletal tumours using 18fluorine-FDG PET as an aid to preoperative planning. J Bone Joint Surg Br. 2000;82:760-767
17. Kelm J, Ahlhelm F, Engel C, Duchow J. Synovial sarcoma diagnosed after a sports injury. Am J Sports Med. 2001;29:367-369
18. Agarwal N, Kaur N, Panwar P, Singh B. Synovial sarcoma of the thigh mimicking chronic cystic hematoma: a rare manifestation. J BUON. 2010;15:192
19. Lenin Babu V, Rana MM, Arumilli BR, Dean T, Brown C, Paul A. Chronic expanding haematomas with interesting presentations. Iowa Orthop J. 2007;27:108-111
20. Cebesoy O, Tutar E, Arpacioglu O. Spontaneous giant expanding thigh hematoma mimicking soft tissue neoplasm. Joint Bone Spine. 2008;75:64-66
21. Mann HA, Hilton A, Goddard NJ, Smith MA, Holloway B, Lee CA. Synovial sarcoma mimicking haemophilic pseudotumour. Sarcoma. 2006;2006:27212
22. Rajapakse BN, Kiddle G. Calcifying haematoma mimicking a soft tissue sarcoma and myositis ossificans. ANZ J Surg. 2006;76:1027-1029
23. Niimi R, Matsumine A, Kusuzaki K. et al. Soft-tissue sarcoma mimicking large haematoma: a report of two cases and review of the literature. J Orthop Surg (Hong Kong). 2006;14:90-95
24. Lee YM, Chung HW, Shin MJ. et al. Musculoskeletal magnetic resonance imaging suggesting the possibility of liposarcoma: correlation between radiologists' certainty of diagnosis and pathology results. J Comput Assist Tomogr. 2011;35:512-516
25. Gaskill T, Payne D, Brigman B. Cryptococcal abscess imitating a soft-tissue sarcoma in an immunocompetent host: a case report. J Bone Joint Surg Am. 2010;92:1890-1893
26. Akeda K, Kasai Y, Kawakita E, Seto M, Kono T, Uchida A. Primary Ewing sarcoma of the spine mimicking a psoas abscess secondary to spinal infection. Spine (Phila Pa 1976). 2009;34:E337-341
27. Taieb S, Penel N, Vanseymortier L, Ceugnart L. Soft tissue sarcomas or intramuscular haematomas? Eur J Radiol. 2009;72:44-49
28. McKenzie G, Raby N, Ritchie D. Pictorial review: Non-neoplastic soft-tissue masses. Br J Radiol. 2009;82:775-785
29. James SL, Davies AM. Post-operative imaging of soft tissue sarcomas. Cancer Imaging. 2008;8:8-18
30. Allen DJ, Goddard NJ, Mann HA, Rodriguez-Merchan EC. Primary malignancies mistaken for pseudotumours in haemophilic patients. Haemophilia. 2007;13:383-386
31. Berquist TH, Ehman RL, King BF, Hodgman CG, Ilstrup DM. Value of MR imaging in differentiating benign from malignant soft-tissue masses: study of 95 lesions. AJR Am J Roentgenol. 1990;155:1251-1255
32. Dion E, Forest M, Brasseur JL, Amoura Z, Grenier P. Epithelioid sarcoma mimicking abscess: review of the MRI appearances. Skeletal Radiol. 2001;30:173-177
33. Kransdorf MJ, Jelinek JS, Moser RP Jr. et al. Soft-tissue masses: diagnosis using MR imaging. AJR Am J Roentgenol. 1989;153:541-547
34. Aoki J, Endo K, Watanabe H. et al. FDG-PET for evaluating musculoskeletal tumors: a review. J Orthop Sci. 2003;8:435-441
35. Ioannidis JP, Lau J. 18F-FDG PET for the diagnosis and grading of soft-tissue sarcoma: a meta-analysis. J Nucl Med. 2003;44:717-724
36. Lucas JD, O'Doherty MJ, Cronin BF. et al. Prospective evaluation of soft tissue masses and sarcomas using fluorodeoxyglucose positron emission tomography. Br J Surg. 1999;86:550-556
37. Eary JF, O'Sullivan F, O'Sullivan J, Conrad EU. Spatial heterogeneity in sarcoma 18F-FDG uptake as a predictor of patient outcome. J Nucl Med. 2008;49:1973-1979
38. Inoue T, Kim EE, Komaki R. et al. Detecting recurrent or residual lung cancer with FDG-PET. J Nucl Med. 1995;36:788-793
39. Salamon J, Derlin T, Bannas P. et al. Evaluation of intratumoural heterogeneity on (18)F-FDG PET/CT for characterization of peripheral nerve sheath tumours in neurofibromatosis type 1. Eur J Nucl Med Mol Imaging. 2013;40:685-692
40. O'Sullivan F, Roy S, Eary J. A statistical measure of tissue heterogeneity with application to 3D PET sarcoma data. Biostatistics. 2003;4:433-448
41. O'Sullivan F, Roy S, O'Sullivan J, Vernon C, Eary J. Incorporation of tumor shape into an assessment of spatial heterogeneity for human sarcomas imaged with FDG-PET. Biostatistics. 2005;6:293-301
42. El Naqa I, Grigsby P, Apte A. et al. Exploring feature-based approaches in PET images for predicting cancer treatment outcomes. Pattern Recognit. 2009;42:1162-1171
43. Landis JR, Koch GG. The measurement of observer agreement for categorical data. Biometrics. 1977;33:159-174
44. DeLong ER, DeLong DM, Clarke-Pearson DL. Comparing the areas under two or more correlated receiver operating characteristic curves: a nonparametric approach. Biometrics. 1988;44:837-845
45. Youden WJ. Index for rating diagnostic tests. Cancer. 1950;3:32-35
46. Feldman F, van Heertum R, Manos C. 18FDG PET scanning of benign and malignant musculoskeletal lesions. Skeletal Radiol. 2003;32:201-208
47. Adams MC, Turkington TG, Wilson JM, Wong TZ. A systematic review of the factors affecting accuracy of SUV measurements. AJR Am J Roentgenol. 2010;195:310-320
48. Edge SB, Byrd DR, Compton CC, Fritz AG, Greene FL, Trotti A. Soft Tissue Sarcoma, 7 ed. New York: Springer. 2010:292-298
Author contact
![]() Corresponding author: Behrang Amini, MD, PhD. The University of Texas MD Anderson Cancer Center, Department of Diagnostic Radiology, 1515 Holcombe Blvd., Unit 1475, Houston, TX 77030. baminiorg Phone: (713) 792-5181 Fax: (713) 563-6633.
Corresponding author: Behrang Amini, MD, PhD. The University of Texas MD Anderson Cancer Center, Department of Diagnostic Radiology, 1515 Holcombe Blvd., Unit 1475, Houston, TX 77030. baminiorg Phone: (713) 792-5181 Fax: (713) 563-6633.