Impact Factor ISSN: 1837-9664

 Global reach, higher impact
J Cancer 2014; 5(3):182-191. doi:10.7150/jca.6799 This issue Cite
Research Paper
Potential Urinary miRNA Biomarker Candidates for the Accurate Detection of Prostate Cancer among Benign Prostatic Hyperplasia Patients
Taha A Haj-Ahmad1, Moemen AK Abdalla2 ![]() , Yousef Haj-Ahmad1
, Yousef Haj-Ahmad1
1. Centre for Biotechnology, Brock University, St. Catharines, ON, L2S 3A1, Canada.
2. Department of Biochemistry, Faculty of Science, Alexandria University, Egypt.
Received 2013-5-30; Accepted 2013-11-22; Published 2014-1-29
Abstract
MicroRNAs (miRNAs) are a class of short (~22nt), single stranded RNA molecules that function as post-transcriptional regulators of gene expression. MiRNAs can regulate a variety of important biological pathways, including: cellular proliferation, differentiation and apoptosis. Profiling of miRNA expression patterns was shown to be more useful than the equivalent mRNA profiles for characterizing poorly differentiated tumours. As such, miRNA expression “signatures” are expected to offer serious potential for diagnosing and prognosing cancers of any provenance. The aim of this study was to investigate the potential of using deregulation of urinary miRNAs in order to detect Prostate Cancer (PCa) among Benign Prostatic Hyperplasia (BPH). To identify the miRNA signatures specific for PCa, miRNA expression profiling of 8 PCa patients, 12 BPH patients and 10 healthy males was carried out using whole genome expression profiling. Differential expression of two individual miRNAs between healthy males and BPH patients was detected and found to possibly target genes related to PCa development and progression. The sensitivity and specificity of miR-1825 for detecting PCa among BPH individuals was found to be 60% and 69%, respectively. Whereas, the sensitivity and specificity of miR-484 were 80% and 19%, respectively. Additionally, the sensitivity and specificity for miR-1825/484 in tandem were 45% and 75%, respectively. The proposed PCa miRNA signatures may therefore be of great value for the accurate diagnosis of PCa and BPH. This exploratory study has identified several possible targets that merit further investigation towards the development and validation of diagnostically useful, non-invasive, urine-based tests that might not only help diagnose PCa but also possibly help differentiate it from BPH.
Keywords: Prostate Cancer, Benign Prostatic Hyperplasia, Urine, MicroRNA, Biomarkers.
Introduction
Globally, PCa is the second most common, non-cutaneous cancer among men (1, 2). Various studies have observed a positive correlation between age and incidence of PCa (2, 3, 4). Environmental factors, particularly diet, have also been reported to potentially play a role in a man's risk for PCa (5). A number of techniques are currently available for assessing prostate health, the most common of which include digital rectal exam (DRE), trans-rectal ultrasonography (TRUS), and prostate specific antigen-based testing (PSA) (6, 7).
Since PSA is primarily produced in the prostate and is therefore relatively prostate specific, it was proposed that a sharp but consistent increase in serum PSA was indicative of exponential prostate cell growth, as might occur in PCa (8). PSA test had been validated for detecting PCa using any serum level above the empirically determined cutoff of 4ng/mL (9). PSA's use as a marker for PCa was soon limited by the many instances of BPH that were also associated with an increased serum PSA above the 4ng/mL cutoff, and especially in the range of 4-10ng/mL (10).
Serum PSA testing for the early detection of PCa has a sensitivity of around 86% and a specificity of approximately 33%, depending on patient's age and local prevalence of disease (11, 12). These problems have formed the basis for much controversy surrounding PSA's use as a regular blood-based screening tool for PCa (13, 14). As such, the search for novel PCa biomarkers, especially from non-invasive fluids, has been ongoing (15, 16).
MicroRNAs (miRNAs) are a class of short (~22nt), single stranded RNA molecules that function as post-transcriptional regulators of gene expression (17). MiRNAs have been found to play a significant role in carcinogenesis (18). They do so via their ability to function as regulators of tumour suppressors and oncogenes (19). MiRNA expression “signatures” are expected to offer serious potential for diagnosing and prognosing cancers of any provenance (20, 21).
Oncomirs, as they are known, function to down-regulate traditional tumour suppressor genes. An over-abundance of such microRNAs has been implicated in the progression of certain cancers (22). For example, PTEN, a tumour-suppressor gene that is responsible for promoting apoptosis via the PI3K-AKT-mTOR pathway, is a predicted target of microRNAs belonging to the miR-17-92 cluster (23, 24). While miRNAs such as those in the 17-92 cluster have been observed functioning as oncogenes, other miRNAs such as let-7 have been observed acting like tumour suppressors (22). MiRNAs that function as tumour suppressors do so by targeting traditional oncogenes, i.e. genes that promote cellular proliferation or that block apoptosis. For example, a number of human cancers have been shown to harbour a deletion in the chromosomal region encoding the let-7 microRNA (25). In particular, down-regulation of let-7 has been observed in several human lung cancers (26).
While differences in methodology and sampling likely form the basis for such inconsistencies, it's through studies like these that an association between PCa and several miRNAs has already been tentatively established (27). To date however, no miRNA-based diagnostic test has yet been approved for the early detection of PCa. In this study, the miRNA expression profiles in urine samples collected from PCa patients, BPH patients as well as from healthy male group were analyzed. MiRNA profiling was firstly carried out on miRNA isolated from urine samples pooled from each group using LC Sciences patented microarray technology. Furthermore, we evaluated the deregulation of 2 miRNAs, revealed from our data, as potential non-invasive urinary biomarkers for the accurate diagnosis of prostate cancer among Benign Prostatic Hyperplasia Patients.
Materials and Methods
Urine sample collection
After approval from the Research Ethics Board at Brock University (St. Catharines, ON, Canada), urine samples were collected from 29 Egyptian males present at Alexandria University's General Hospital (Alexandria, Egypt). Urine samples were collected into 50mL Corning tubes containing Norgen's Urine Preservative Solution (Cat# 18126) (Norgen Biotek, Thorold, ON, Canada). The samples were acquired from among three groups of individuals, each described by a questionnaire completed by the patients' attending physician. Group I urine samples were collected from eight individuals diagnosed with Prostate Cancer (PCa). Group II urine samples were collected from twelve individuals with Benign Prostatic Hyperplasia (BPH). Urine samples from Group III were collected from ten healthy males (Table 1). Urine samples collected from men with other ailments, including Diabetes mellitus, kidney disease, and/or infections such as chronic HBV, HBV/HCV co-infection or Schistosomiasis, were excluded from participation. Each man included in the study was also given a PSA test as part of sample collection. Furthermore, urine samples were collected from the same patients two years from their initial participation in the study; a PSA test was also performed for this second collection.
Clinical parameters regarding the males involved with this study.
| Healthy Males | Prostate Cancer Patients | Benign Prostatic Hyperplasia Patients | |
|---|---|---|---|
| Number of males | 10 | 8 | 12 |
| PSA Level (ng/mL) | (0.8 ± 0.6) | (7.9 ± 3.0) | (4.9 ± 1.4) |
| HCV or HBV Status | -Ve | -Ve | -Ve |
| Diabetes mellitus | -Ve | -Ve | -Ve |
| Schistosomiasis | -Ve | -Ve | -Ve |
| Kidney diseases | -Ve | -Ve | -Ve |
Isolation of total RNA from urine
Total RNA was isolated from 2.5mL of urine using the Urine Total RNA Purification Maxi Kit (Slurry Format) (Cat# 29600) (Norgen Biotek, Thorold, ON, Canada). The isolation was performed according to the manufacturer's instructions.
MicroArray-based MicroRNA Expression Profiling in Pooled Samples
Differential expression analysis of miRNAs between the pooled samples was performed using LC Science's μParaflo™ MiRNA Microarray technology.
Relative expression profiling for candidate miRNAs using RT-qPCR
Relative miRNA expression levels for the 5 candidate miRNAs (miR-1234, miR-1238, miR-1913, miR-486-5p, miR-1825, miR-484 and miR-483-5p) were analyzed among the PCa group, BPH group and the healthy male group. Candidate miRNAs were reversibly-transcribed using 3µl of RNA template and 0.5µl gene-specific stem-loop RT primer (Table 2). The reaction was then made up with RNase-free water to 10μL and incubated for 5 mins at 70°C and was then held at 4ºC. During the 4°C incubation, a mix of 4µl 5X first strand Buffer, 2µl of 0.1mM DTT, 1µl of 10mM dNTPs, 0.5µl SuperScript III (Invitrogen) and 2.5µl nuclease-free water were added to the initial reaction for a final reaction volume of 20µL. The final reaction was then incubated at 25°C for 5 min, 50°C for 30 min, 70°C for 15 min with a final hold at 4°C. For controls, minus All samples were analyzed using the iCycler iQ real time PCR detection system with iQ SYBR Green Supermix (BioRad Laboratories). For each sample, 3μl from its corresponding RT reaction were mixed in a 10μl iQ SYBR Green Supermix, 6.76μl nuclease-free water and 0.12μl each specific forward and reverse miRNA primer (Table 2) in a total of 20μl. The expression levels were normalized to 5S rRNA levels. Relative gene expression was expressed as the LOG2 of fold change. Fold changes were calculated using the ΔΔCt method (28).
Synthetic oligonucleotides used in this study.
| Name | Sequence |
|---|---|
| 5S rRNA (Forward) | 5'GCCATACCACCCTGAACG3' |
| 5S rRNA (Reverse) | 5'AGCCTACAGCACCCGGTATT3' |
| SL-miR-486-5p | 5'GTCGTATCCAGTGCAGGGTCCGAGGTATTCGCACTGGATACGACCTCGG3' |
| miR-486-5p (Forward) | 5'TCCTGTACTGAGCTGCC3' |
| SL-miR-1825 | 5'GTCGTATCCAGTGCAGGGTCCGAGGTATTCGCACTGGATACGACGGAGA3' |
| miR-1825 (Forward) | 5'TCCAGTGCCCTCCTCT3' |
| SL-miR-484 | 5'GTCGTATCCAGTGCAGGGTCCGAGGTATTCGCACTGGATACGACATCGG3' |
| miR-484 (Forward) | 5'TCAGGCTCAGTCCCCTC3' |
| SL-miR-1238 | 5'GTCGTATCCAGTGCAGGGTCCGAGGTATTCGCACTGGATACGACGGGGC3' |
| miR-1238 (Forward) | 5'CTTCCTCGTCTGTCT3' |
| SL-miR-1913 | 5'GTCGTATCCAGTGCAGGGTCCGAGGTATTCGCACTGGATACGACTGGCA3' |
| miR-1913 (Forward) | 5'TCTGCCCCCTCCGCTGC3' |
| SL-miR-1234 | 5'GTCGTATCCAGTGCAGGGTCCGAGGTATTCGCACTGGATACGACGTGGG3' |
| miR-1234 (Forward) | 5'TCGGCCTGACCACCCAC3' |
Results
MicroArray-based MicroRNA Expression Profiling in Pooled Samples
Total RNA was isolated from 2.5mL of each urine sample using the Urine Total RNA Purification Maxi Kit (Slurry Format, Cat# 29600; Norgen Biotek, Thorold, ON, Canada). Purified RNA from each sample within a group was then pooled, resulting in three samples: PCa, BPH and Healthy Control. Differential expression analysis of miRNAs between the pooled samples was performed using LC Science's μParaflo™ MiRNA Microarray technology. To determine fold change, the signal intensity of each miRNA (in pooled PCa or BPH) was divided against the corresponding miRNA level for the healthy control group and the LOG2 of the quotient was then obtained.
Of the 894 miRNAs assayed, seventeen were found to differ significantly in their levels between the three groups (ANOVA p-value < 0.01). These miRNAs included: miR-1826, miR-1234, miR-1238, miR-191*, miR-484, miR-191, miR-451, miR-486-5p, miR-1913, miR-625*, miR-1825, miR-92a, miR-92b, miR-483-5p, miR-486-3p, miR-563, miR-940 (Figure 1). Of these seventeen, all but miR-483-5p was down-regulated in PCa with respect to the healthy control group. Similarly in BPH, miR-1826 were both found to be up-regulated, and the rest down-regulated with respect to the healthy control group. From the microarray results: each of the seventeen miRNAs except for miR-1826, were deregulated in the same direction in both PCa and BPH (when each pool was compared to the healthy control pool).
Expression of Eighteen Significantly Deregulated MiRNAs between Pooled PCa, BPH and Healthy by Microarray.
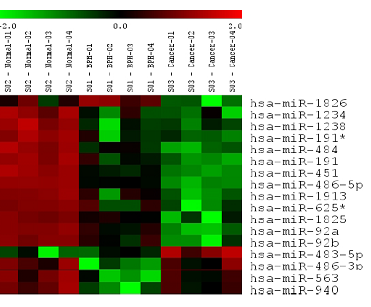
From these seventeen, only certain miRNAs were selected for further analysis. Based on published literature suggesting that a miRNA's mRNA target was potentially involved in cancer (targets determined using TargetScan and MiRanda databases as outlined by Griffiths-Jones et al. in 2006) (29), seven of miRNAs were selected for further expression analysis among individual urine samples. The selected miRNAs included miRs: 1234, 1238, 1913, 486-5p, 1825, 484 and 483-5p. Their putative mRNA targets and the literature proposing each target's potential role in cancer are summarized in Table 3.
Selected microRNAs and their Putative Targets.
| MicroRNA | Type of Deregulation | Putative Target | Reference |
|---|---|---|---|
| miR-1234 | Down in PCa & BPH vs Healthy | DAB2-Interacting-Protein | 30, 32, 33 |
| miR-1238 | Down in PCa & BPH vs Healthy | SASH1 (SAM & SH3 domain containing protein 1) | 33 |
| miR-1913 | Down in PCa vs BPH vs Healthy | HSPG2 (heparan sulphate proteoglycan 2) | 34 |
| miR-486-5p | Down in PCa vs BPH vs Healthy | CD40 (tumour necrosis factor receptor) | 35 |
| miR-1825 | Down in PCa vs BPH vs Healthy | DDR1 (discoidin domain receptor tyrosine kinase 1) | 36, 37, 38 |
| miR-484 | Down in PCa vs BPH vs Healthy | UBR5 (ubiquitin protein ligase E3 component n-recognin 5) | 39 |
| miR-483-5p | Up in PCa vs BPH & Healthy | Selenoprotein O | 40 |
Validation of MicroRNA Deregulation among Individual Prostate Cancer Samples using RT-qPCR
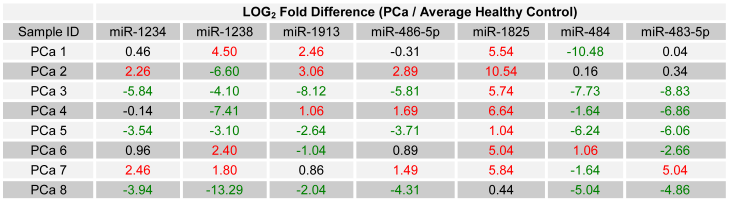
Seven of the selected miRNAs were, according to microarray data on pooled samples, deregulated in PCa with respect to the healthy control group. In order to evaluate those miRNA's potential as candidate biomarkers for PCa, the relative expression of each was examined in all individual PCa samples by using RT-qPCR. To allow for a comparison of expression levels between samples, the expression of each miRNA was normalized against each sample's own content of 5S ribosomal RNA. Relative expression between each PCa sample and the average expression of the healthy control group was then calculated as LOG2 fold change values using the following equation: LOG2 (2-∆Ct (target miRNA) PCa / 2-∆Ct (target miRNA) Healthy Control). For PCR data, an absolute LOG2 value of one or more was considered deregulated, while a value of less than one was considered minimally deregulated / unchanged. Table 4 lists the relative expression of each of the seven miRNAs, for each of the initially collected PCa samples and with respect to the average expression of the healthy control group.
LOG2 fold change in the expression of the 7 miRNA among PCa patients relative to average healthy expression. (Red - Two fold or more up-regulated, Green - Two fold or more down-regulated, and Black - Minimally Deregulated / Unchanged).
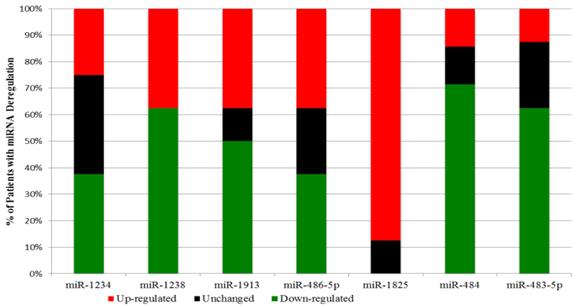
Interestingly a substantial majority of PCa samples expressed the same type of deregulation for a miRNA: miR-1825 and miR-484. MiR-1825 was up-regulated in seven out of eight PCa samples (88%); furthermore in the eighth PCa sample miR-1825 expression was unchanged with respect to healthy. PCR results showed that miR-484 was down-regulated in six out of the eight PCa samples (75%), up-regulated in one and unchanged in another. Figure 2 illustrates these percentages visually.
Percentage of the Initial PCa Samples with two fold or more deregulation of a microRNA.
Screening for Deregulation of miR-1825 and miR-484 in BPH Samples by RT-qPCR
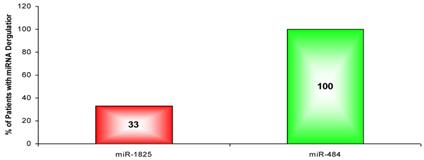
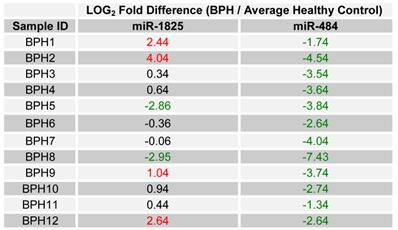
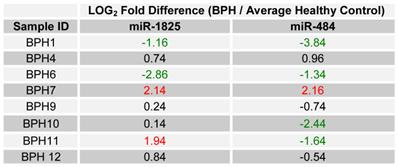
Since only miR-1825 and miR-484 showed consistent up- and down-regulation across a majority of PCa samples by PCR (88% and 75%, respectively), they were selected for further evaluation among BPH samples; a group of patients who are usually falsely identified as having PCa by PSA testing. Table 5 displays the LOG2 fold changes for the expression of miR-1825 and miR-484 among the initially collected BPH samples with respect to the average expression in the healthy control group. MiR-1825 was found to have variable expression between BPH samples. In particular miR-1825 was found to be up-regulated in 4 of the 12 samples or 33% of them, minimally deregulated or unchanged in 6 (50%) and down-regulated in 2 (17%). MiR-484 on the other hand was found to be two or more fold down-regulated in all of the initially collected BPH samples (100%). Figure 3 illustrates the percentage of initially collected BPH samples with up-regulation or miR-1825 and down-regulation of miR-484.
Percentage of BPH patients with two or more fold deregulation of miR-1825 or miR-484. (Red - Two fold or more up-regulated, Green - Two fold or more down-regulated).
LOG2 fold changes of the expression of miR-1825 & miR-484 among BPH patients relative to average healthy expression. (Red - Two fold or more up-regulated, Green - Two fold or more down-regulated, and Black - Minimally Deregulated).
Screening for the Status of miR-1825 and miR-484 in PCa Patients: Two Years Later
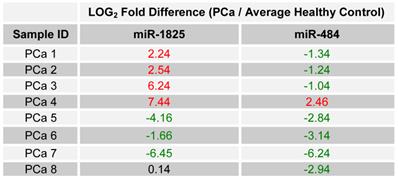
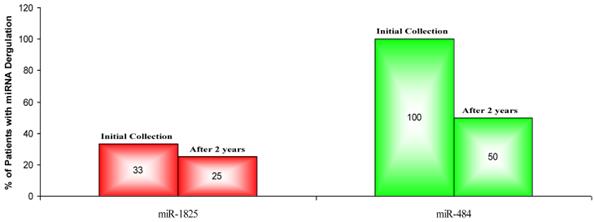
In order to validate the initial findings, miR-1825 and miR-484 were assessed for up- and down-regulation in urine samples that were collected two years from the initial collection and from the same individual PCa patients. Again, relative expression was examined by RT-qPCR and both transcripts were normalized against the intrinsic 5S-rRNA present in each sample. Relative expression between samples was then calculated as LOG2 fold change values according to the following equation: LOG2 (2-∆Ct (target miRNA) PCa / 2-∆Ct (target miRNA) Healthy Control). Table 6 lists the LOG2 fold change between each PCa sample that was collected after two years and the average for the original healthy control group, for both miR-1825 and miR-484. While miR-1825 was initially found to be two or more fold up-regulated in 88% of the PCa samples, after two years it was only up-regulated among 50% of them or in four of the eight. MiR-484 meanwhile, while initially found to be down-regulated in 75% of PCa samples, was after two years down-regulated in 88% of them or in seven out of eight. Figure 4 illustrates the percentage of PCa patients with up- and down-regulation of miR-1825 and miR-484 at each time point.
Percentage of PCa Patients with deregulation of miR-1825 or miR-484, initially and after two years. (Red - Two fold or more up-regulated, Green - Two fold or more down-regulated).
LOG2 fold changes of the expression of miR-1825 & miR-484 among PCa patients relative to average healthy expression after two years. (Red - Two fold or more up-regulated, Green - Two fold or more down-regulated, and Black - Minimally Deregulated).
Screening for the Status of miR-1825 and miR-484 in BPH Patients: Two Years Later
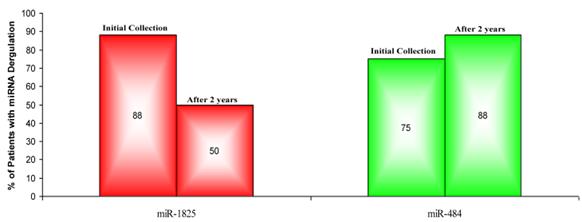
Since up- and down-regulation of miR-1825 and miR-484 was common to urine samples collected from individuals with PCa, including samples collected from the same cohort two years later, it was decided to assay their expression in BPH samples collected two years later, again by RT-qPCR. It should be noted that upon follow-up, only eight of the original twelve BPH patients participated. Table 7 lists the LOG2 fold change values for miR-1825 and miR-484 in the BPH samples that were collected after two years; expression is relative to the average expression of the healthy control group. MiR-1825 was found to be two or more fold up-regulated in two of the eight BPH samples or 25% of them, down from 33% previously. MiR-484 was found to be two or more fold down-regulated in four of the eight BPH patients (50%), down from 100% observed two years prior. Figure 5 illustrates the percentage of BPH patients with up- and down-regulation of miR-1825 and miR-484 at both time points.
Percentage of BPH patients with two or more fold deregulation of miR-1825 or miR-484; both initially and after two years. (Red - Two fold or more up-regulated, Green - Two fold or more down-regulated).
LOG2 fold changes of the expression of miR-1825 & miR-484 among BPH patients relative to average healthy expression after two years. (Red - Two fold or more up-regulated, Green - Two fold or more down-regulated, and Black - Minimally Deregulated).
Diagnostic Utility of miR-1825 and miR-484 for Diagnosing Prostate Cancer
To evaluate the potential of using aberrant expression of miR-1825 or miR-484 for diagnosing PCa the medical records, specifically PSA values and clinical diagnoses, were updated for all BPH patients as part of the two-year follow-up. It should be noted that all BPH patients were as a result diagnosed twice, both initially and after two years. Interestingly, during their second assessment it was discovered that four of the BPH patients had PCa (Table 8).
Diagnosing PCa by Assessing Deregulation of miR-1825 or miR-484 among BPH Samples.
| Initial Urine Collection | Urine Collection After 2 Years | |||||||
|---|---|---|---|---|---|---|---|---|
| Test Result for PCa | Clinical Diagnosis for PCa | Serum PSA Levels (ng/mL) | Test Result for PCa | Clinical Diagnosis for PCa | Serum PSA Levels (ng/mL) | |||
| miR-1825 | miR-484 | miR-1825 | miR-484 | |||||
| BPH1 | PCa | PCa | Healthy | 4.3 | Healthy | PCa | PCa | 3.9 |
| BPH2 | PCa | PCa | Healthy | 5.6 | N/A | N/A | N/A | N/A |
| BPH3 | Healthy | PCa | Healthy | 3.9 | N/A | N/A | N/A | N/A |
| BPH4 | Healthy | PCa | Healthy | 5.8 | Healthy | Healthy | Healthy | 9.6 |
| BPH5 | Healthy | PCa | Healthy | 2.4 | N/A | N/A | N/A | N/A |
| BPH6 | Healthy | PCa | Healthy | 5.1 | Healthy | PCa | Healthy | 4.8 |
| BPH7 | Healthy | PCa | Healthy | 6.9 | PCa | Healthy | Healthy | 4.2 |
| BPH8 | Healthy | PCa | Healthy | 3.7 | N/A | N/A | N/A | N/A |
| BPH9 | PCa | PCa | Healthy | 4.3 | Healthy | Healthy | PCa | 10.5 |
| BPH10 | Healthy | PCa | Healthy | 5.1 | Healthy | PCa | PCa | 9.8 |
| BPH11 | Healthy | PCa | Healthy | 7.4 | PCa | PCa | PCa | 4.2 |
| BPH12 | PCa | PCa | Healthy | 3.8 | Healthy | Healthy | Healthy | 9.4 |
By comparing putative diagnoses (of PCa) made using miRNA deregulation against the actual clinical diagnoses, the sensitivity and specificity for using miR-1825 up-regulation and miR-484 down-regulation (either separately or in tandem) for diagnosing PCa were determined. The following criteria were applied: patients with a positive clinical diagnosis and exhibiting deregulation of either miR-1825 or miR-484 or deregulation of both were considered true positives; patients with a positive diagnosis and not exhibiting deregulation of any of the miRNAs (either separately or in tandem) were considered false negatives; patients with a negative diagnosis and exhibiting deregulation of either miR-1825, miR-484 or deregulation of both were considered false positives; and finally, patients with a negative diagnosis and not exhibiting deregulation of either miR-1825 or miR-1825 or deregulation of both, were considered true negatives.
The above-mentioned criteria were applied to each sample that had a clinical diagnosis (including PCa samples), yielding the sensitivity and specificity values for diagnosing PCa. Using miR-1825 to diagnose PCa resulted in a sensitivity of 60% and a specificity of 69%, while using miR-484 to diagnose PCa resulted in a sensitivity of 80% and a specificity of 19%. Additionally, the sensitivity and specificity of using tandem deregulation of both microRNAs at the same time was 45% and 75%, respectively. Furthermore, the sensitivity and specificity of a panel, employing deregulation of both microRNAs as well as an abnormal PSA value (more than or equal to 4ng/mL) for detecting PCa was 40% and 81% respectively. Table 9 summarizes the sensitivity and specificity values for the various targets.
Diagnostic Utility of miR-1825 and miR-484 for Diagnosing PCa.
| Candidate Biomarker(s) | Sensitivity (%) | Specificity (%) |
|---|---|---|
| miR-1825 | 60 | 69 |
| miR-484 | 80 | 19 |
| miR-1825 and miR-484 | 45 | 75 |
| miR-1825/miR-484/PSA | 40 | 81 |
| PSA (Experimental/Literature) | 90/86 | 25/33 |
Discussion
MicroRNAs (miRNAs) are a class of short (~22nt), single stranded RNA molecules that function as post-transcriptional regulators of gene expression (17). MiRNAs can regulate a variety of important biological pathways, including: cellular proliferation, differentiation and apoptosis (41). MiRNAs have also been found to play a significant role in carcinogenesis (18). They do so via their ability to function as regulators of tumour suppressors and oncogenes (19). As a result of their regulatory nature, patterns of miRNA expression appear to be tissue and even tumour specific (42). Moreover, profiling of miRNA expression patterns was shown to be more useful than the equivalent mRNA profiles for characterizing poorly differentiated tumours (21). As such, miRNA expression “signatures” are expected to offer serious potential for diagnosing and prognosing cancers of any provenance (20, 21).
Understanding the pathogenesis of viral-associated HCC is important for developing effective means of prevention and treatment of this highly malignant form of cancer (25). Currently, the identification of a non-invasive biological biomarker that can be used to screen high-risk patients is urgently needed to enhance HCC detection, resulting in earlier intervention and increasing the probability of successful treatment. Recent studies have already identified several miRNAs whose expression is deregulated in viral hepatitis infections and in HCC (29). Although important information was gathered about the hepatocarcinogenic effect of these deregulated miRNAs and the viral-host interactions that lead to the viral pathogenic effect, none of these studies evaluated the potential of using deregulated miRNA expression patterns to predict the development and progression of HCC among high-risk HCV infected patients.
The aim of this study was to investigate the potential for using deregulation of urinary miRNAs in order to accurately detect PCa among BPH patients. Profiling of pooled miRNA expression revealed that several miRNAs were differentially expressed between PCa, BPH and the healthy control group. Importantly, seventeen miRNAs were identified as being significantly deregulated among the three groups. In order to narrow the scope of the study, TargetScan and MiRanda databases were utilized for the identification of putative targets to the differentially expressed microRNAs, for the purpose of determining how each microRNA might be involved with cancer (23). This step revealed that microRNAs 1234, 1238, 1913, 489-5p, 1825, 484 and 483-5p were possibly playing a definable role in the development, progression or suppression of PCa.
Interestingly, miR-1234 (which was found to be down-regulated in PCa versus the pooled healthy control) was found to potentially regulate the Disabled homolog 2-interaction protein (DAB2IP). DAB2IP is thought to be a tumour suppressor gene; and is noticeably down-regulated in a number of PCa cell lines (30, 31, 32). A single nucleotide polymorphic variant of DAB2IP (rs1571801) is reportedly associated with an aggressive phenotype in PCa (43). Aberrant methylation of the DAB2IP promoter region has also been reported as a reason for its transcriptional silencing in PCa and hence progression of the disease (31).
Curiously, in this study's pooled data miR-1234 was observed to be down-regulated in PCa relative to the healthy control, as opposed to up-regulated as might have been expected if miR-1234 was acting to silence the translation of DAB2IP, which appears to be common in some PCas. When expression levels were assayed by RT-qPCR among individual PCa samples, 25% actually showed up-regulation relative to the average healthy level. This is of course possible since the previously pooled samples represented an average signal for all patients. The up-regulation of miR-1234 that was observed among individual cancer samples might have been responsible for the down-regulation of DAB2IP. In 2003 Chen et al. (31) reported that down-regulation of DAB2IP in PCa was the result of aberrant methylation of the DAB2IP promoter region. Here it is proposed that the up-regulation of miR-1234 might be an alternative mechanism for the down-regulation DAB2IP.
Of some of the other deregulated microRNAs, miRs 1238 and 1913 might possibly regulate: SAM/SH3 domain-containing protein 1 (SASH1) and Heparan Sulfate Proteoglycan 2 (HSPG2), respectively, whereas miR-483-5p is predicted to target Selenoprotein-O and miR-486-5p, tumour necrosis factor receptor (CD40). Of these targets, SASH1 and HSPG2 are commonly affected in various cancers.
SASH1 has previously been reported as a candidate tumour suppressor gene, common to breast cancer (33). Down-regulation of SASH1 has also been reported in aggressive and metastatic cancers, such that its down-regulation was prognostic of poor survival among breast cancer patients (33). Heparan Sulphate Proteoglycan-2 (HSPG2) on the other hand has been implicated in a variety of processes, including: maintenance of epithelial basement membrane integrity, growth factor binding and signaling, cellular differentiation, angiogenesis, neuro-muscular function and bone development. HSPG2 can bind to several other basement membrane proteins including: laminin-1, fibronectin, nidogen, PRELP, and collagen IV via its core protein or heparin sulphate side-chains (44, 45). The loss of HSPG2 and associated basement membrane structure is sometimes indicative of cancer, as can be the case in some invasive breast cancers (34).
In this study both miR-1238 and miR-1913 were found by PCR, to be over-expressed in 38% of the initial PCa samples. Their up-regulation therefore might potentially have been causing the down-regulation of their putative targets. This mechanism might help explain the observations of lower than normal levels of SASH1 and HSPG2, as can be observed in some cancers (33, 34).
Another microRNA observed as deregulated by microarray, miR-1825, putatively targets member-1 of the Discoidin Domain family of Receptors (DDR1). This miRNA was identified as being up-regulated in 88% of the initial PCa samples, a seemingly common event. Over-expression of DDR1 has been reported in many epithelial-cell cancers; DDR1 therefore likely plays an important role in tumourigenesis (36, 37). DDR1 over-expression was reported to be prognostic of poor survival in several cohorts of patients with brain, breast, or lung cancers (38). Since DDR1 is a putative oncogene, it is proposed that miR-1825 might function as a tumor-suppressor by normally or in response to cancer, inhibiting DDR1's translation. Since a majority of PCa samples (88%) showed up-regulation of miR-1825, it is possible that these cancers might have developed independently of DDR1. It is therefore proposed that deregulation of miR-1825 might be a potential mechanism for the deregulation of DDR1, an event common to some cancers.
MiR-484, another miRNA identified by microarray as being deregulated in PCa may regulate the expression of the E3 ubiquitin-protein ligase (UBR5). UBR5 is thought to be involved with DNA repair (46) and has even reportedly been associated with cancer progression (39). Clancy et al. reported on the over-expression of a potentially mutated version of UBR5 found in breast and ovarian cancers and whose deregulation was cited as a possible cause of malignant progression (39). Here RT-qPCR data show a down-regulation in miR-484 among 75% of PCa patients. This down-regulation might even cause the over-expression of miR-484's putative target, UBR5, possibly resulting in cancer progression. It is therefore being proposed that miR-484 might function as a tumor-suppressor whereby its expression controls progression via the regulation of genes, such as UBR5, that have already been potentially associated with cancer progression (39).
Based on the aforementioned trends regarding the observed deregulation of miRNAs among individual PCa samples, two of the seven miRNAs were selected for further evaluation among BPH samples. Because miR-1825 was observed to be up-regulated in 88% of the initial PCa samples and because miR-484 was observed to be down-regulated in 75%, it was thought that their deregulation might have been indicative of PCa. In support of this supposition, the putative target for miR-1825 is DDR1, a potential oncogene, while miR-484 potentially regulates UBR5, another putative oncogene. Since BPH is commonly misdiagnosed as PCa (12) and leads to many unnecessary biopsies, and because first time prostate biopsies can miss cancer approximately 20% of the time (47, 48), it became important to evaluate any potential biomarker in samples collected from BPH patients.
Using RT-qPCR, the levels of both miR-1825 and miR-484 were evaluated in all twelve urine samples that were initially collected from the BPH cohort; none of whom had at that time yet been diagnosed with PCa. Data showed that (similar to the PCa samples) miR-484 was down-regulated in the majority of the initially collected BPH samples. Interestingly however, miR-1825 was only up-regulated in 25% of them (four BPH samples). These numbers coupled with the fact that prostate biopsy can occasionally miss PCa (47, 48) suggest that some of the BPH patients might have possibly had or been in the process of developing PCa; alternatively it may have been indicative of a lack of specificity. In order to distinguish between these possibilities, the medical records for many of the BPH patients were updated two years after the initial collection; as well additional urine samples were also collected.
Upon assessment of miRNA expression among those newly collected BPH samples, miR-1845 was only observed to be up-regulated in 25% of the cohort. In addition; miR-484 was also observed to be down-regulated, though this time in only 50% of BPH samples as opposed to 100% of them. Importantly, coupled to these new expression levels, the updated medical records indicated that four of the eight BPH patients had been diagnosed with PCa within the last two years.
By combining the original diagnoses and expression levels with the updated levels and medical records, the ability of miR-1845 and/or miR-484 deregulation to predict PCa was investigated. Towards this, the sensitivity and specificity of using miR-1825 up-regulation and/or miR-484 down-regulation to detect PCa was calculated. This calculation revealed that deregulation of miR-1825 was 60% sensitive and 69% specific for detecting PCa, whereas miR-484 deregulation was 80% sensitive but only 19% specific. When both were combined, the sensitivity and specificity was 45% and 75%, respectively. And finally, the sensitivity and specificity for a panel including: miR-1825, miR-484 and PSA (at a 4.0ng/mL cutoff) were 40% and 81%, respectively.
Despite the marginal diagnostic qualities of these microRNAs, the sensitivity of miR-484 was on par with - and the specificity of all except miR-484 were superior to - the literature reported values for PSA testing (sensitivity of 86% and specificity of 33% (12). It is therefore proposed that these signatures might (with further validation) ultimately be useful for detecting PCa.
Competing Interests
The authors have declared that no competing interest exists.
References
1. Jemal A, Bray F, Center MM, Ferlay J, Ward E, Forman D. Global cancer statistics. CA: Cancer J Clin. 2011;61:69-90
2. Howlader N, Noone AM, Krapcho M, Neyman N, Aminou R, Altekruse SF, Kosary CL, Ruhl J, Tatalovich Z, Cho H, Mariotto A, Eisner MP, Lewis DR, Chen HS, Feuer EJ, Cronin KA. SEER Cancer Statistics Review, 1975-2009 (Vintage 2009 Populations), Nat Cancer Institute. Bethesda, MD. http://seer.cancer.gov/csr/1975_2009_pops09/
3. Boyle P, Severi G, Giles GG. The epidemiology of prostate cancer. Urology Clin North Am. 2003;30:209-217
4. Yin M, Bastacky S, Chandran U, Becich MJ, Dhir R. Prevalence of incidental prostate cancer in the general population: a study of healthy organ donors. The J of Urology. 2008;179:892-895
5. Dunn JE. Cancer epidemiology in populations of the United States—with emphasis on Hawaii and California—and Japan. Cancer Res. 1975;35(11 Pt. 2):3240-3245
6. Mettlin C, Lee F, Drago J, Murphy GP. The American Cancer Society National Prostate Cancer Detection Project. Findings on the detection of early prostate cancer in 2425 men. Cancer. 1991;67:2949-2958
7. Catalona WJ, Smith DS, Ratliff TL, Dodds KM, Coplen DE, Yuan JJ, Petros JA, Andriole GL. Measurement of prostate- specific antigen in serum as a screening test for prostate cancer. N Engl J Med. 1991;324:1156-1161
8. Carter HB, Pearson JD, Metter EJ, Brant LJ, Chan DW, Andres R, Fozard JL, Walsh PC. Longitudinal evaluation of prostate-specific antigen levels in men with and without prostate disease. The J of the American Med Association. 1992;267(16):2215-2220
9. Stamey TA, Yang N, Hay AR, McNeal JE, Freiha FS, Redwine EE. Prostate-specific antigen as a serum marker for adenocarcinoma of the prostate. N Engl J Med. 1987;317:909-916
10. Rao AR, Motiwala HG, Karim OM. The discovery of prostate- specific antigen. BJU Int. 2008;101:5-10
11. Woolf SH. The accuracy and effectiveness of routine population screening with mammography, prostate specific antigen, and prenatal ultrasound: a review of published scientific evidence. Int J Technol Assess Health Care. 2001;3:275-304
12. Hoffman RM, Gilliland FD, Adams-Cameron M, Hunt WC, Key CR. Prostate-specific antigen testing accuracy in community practice. BMC Fam Pract. 2002;3:19
13. Oh WK, Hurwitz M, Richie JP, D'Amico AV, Kantoff PW. Neoplasms of the Prostate. In: (ed.) Kufe DW. et al. Cancer Medicine. Hamilton, Canada: BC Decker Inc. 2003
14. Chou R, Jennifer MC, Tracy D, Christina B, Ian B, Rongwei F, Ken G, Helen CK, Clarence L, Ashley MJ, Bruin R, Kenneth L. Screening for prostate cancer: a review of the evidence for the U.S. Preventive Services Task Force. Annals of internal medicine. 2011;155(11):762-771
15. Pisitkun T, Johnstone R, Knepper MA. Discovery of urinary biomarkers. Mol Cell Proteomics. 2006;5:1760-1771
16. Truong M, Yang B, Jarrard D. Towards the Detection of Prostate Cancer in Urine: a Critical Analysis. The J of Urology. 2012 PrePub
17. Bartel DP. MicroRNAs: target recognition and regulatory functions. Cell. 2009;136(2):215-233
18. Cho WC. OncomiRs: the discovery and progress of microRNAs in cancers. Mol Cancer. 2007;6:60-66
19. Esquela-Kerscher A, Slack FJ. Oncomirs-microRNAs with a role in cancer. Nat Rev Cancer. 2006;6:259-269
20. Yanaihara N, Caplen N, Bowman E, Seike M, Kumamoto K, Yi M, Stephens RM, Okamoto A, Yokota J, Tanaka T, Calin GA, Liu CG, Croce CM, Harris CC. Unique microRNA signature in lung cancer diagnosis and prognosis. Cancer Cell. 2006;9:189-198
21. Lu J, Getz G, Miska EA, Alvarez-Saavedra E, Lamb J, Peck D, Sweet-Cordero A, Ebert BL, Mak RH, Ferrando AA, Downing JR, Jacks T, Horvitz HR, Golub TR. MicroRNA expression profiles classify human cancers. Nature. 2005;435:834-838
22. Zhang B, Pan X, Cobbv GP, Anderson TA. microRNAs as oncogenes and tumor suppressors. Dev Biol. 2007;302:1-12
23. Lewis BP, Shih IH, Jones-Rhoades MW, Bartel DP, Burge CB. Prediction of mammalian microRNA targets. Cell. 2003;115:787-798
24. Hammond SM. MicroRNAs as oncogenes. Curr Opin Genet Dev. 2006;16:4-9
25. Calin GA, Sevignani C, Dan Dumitru C, Hyslop T, Noch E, Yendamuri S, Shimizu M, Rattan S, Bullrich F, Negrini M, Croce CM. Human microRNA genes are frequently located at fragile sites and genomic regions involved in cancers. Proc Nal Acad Sci USA. 2004;101:2999-3004
26. Johnson CD, Esquela-Kerscher A, Stefani G, Byrom M, Kelnar K, Ovcharenko D, Wilson M, Wang X, Shelton J, Shingara J, Chin L, Brown D, Slack FJ. (2007). The let-7 microRNA represses cell proliferation pathways in human cells. Cancer Res. 2007;67(16):7713-7722
27. Coppola V, De Maria R, Bonci D. MicroRNAs and prostate cancer. Endocrine-Related Cancer. 2010;17(1):F1-F17
28. Livak KJ, Schmittgen TD. Analysis of relative gene expression data using real-time quantitative PCR and the 2(-Delta Delta C(T)) Method. Methods. 2001;25(4):402-408
29. Griffiths-Jones S, Grocock RJ, van Dongen S, Bateman A, Enright AJ. miRBase: microRNA sequences, targets and gene nomenclature. Nucleic Acids Res. 2006;34:D140-D144
30. Chen H, Pong RC, Wang Z, Hsieh JT. Differential regulation of the human gene DAB2IP in normal and malignant prostatic epithelia: cloning and characterization. Genomics. 2002;79:573-581
31. Chen H, Toyooka S, Gazdar AF, Hsieh JT. Epigenetic regulation of a novel tumour suppressor gene (hDAB2IP) in prostate cancer cell lines. J Biol Chem. 2003;278:3121-3130
32. Wang Z, Tseng CP, Pong RC, Chen H, McConnell JD, Navone N, Hsieh JT. The mechanism of growth-inhibitory effect of DOC-2/DAB2 in prostate cancer. Characterization of a novel GTPase-activating protein associated with N-terminal domain of DOC-2/DAB2. J Biol Chem. 2002;277:12622-12631
33. Zeller C, Hinzmann B, Seitz S, Prokoph H, Burkhard-Goettges E, Fischer J, Jandrig B, Schwarz LE, Rosenthal A, Scherneck S.SASH1. a candidate tumor suppressor gene on chromosome 6q24.3 is downregulated in breast cancer. Oncogene. 2003;22:2972-2983
34. Nerlich AG, Wiest I, Wagner E, Sauer U, Schleicher ED. Gene expression and protein deposition of major basement membrane components and TGF-beta 1 in human breast cancer. Anticancer Res. 1997;17(6D):4443-4449
35. Palmer DH, Hussain SA, Ganesan R, Cooke PW, Wallace DM, Young LS, James ND. CD40 expression in prostate cancer: a potential diagnostic and therapeutic molecule. Oncology reports. 2004;12(4):679-682
36. Weiner HL, Huang H, Zagzag D, Boyce H, Lichtenbaum R, Ziff EB. Consistent and selective expression of the discoidin domain receptor-1 tyrosine kinase in human brain tumors. Neurosurgery. 2000;47:1400-1409
37. Rikova K, Guo A, Zeng Q, Possemato A, Yu J, Haack H, Nardone J, Lee K, Reeves C, Li Y, Hu Y, Tan Z, Stokes M, Sullivan L, Mitchell J, Wetzel R, Macneill J, Ren JM, Yuan J, Bakalarski CE, Villen J, Kornhauser JM, Smith B, Li D, Zhou X, Gygi SP, Gu TL, Polakiewicz RD, Rush J, Comb MJ. Global survey of phosphotyrosine signaling identifies oncogenic kinases in lung cancer. Cell. 2007;131:1190-1203
38. Yang SH, Baek HA, Lee HJ, Park HS, Jang KY, Kang MJ, Lee DG, Lee YC, Moon WS, Chung MJ. Discoidin domain receptor 1 is associated with poor prognosis of non-small cell lung carcinomas. Oncol Rep. 2010;24(2):311-319
39. Clancy JL, Henderson MJ, Russell AJ, Anderson DW, Bova RJ, Campbell IG, Choong DY, Macdonald GA, Mann GJ, Nolan T, Brady G, Olopade OI, Woollatt E, Davies MJ, Segara D, Hacker NF, Henshall SM, Sutherland RL, Watts CK. EDD, the human orthologue of the hyperplastic discs tumour suppressor gene, is amplified and overexpressed in cancer. Oncogene. 2003;22:5070-5081
40. Diwadkar-Navsariwala V, Prins GS, Swanson SM, Birch LA, Ray VH, Hedayat S, Lantvit DL, Diamond AM. Selenoprotein deficiency accelerates prostate carcinogenesis in a transgenic model. Proceedings of the Nal Academy of Sciences of the United States of America. 2006;103(21):8179-8184
41. He L, Hannon GJ. MicroRNAs: small RNAs with a big role in gene regulation. Nature Reviews: Genetics. 2004;5(7):522-531
42. Lagos-Quintana M, Rauhut R, Yalcin A, Meyer J, Lendeckel W, Tuschl T. Identification of tissue-specific microRNAs from mouse. Curr biol. 2002;12(9):735-739
43. Duggan D, Zheng SL, Knowlton M, Benitez D, Dimitrov L, Wiklund F, Robbins C, Isaacs SD, Cheng Y, Li G, Sun J, Chang BL, Marovich L, Wiley KE, Bälter K, Stattin P, Adami HO, Gielzak M, Yan G, Sauvageot J, Liu W, Kim JW, Bleecker ER, Meyers DA, Trock BJ, Partin AW, Walsh PC, Isaacs WB, Grönberg H, Xu J, Carpten JD. Two genome-wide association studies of aggressive prostate cancer implicate putative prostate tumor suppressor gene DAB2IP. J Nat Cancer Inst. 2007;99(24):1836-1844
44. Sasaki T, Costell M, Mann K, Timpl R. Inhibition of glycosaminoglycan modification of perlecan domain I by site-directed mutagenesis changes protease sensitivity and laminin-1 binding activity. FEBS Lett. 1998;435(2-3):169-172
45. Bengtsson E, Mörgelin M, Sasaki T, Timpl R, Heinegård D, Aspberg A. The leucine-rich repeat protein PRELP binds perlecan and collagens and may function as a basement membrane anchor. J Biol Chem. 2002;277(17):15061-15068
46. Henderson MJ, Munoz MA, Saunders DN, Clancy JL, Russell AJ, Williams B, Pappin D, Khanna KK, Jackson SP, Sutherland RL, Watts CK. EDD Mediates DNA Damage-induced Activation of CHK2. J. Biol. Chem. 2006;281:39990-40000
47. Shariat SF, Roehrborn CG. Using biopsy to detect prostate cancer. Reviews in Urology. 2008;10(4):262-280
48. Presti JC. Prostate biopsy: current status and limitations. Reviews in Urology. 2007;9(3):93-98
Author contact
![]() Corresponding author: Moemen AK Abdalla, Department of Biochemistry, Faculty of Science, Alexandria University, Egypt. E-mail: demerdashmcom.
Corresponding author: Moemen AK Abdalla, Department of Biochemistry, Faculty of Science, Alexandria University, Egypt. E-mail: demerdashmcom.