Impact Factor ISSN: 1837-9664

 Global reach, higher impact
J Cancer 2013; 4(9):755-763. doi:10.7150/jca.7813 This issue Cite
Research Paper
Novel Phenotypic Fluorescent Three-Dimensional Co-Culture Platforms for Recapitulating Tumor in vivo Progression and for Personalized Therapy
Changge Fang1 ![]() , Yan-Gao Man2, Frank Cuttitta3, William Stetler-Stevenson4, David Salomon5, Andrew Mazar6, Piotr Kulesza7, Steve Rosen8, Itzhak Avital2, Alexander Stojadinovic2, Anahid Jewett9, Bin Jiang10, James Mulshine11
, Yan-Gao Man2, Frank Cuttitta3, William Stetler-Stevenson4, David Salomon5, Andrew Mazar6, Piotr Kulesza7, Steve Rosen8, Itzhak Avital2, Alexander Stojadinovic2, Anahid Jewett9, Bin Jiang10, James Mulshine11
1. Advanced Personalized Diagnostics, 6006 Bangor Drive, Alexandria, VA 22303, USA
2. Bon Secours Cancer Institute, Bon Secours Health System, Richmond, VA, USA
3. Scientific Segues, LLC, Adamstown, MD 21710, USA
4. Extracellular Matrix Pathology Section, Center for Cancer Research, National Cancer Institute, ATC, 8717 Grovemont Circle, Rm. 115D, Bethesda, MD 20892-4605 USA
5. Tumor Growth Factor Section, Laboratory of Cancer Prevention, Center for Cancer Research, NCI-Frederick, Frederick, MD 2170-1201, USA
6. Chemistry of Life Processes Institute, Northwestern University, Chicago, IL 60611, USA
7. Pathology Core Facility, Northwestern University, Chicago, IL 60611 USA
8. Robert H. Lurie Comprehensive Cancer Center, Northwestern University Feinberg School of Medicine, Chicago, IL 60611, USA
9. Tumor Immunology Laboratory, Division of Oral Biology and Medicine, UCLA School of Dentistry and Medicine, Los Angeles, CA, USA
10. Surgery and Medicine, University of Chinese Medicine, The Third Affiliated Hospital of Nanjing University, Nanjing, PRC
11. Rush Medical College, Rush University, 1735 W. Harrison St., Cohn Research Bldg., Chicago, IL 60612-3823, USA
Received 2013-10-3; Accepted 2013-10-19; Published 2013-12-1
Abstract
Because three-dimensional (3D) in vitro models are more accurate than 2D cell culture models and faster and cheaper than animal models, they have become a prospective trend in the biomedical and pharmaceutical fields, especially for personalized and targeted therapies. Because appropriate 3D models can be customized to mimic the in vivo microenvironment wherein various cell populations grow within an intricate but well organized extracellular matrix (ECM), they can accurately recapitulate physiological and pathophysiological progressions. The majority of cancers are carcinomas, which originate from epithelial cells, and dynamically interact with non-malignant cells including stromal cells (fibroblasts), vascular cells (endothelial cells and pericytes), immune cells (macrophages and mast cells), and the ECM. Employing a tumor monoclonal colony, tumor xenograft or patient cancer biopsy into an in vivo-like microenvironment, the native signaling pathways, cell-cell and cell-matrix interactions, and cell phenotypes are preserved and our fluorescent phenotypic 3D co-culture platforms can then accurately recapitulate the tumor in vivo scenario including tumor induced angiogenesis, tumor growth, and metastasis.
In this paper, we describe a robust and standardized method to co-culture a tumor colony or biopsy with different cell populations, e.g., endothelial cells, immune cells, pericytes, etc. The procedures for recovering cells from the co-culture for molecular analyses, imaging, and analyzing are also described. We selected ECM solubilized extract derived from Engelbreth-Holm-Swam sarcoma cells. Because the 3D co-culture platforms can provide drug chemosensitivity data within 9 days that is equivalent to the results generated from mouse tumor xenograft models in 50 days, the 3D co-culture platforms are more accurate, efficient, and cost-effective and may replace animal models in the near future to predict drug efficacy, personalize therapies, prevent drug resistance, and improve the quality of life.
Keywords: 3D co-culture platform, in vivo, tumor
MATERIALS
- Engelbreth-Holm-Swarm extracellular matrix extract, growth factor-reduced (Geltrex, Invitrogen)
- Bovine serum albumin, cell culture tested (BSA, Sigma)
- pAmCyan1-C1 (pAmCyan) and pDsRed-Express-C1 (pDsRed 2) (Clontech) and Amaxa pMAX-YFP (pYFP, Lonza)
- Nucleofector solution (Lonza)
- RPMI 1640, DMEM, (Gibco)
- EBM2 medium and SingleQuots supplement kits (Lonza)
- Geneticin (Invitrogen)
- Anti-Anti (Invitrogen)
- ethylenediaminetetraacetic acid (EDTA, Sigma),
- TypLE Express (Invitrogen)
- FBS (Gibco)
- Agarose (SeaPaque, FMC)
- HEPES (Sigma),
- O.C.T. (Tissue-Tek)
- Glutaraldehyde (Sigma)
- Mounting medium without DAPI (Dako)
Box 1 Innovation and Clinical Impact
Here, we present novel and advanced phenotypic fluorescent 3D co-culture platforms to closely mimic the tumor in vivo microenvironment and progression in action and in real time, predict drug efficacy, personalize therapies, prevent drug resistance, and improve the quality of life [1]. In the clinical setting, because cumulative toxicity and/or drug resistance severely limits the chemotherapy after first-line regimens, selecting the most effective first-line therapy for a given patient is extremely important especially for an advanced disease [17, 18]. It is urgent and rational for physicians to have a reliable and rapid model to timely: 1) personalize drug regimens for individual patients to provide the most effective chemotherapeutic in order to eliminate non-responsive, toxic, and futile treatment; and 2) adjust the drug regimen by monitoring the drug effectiveness during the treatment period. The continuous monitoring of cancerous tumors to adjust the treatment protocol should reduce the need for prolonged treatment, minimize metastasis, and avoid the adverse drug resistance and the side effects typically associated with current chemotherapy treatments.
Using robotic sampling, automated imaging and analyzing technology, the 3D co-culture platforms can be adapted to a high-throughput chemosensitivity screening scale. Acting as an avatar for a given cancer patient to test all the of available regimens, the 3D co-culture platforms will be more accurate, efficient, and cost-effective than current approaches, such as two-dimensional cell culture assays, molecular biomarker assays, single cell population 3D models, individual cell mixture 3D models, and patient derived xenograft (PDX) models. With equivalent chemosensitivity screening data, the proposed 3D co-culture platforms are up to 40 times faster than PDX models [17, 43-47]. The initial and follow-up chemosensitivity screenings will provide oncologists with comprehensive and effective chemotherapy regimens to provide optimal treatment to minimize metastatic incidence and maximize overall survival rates. Utilizing microarray technology combined with FACS sorting and micro-laser dissection technology [60], the molecular markers and pathways can be identified to classify subgroups of cancers. Additionally, cancers responding to similar regimens can be classified into subgroups to identify clear molecular markers and pathways for a more timely and accurate diagnosis.
In summary, the 3D co-culture platforms will enable oncologists to make a more accurate prognosis to provide efficient and cost-effective chemotherapy to cancer patients, as well as aiding the development of novel and more effective drugs, which will ultimately minimize or eliminate reoccurrence and increase overall survival rates.
PROCEDURE
Establishing Stable Fluorescent Cell Lines
- Harvest cells at 70~80% confluence;
- Suspend 2~3 million cells in 100µl nucleofector solution (Lonza) with 2µg plasmids and then transfect them according to the protocol (Lonza);
- Select the transfected cells using 300~500µg/ml of geneticine (G418);
- Enrich the brightest fluorescent cells by using flow cytometer ARIA II (BD); and
- Maintain fluorescent cell lines with 50µg/ml G418 for a long-term culture.
Notes: To achieve the best transfection results, refer to the list of optimal transfection programs for certain cell lines on the Lonza website. For those not listed, optimization of transfection parameters is necessary. Frequently check the fluorescence brightness to determine if further enrichment is needed.
Box 2 Multi-fluorescent cells are easily identified from each other, provide time-efficient and cost-effective 3D co-culture platforms, and are suitable for high-throughput performance (Figure 2)
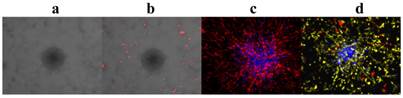
Unlike most co-culture models wherein cells have to be stained at the end-point for observation, by incorporating multi-colored cell populations that stably express distinct fluorescent proteins, individual cell populations in our novel phenotypic fluorescent 3D co-culture platforms are easily differentiated from each another in action and in real time. More importantly, it is time-efficient, cost-effective, and easily adapted for a high-throughput scale.
Fluorescence is the most convenient tool to observe and identify co-cultured cell populations in action and in real time. (a)-(d), 3D z-stack rendered confocal images of tumor monoclonal spheroids with other cell populations in our 3D co-culture platforms after 4 days in culture. (a), cells without fluorescent protein expression; the tumor spheroid is in the center and surrounded by endothelial cells. (b), two cell populations in co-culture with a tumor spheroid without fluorescence; the endothelial cells are red. (c), endothelial cells (red) and a tumor spheroid (blue) were co-cultured. (d), endothelial cells (yellow), pericytes (red), and a tumor spheroid (blue) were co-cultured.
Tumor Spheroids
Tumor spheroid colonies are prepared according to the following modified protocol based on Hamburger et al. [42].
- Use sterile 2% agarose to make a final concentration of 1% agarose with 20% FBS, 2X Anti-Anti, and 1X RPMI 1640;
- Add 2ml of the mixture to each well of a 6-well plate and set aside to solidify for 20 minutes;
- Harvest tumor cells at approximately 70% confluence and suspend them at 1500 cells/ml in 0.22% ~ 0.25% of agarose, 2X Anti-Anti, 20% FBS, and 1X RPMI 1640;
- Add 3ml of the cell suspension to each well of the 6-well plate with a solidified layer of 1% agarose and set aside to solidify for 20 minutes;
- Incubate the cultures at 100% humidity for 14-20 days;
- Harvest well-formed colonies and wash them 3x in PBS, pH 7.4, to get rid of the agarose residue;
- Suspend the colonies in PBS with 1% glucose, 0.3mM EDTA, 0.5 % BSA, 20mM HEPES, and 1X Anti-Anti; and
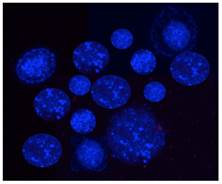
- Select colonies of similar sizes (~100μm, Figure 3) using a microdispenser (Drummond) and an Olympus inverted fluorescent microscope (Olympus IX70) for our 3D co-culture platforms.
Fluorescent monoclonal tumor cell spheroids used for the 3D co-culture platforms. Tumor cells stably express AmCyan fluorescent proteins.
Notes: Although low-melting temperature SeaPlaque agarose is preferred, other low-melting temperature agarose also works well to generate tumor cell colonies. The tumor cell concentration is critical to obtain nicely formed monoclonal tumor cell colonies. Ideally, cell concentration is around 1000 ~ 1500 cells/ml. The monoclonal tumor colony, unlike tumor spheroids compacted from multiple cells with loose constructions, is tightly formed from a single cell and will not break apart during the washing process.
Box 3 Tumor cell monoclonal spheroids are crucial to mimic the tumor in vivo features in 3D models
Human beings may carry microscopic in situ tumors without suffering any sequelae [6, 7]. These tiny tumors are generally dormant and need to be triggered by additional signals to grow [6]. Tumor spheroids (<500μm) and dormant microscopic tumors (~200μm) in vivo have similar features of actively proliferating cells in the peripheral zone and quiescent cells in the inner zone [8, 9]. As they increase in size, these spheroids develop necrotic, nutrient-deprived, and hypoxic centers, which mimic the native scenarios of tumor microregions in vivo [9, 19]. Many studies have shown that 3D cell cultures recapitulate the in vivo native scenarios of cellular heterogeneity, nutrient and oxygen gradients, cell-cell interactions, matrix deposition, gene profiling as well as signaling pathways better than 2D cell-based assays. Presently, in vitro 3D models use perfused organ/tissue explants [20-23], liquid overlay cultures [24-29], spontaneous cell aggregation models [11, 30-41], monoclonal clonogenic agar assays [1, 42], hanging drops [51, 52], polyethyleneimine linker methods [53], spinner flasks [54], rotary cell culture systems [55], scaffold models [56-59], poly-2-hydocyethy methacrylate (poly-Hema)-coated plates [61], and individual single cell mixture models that include microchannel or nanofiber [62-65] co-cultures. Among these 3D models, the tumor spheroid models are the most widely used. Cells from established tumor cell lines become heterogeneous over time in culture [10, 66-68], while tumors in vivo are monoclonal growths [69], so neither multiple cell compacted tumor spheroids nor individual cell mixtures recapitulate tumor monoclonality in vivo. However, our novel 3D co-culture platforms incorporate monoclonal tumor colonies (~100μm) that represent the tumor in vivo monoclonal feature. See Table 1 for a comparison of different cell culture models.
A Comparison of different tumor cell culture models.
| Models | Liquid overlay models | Scaffold models | Spontaneous tumor spheroid, monoclonal spheroid, and hanging drops models | Perfused organ or explants | Phenotypic fluorescent 3D co-culture models |
|---|---|---|---|---|---|
| Co-cultures | - | +/- | +/- | + | + |
| Mimicking tumor in vivo microenvironment | - | +/- | +/- | + | + |
| Maintaining cell in vivo morphology or phenotype | - | + | + | + | + |
| Preserving cell in vivo gene/protein profiling | +/- | +/- | +/- | + | + |
| Preserving cell in vivo signaling pathways | +/- | +/- | +/- | + | + |
| Clinical relevance | Very low | Low | Low to medium | Medium | Very high |
| Recapitulating tumor in vivo whole progression events: angiogenesis, tumor growth, tumor metastasis | - | - | +/- | + | + |
| Observing tumor progression in action and in real time | - | - | +/- | + | + |
| Gene analysis for individual cell populations if co-cultured | - | - | - | - | + |
| Personalize therapy | - | - | - | +/- | + |
| Predict drug resistance | - | - | - | +/- | + |
| High throughput screening adaptability | + | + | + | - | + |
Xenograft Biopsy
The tumor nude mouse xenograft experiments have been performed under the supervision and guidelines of the NIH Institutional Animal Care and Use Committee.
- Inject 1 X 10⁶ or 1X 10⁷ tumor cells subcutaneously in the hind flank of a nude mouse;
- Dissect the tumor xenografts when they reach about 1000mm3 and store them in 50ml tubes with RPMI 1640 medium supplemented with 10% FBS, 1% glucose, and 4X Anti-Anti;
- Rinse the xenografts 3x in PBS and 3x in 70% ethanol (Figure 4); and
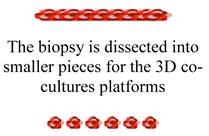
- Prepare a core biopsy using a biopsy punch (Miltex) and place it in a 100cm petri dish (Corning). Using a disposable scalpel (Feather Safety Razor), the core biopsy is dissected for the 3D co-cultures. 1 mm of both ends and the center of the biopsy tissue are carefully collected and separately transferred into a 4-well plate (Nunc). A drop of PBS is added to the samples to keep them moist. Using a disposable scalpel, each section is cut into 10 pieces under a dissection microscope (MZ125, Leica, Germany) and all of the pieces are stored on ice for our 3D co-cultures.
Tumor biopsies for the 3D co-culture platforms.
Notes: It is important that the needle biopsies are collected from the peripheral areas of xenografts and do not include the necrotic tissues. If using patient tumor biopsies or needle aspirations, an Institutional Review Board protocol is needed. For surgical tissue, ideal biopsies should be collected from the regions not containing necrotic tissues. For needle aspirations, besides confirming that the sampling area is in the tumor tissue, each sample needs to be inspected using a microscope to determine if it contains cell clusters because, in most cases, needle aspirations contain connective tissue with only a few tumor cells.
Box 4 Peritumoral, rather than intratumoral, tissue represents the progress and prognosis characteristics of a tumor
As the tumor size increases, the center becomes necrotic and hypoxic but the peripheral tissues proliferate and the proliferating capability of the cells gradually diminishes from the peripheral to central areas of the tumor [8, 9]. We observed that biopsies from the peritumoral areas of mouse human tumor xenografts induced a significant amount of vascularization of endothelial cells compared to the intratumoral and central counterparts in our 3D co-culture platforms [1].
3D Co-Culture Platforms
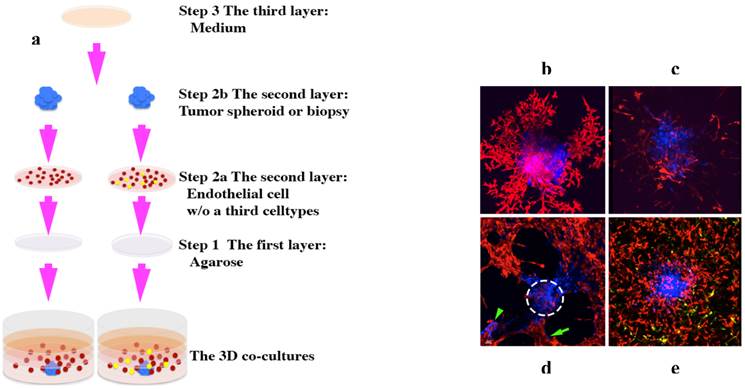
Our phenotypic fluorescent 3D platforms are prepared in three layers [1] (Figures 6 and 7):
3D co-culture platforms. (a), schematic showing how to set up the 3D co-culture platforms. A tumor monoclonal spheroid or tumor biopsy (blue) is embedded within ECM and surrounded by evenly dispersed endothelial cells (red) with or without a third cell population (yellow) [1]. (b)-(e), 3D rendered confocal images taken between 5-9 days in culture. A human ocular melanoma monoclonal spheroid (b) and a human leiomyosarcoma tumor xenograft biopsy (c) induced a fully developed vascular network of endothelial cells [1]. (d), rat pheochromocytoma monoclonal spheroid induced fully developed vascular network; some of the tumor cells (green arrow) migrated away from its primary colony (white dotted-circle) and formed a secondary tumor colony (green arrowhead) [1]. (e), human leomyosarcoma monoclonal spheroid induced fully developed vascular network of endothelial cells with the presence of a third cell population, pericytes (yellow). Images (b) and (d) originally were published in the Journal of Cancer [1].
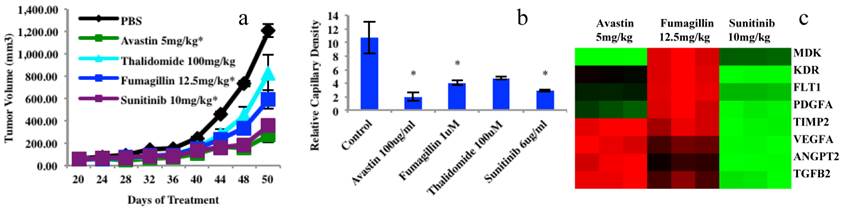
Chemosensitivity screening data from four anticancer drugs in mouse xenograft models and 3D platforms as well as gene analyses of endothelial cells sorted from mouse xenografts using a human leiomyosarcoma. (a), Tumor growth from mouse xenograft models, n=10. Tumor xenograft biopsy induced capillary density bar chart after 5 days in culture, endothelial cells or vascular network (yellow) and tumor biopsies (dotted cyan circles). N=3; bar=100μm; *P<0.05. (c), Examples of 8 gene expressions (84 angiogenesis genes of PCR Array data) in endothelial cells extracted from three treated mouse xenograft groups compared to the controls. Graphs (a) and (b) were originally published in the Journal of Cancer [1].
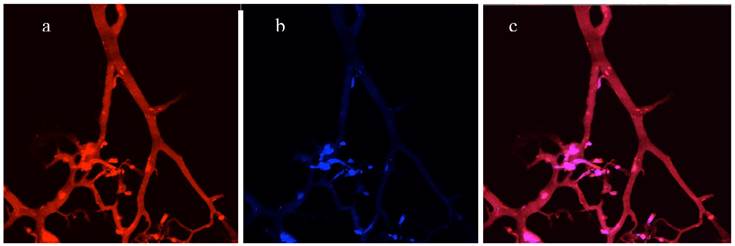
Directly imaging a cryosection of a 3D co-culture without staining. (a), Red channel - vascular network of endothelial cells expressed DsRed fluorescent proteins. (b), Blue channel - tumor cells expressing AmCyan fluorescent proteins. (c), Merged red and blue channels.
- The first layer, which is in contact with the bottom of a 96-well plate, is 50µl of solidified 1.5% agarose;
- The second layer consists of 50µl of a mixture of two or more types of cells evenly dispersed in Geltrex; and
- The third layer consists of EBM2 medium supplemented with 1/10 of a SingleQuots supplement kit (Lonza) and may contain the testing agent(s).
Notes: We recommend optimizing the endothelial cell concentrations for the co-cultures. Fluorescent endothelial cells and/or a third cell type (mast cells or pericytes) are harvested at 50~70% confluence and resuspended in EBM2 complete medium. Endothelial cells are then suspended at 140,000-280,000 cells/ml in Geltrex and 50µl of the mixture is added onto the first layer. If a third cell population is used, we recommend optimizing the ratios of the endothelial cells vs. the third population. The ratio between different cell populations in vivo varies, e.g., endothelial-to-pericyte ratio range is reported to be 1:100 to 1:1 [70]. In the 3D co-culture platforms, we used a ratio of 1:20 to 1:10 between endothelial cells and pericytes and observed a dramatic effect on the pericytes. An optimal ratio of different cell populations should provide a clear co-cultural effect. A spheroid tumor colony or a xeno-biopsy (~100μm) (prepared as described in sections Tumor Spheroids and Tumor Nude Mouse Xenografts) is transplanted into the second layer. This complex is solidified at 37°C and cultured in a 100µl/well of EBM2 growth medium to make a final concentration of 0.5% FBS. The complex is cultured for 5-9 days before imaging (Zen2007, LSM 510, Zeiss). The high-resolution 3D z-stack images can be rendered using the iso-surface 3D mode and their capillary density can be quantified by using the Imaris 7.4.0 software (Biplane) [71]. The 360° view movies can be generated using the maximum intensity panoramic projection (Zen2007). A time-lapse movie can be recorded every 10 minutes to watch tumor progression in action and in real time. All of the videos can be converted into a MP4 format using MPEG Streamclip software (Squared 5). The concentration of Geltrex or any other equivalent products is critical. We recommend using a protein concentration of about 12-15mg/ml for a good suspension. If the concentration is too low, all of the cells will sink down to the interface of the agarose and Geltrex.
Box 5 Put tumors back into an in vivo-like microenvironment
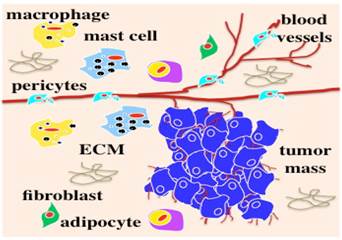
Most solid tumors are epithelial-originated and survive and progress within an intricate microenvironment (Figure 1) of various non-malignant cell populations in ECM in vivo. We have learned a lot about tumor biology from conventional 2D cell cultures. Preclinical drug discovery generally have been performed and validated in 2D cell-based assays prior to the development of animal models. However, due to a lack of an in vivo microenvironment in 2D cell cultures, cells have lost their native physiological or pathophysiological features in terms of transformed morphology and distorted gene or protein profiling [10-15]. Animal tumor models present significant limitations in reflecting human responses and insufficient relevant information for translation to the clinic. As a result, 90% of preclinical anti-cancer drugs developed from these 2D cell-based assays failed to become licensed drugs [16, 17]. Appropriate preclinical models to develop and validate novel anti-cancer agents are critical to prevent clinical trial failures and eliminate exorbitant costs.
Tumor in vivo survives and progresses within a microenvironment (originally published in the Journal of Cancer) [1-5].
By incorporating an avascular non-necrotic tumor monoclonal spheroid or peritumoral biopsy with necessary co-effector cell populations, the 3D co-culture platforms recapitulated tumor in vivo progression within 9 days by showing: 1) tumor-induced vascularization of endothelial cells if the tumor is angiogenic in vivo; 2) dramatic tumor growth as the vascular network forms; and 3) tumor migration along the endothelial vasculature highway and a secondary tumor colony formation distant from the primary tumor spheroid [1]. The 3D co-culture platforms are much more time-efficient in recreating tumor progression than the natural progression that occurs within a human which takes approximately 10-15 years [48-50]. Within 9 days, we generated anticancer drug chemosensitivity data equivalent to the data produced from mouse tumor xenograft models in 50 days. Therefore, this 3D co-culture platform is a more accurate, efficient, and cost-effective preclinical model for anticancer drug development. Furthermore, because the 3D co-culture platform can recreate tumor metastasis, it would be a suitable model to efficiently develop anti-metastatic drugs.
More importantly, using a very small amount of biopsy tissue, the 3D co-culture platforms can predict an effective hierarchy of regimes to provide personalized chemotherapy, as well as performing follow-up chemosensitivity screening to determine whether the patients have developed drug resistance. Ultimately, the 3D co-culture platforms should improve the effectiveness and efficiency of chemotherapy.
3D Co-Culture Cryosection
The cryosection protocol was modified from a previous report [72].
- After the medium is removed, wash the 3D co-cultures 3x in cold PBS.
- Fix each co-culture in 100μl of pre-chilled 0.5% glutaraldehyde in PBS, pH 7.4, at 4°C for 24 hours and embed them in O.C.T. (Tissue-Tek) following a brief wash in cold PBS.
- Section the co-cultures at 5μm using a cryostat (Leica) and mount the sections in an anti-fading fluorescent mounting medium without DAPI (Dako) for imaging (LSM510, Zeiss). Process images using Imaris 7.4.0 software (Bitplane).
Notes: Another benefit of using fluorescent cell populations in our 3D co-culture platforms is to observe existing cell populations or structures directly on the cryosections (Figure 7). There is no need to stain the sections prior to observing the structures of 3D co-cultures because the fluorescence is preserved using the conventional cryosectioning process. If additional staining is needed, mirrored sections should be prepared.
Gene Profiling Analyses of 3D Co-Culture
Currently, because all tumor related molecular assays analyze the genes of the entire mixture of co-culture or patient's biopsies, their results are non-specific for diagnosis and/or targeted therapies. The 3D co-culture platforms can bring gene profiling and signaling pathway analyses to a whole new level. Using an enzyme mixture, different cell populations can be separated and retrieved from the 3D co-culture platforms to analyze the gene profiling of individual cell populations. We have demonstrated that the proposed 3D platforms provided equivalent chemosensitivity data to the data generated from mouse xenograft models (Figure 6) on four anticancer drugs. Endothelial cells were sorted from 3D co-culture platforms and 8 genes were analyzed (extracted from the 84 angiogenesis PCR array data, SABiosciences) (Figure 7c). The enzyme mixture contains the following ingredients: 2mg/ml collagenase A, 250μg/ml elastase, 25μg/ml DNase I, 1%FBS, and 20mM HEPE in DMEM.
Cell isolation can be accomplished by performing the following steps:
- Aspirate the medium;
- Rinse 3x in ice cold PBS with 0.5% BSA;
- Transfer the co-cultures to a 1.5ml conical tube;
- Add 1ml of the enzyme mixture to the tube;
- Incubate for 10~20 minutes at 150rpm, 37°C;
- Centrifuge the samples at 1200rpm for 5 minutes;
- Resuspend the pellets in ice cold PBS with 0.5% BSA;
- Sort the target cells by using a FACS sorting system;
- Spin down the cells to perform a RNA extraction using RNeasy Micro Kit (Qiagen) to run an 84 angiogenesis gene PCR array analysis (SABiosciences); and
- Analyze the data using a SABiosciences web tool.
Notes: All of the procedures, prior to the enzyme mixture incubation, should be performed on ice. Cell isolation also can be performed using a non-enzymatic cell dissociation medium. If a low number of cells is sorted, synthesize the cDNA using a RT2 PreAMP cDNA Synthesis Kit and pre-amply the cDNA using the relevant RT-PCR RT2 PreAMP Primer Mixes (SAbiosciences) prior to the final array analyses.
Box 6 Whole new level of molecular analysis for cancer
Because all of the cell populations in our tumor spheroid 3D co-cultures and most of the cell populations in our biopsy 3D co-cultures can be sorted into individual cell populations, the gene profiling analysis will be more specific and, thus, better suited for diagnostic assistance or targeted therapy.
SUMMARY
The 3D co-culture platforms can more closely mimic the tumor in vivo pathological process. By increasing the number of cell populations, the more closely these platforms are able to mimic this process. Presently, a limitation of the 3D co-culture platforms is the number of cell populations; more than four are difficult to differentiate from one another. Accordingly, it is necessary to develop more refined tools of observation or better differentiable fluorescent proteins to resolve this problem.
Competing Interests
The authors have declared that no competing interest exists.
References
1. Fang C, Avis I, Salomon D, Cuttitta F. Novel Phenotypic Fluorescent Three-Dimensional Platforms for High-throughput Drug Screening and Personalized Chemotherapy. Journal of Cancer. 2013;4:402-15 doi:10.7150/jca.6780
2. Abbott A. Cell culture: biology's new dimension. Nature. 2003;424:870-2 doi:10.1038/424870a424870a [pii]
3. Smalley KS, Lioni M, Herlyn M. Life isn't flat: taking cancer biology to the next dimension. In Vitro Cell Dev Biol Anim. 2006;42:242-7 doi:0604027 [pii]10.1290/0604027.1
4. Mitra M, Mohanty C, Harilal A, Maheswari UK, Sahoo SK, Krishnakumar S. A novel in vitro three-dimensional retinoblastoma model for evaluating chemotherapeutic drugs. Mol Vis. 2012;18:1361-78
5. Kessler DA, Langer RS, Pless NA, Folkman J. Mast cells and tumor angiogenesis. Int J Cancer. 1976;18:703-9
6. Folkman J, Kalluri R. Cancer without disease. Nature. 2004;427:787. doi:10.1038/427787a427787a [pii]
7. Black WC, Welch HG. Advances in diagnostic imaging and overestimations of disease prevalence and the benefits of therapy. N Engl J Med. 1993;328:1237-43 doi:10.1056/NEJM199304293281706
8. Freyer JP, Sutherland RM. Selective dissociation and characterization of cells from different regions of multicell tumor spheroids. Cancer Res. 1980;40:3956-65
9. Kunz-Schughart LA, Freyer JP, Hofstaedter F, Ebner R. The use of 3-D cultures for high-throughput screening: the multicellular spheroid model. Journal of biomolecular screening. 2004;9:273-85 doi:10.1177/1087057104265040
10. De Witt Hamer PC, Van Tilborg AA, Eijk PP, Sminia P, Troost D, Van Noorden CJ. et al. The genomic profile of human malignant glioma is altered early in primary cell culture and preserved in spheroids. Oncogene. 2008;27:2091-6 doi:10.1038/sj.onc.1210850
11. Sutherland RM. Cell and environment interactions in tumor microregions: the multicell spheroid model. Science. 1988;240:177-84
12. Bjerkvig R, Andersen KJ. [Tumor invasion and proteases]. Tidsskrift for den Norske laegeforening: tidsskrift for praktisk medicin, ny raekke. 1990;110:3718-9
13. Wolff JE, Trilling T, Molenkamp G, Egeler RM, Jurgens H. Chemosensitivity of glioma cells in vitro: a meta analysis. Journal of cancer research and clinical oncology. 1999;125:481-6
14. Voskoglou-Nomikos T, Pater JL, Seymour L. Clinical predictive value of the in vitro cell line, human xenograft, and mouse allograft preclinical cancer models. Clin Cancer Res. 2003;9:4227-39
15. Lee J, Kotliarova S, Kotliarov Y, Li A, Su Q, Donin NM. et al. Tumor stem cells derived from glioblastomas cultured in bFGF and EGF more closely mirror the phenotype and genotype of primary tumors than do serum-cultured cell lines. Cancer Cell. 2006;9:391-403 doi:10.1016/j.ccr.2006.03.030
16. Von Hoff DD. There are no bad anticancer agents, only bad clinical trial designs--twenty-first Richard and Hinda Rosenthal Foundation Award Lecture. Clinical cancer research: an official journal of the American Association for Cancer Research. 1998;4:1079-86
17. Dong X, Guan J, English JC, Flint J, Yee J, Evans K. et al. Patient-derived first generation xenografts of non-small cell lung cancers: promising tools for predicting drug responses for personalized chemotherapy. Clin Cancer Res. 2010;16:1442-51 doi:10.1158/1078-0432.CCR-09-2878
18. Cannistra SA. Cancer of the ovary. N Engl J Med. 2004;351:2519-29 doi:10.1056/NEJMra041842
19. Kunz-Schughart LA, Kreutz M, Knuechel R. Multicellular spheroids: a three-dimensional in vitro culture system to study tumour biology. Int J Exp Pathol. 1998;79:1-23
20. Folkman J, Gimbrone MA Jr. Perfusion of the thyroid. Acta Endocrinol Suppl (Copenh). 1972;158:237-48
21. Gimbrone MA Jr, Leapman SB, Cotran RS, Folkman J. Tumor dormancy in vivo by prevention of neovascularization. J Exp Med. 1972;136:261-76
22. Berglund A, Glimelius B, Bergh J, Brodin O, Fjallskog ML, Hagberg H. et al. Selection of chemotherapy by ex vivo assessment of tumor sensitivity to cytotoxic drugs: results of a clinical trial. Med Oncol. 2002;19:151-9 doi:10.1385/MO:19:3:151
23. Ochs RL, Fensterer J, Ohori NP, Wells A, Gabrin M, George LD. et al. Evidence for the isolation, growth, and characterization of malignant cells in primary cultures of human tumors. In Vitro Cell Dev Biol Anim. 2003;39:63-70 doi:10.1290/1543-706X(2003)039<0063:EFTIGA>2.0.CO;2
24. Yuhas JM, Li AP, Martinez AO, Ladman AJ. A simplified method for production and growth of multicellular tumor spheroids. Cancer Res. 1977;37:3639-43
25. Hewitt RE, Powe DG, Carter GI, Turner DR. Desmoplasia and its relevance to colorectal tumour invasion. Int J Cancer. 1993;53:62-9
26. Noel A, Munaut C, Nusgens B, Lapiere CM, Foidart JM. Different mechanisms of extracellular matrix remodeling by fibroblasts in response to human mammary neoplastic cells. Invasion Metastasis. 1993;13:72-81
27. Ellis MJ, Singer C, Hornby A, Rasmussen A, Cullen KJ. Insulin-like growth factor mediated stromal-epithelial interactions in human breast cancer. Breast Cancer Res Treat. 1994;31:249-61
28. Kunz-Schughart LA, Heyder P, Schroeder J, Knuechel R. A heterologous 3-D coculture model of breast tumor cells and fibroblasts to study tumor-associated fibroblast differentiation. Exp Cell Res. 2001;266:74-86 doi:10.1006/excr.2001.5210
29. Friedrich J, Seidel C, Ebner R, Kunz-Schughart LA. Spheroid-based drug screen: considerations and practical approach. Nat Protoc. 2009;4:309-24 doi:nprot.2008.226 [pii]10.1038/nprot.2008.226
30. Deisboeck TS, Berens ME, Kansal AR, Torquato S, Stemmer-Rachamimov AO, Chiocca EA. Pattern of self-organization in tumour systems: complex growth dynamics in a novel brain tumour spheroid model. Cell Prolif. 2001;34:115-34
31. Landry J, Bernier D, Ouellet C, Goyette R, Marceau N. Spheroidal aggregate culture of rat liver cells: histotypic reorganization, biomatrix deposition, and maintenance of functional activities. J Cell Biol. 1985;101:914-23
32. Li AP, Colburn SM, Beck DJ. A simplified method for the culturing of primary adult rat and human hepatocytes as multicellular spheroids. In Vitro Cell Dev Biol. 1992;28A:673-7
33. Dilworth C, Hamilton GA, George E, Timbrell JA. The use of liver spheroids as an in vitro model for studying induction of the stress response as a marker of chemical toxicity. Toxicology in vitro: an international journal published in association with BIBRA. 2000;14:169-76
34. Brophy CM, Luebke-Wheeler JL, Amiot BP, Khan H, Remmel RP, Rinaldo P. et al. Rat hepatocyte spheroids formed by rocked technique maintain differentiated hepatocyte gene expression and function. Hepatology. 2009;49:578-86 doi:10.1002/hep.22674
35. Sakai Y, Tanaka T, Fukuda J, Nakazawa K. Alkoxyresorufin O-dealkylase assay using a rat hepatocyte spheroid microarray. Journal of bioscience and bioengineering. 2010;109:395-9 doi:10.1016/j.jbiosc.2009.10.001
36. Sakai Y, Yamagami S, Nakazawa K. Comparative analysis of gene expression in rat liver tissue and monolayer- and spheroid-cultured hepatocytes. Cells Tissues Organs. 2010;191:281-8 doi:10.1159/000272316
37. Tong JZ, Bernard O, Alvarez F. Long-term culture of rat liver cell spheroids in hormonally defined media. Exp Cell Res. 1990;189:87-92
38. Langlois AJ, Holder WD Jr, Iglehart JD, Nelson-Rees WA, Wells SA Jr, Bolognesi DP. Morphological and biochemical properties of a new human breast cancer cell line. Cancer Res. 1979;39:2604-13
39. Glinsky GV, Glinsky VV. Apoptosis amd metastasis: a superior resistance of metastatic cancer cells to programmed cell death. Cancer Lett. 1996;101:43-51
40. Glinsky VV, Huflejt ME, Glinsky GV, Deutscher SL, Quinn TP. Effects of Thomsen-Friedenreich antigen-specific peptide P-30 on beta-galactoside-mediated homotypic aggregation and adhesion to the endothelium of MDA-MB-435 human breast carcinoma cells. Cancer Res. 2000;60:2584-8
41. Takaishi S, Okumura T, Tu S, Wang SS, Shibata W, Vigneshwaran R. et al. Identification of gastric cancer stem cells using the cell surface marker CD44. Stem Cells. 2009;27:1006-20 doi:10.1002/stem.30
42. Hamburger AW, Salmon SE. Primary bioassay of human tumor stem cells. Science. 1977;197:461-3
43. Mattern J, Jager S, Sonka J, Wayss K, Volm M. Growth of human bronchial carcinomas in nude mice. Br J Cancer. 1985;51:195-200
44. Johnson JR, Hammond WG, Benfield JR, Tesluk H. Successful xenotransplantation of human lung cancer correlates with the metastatic phenotype. The Annals of thoracic surgery. 1995;60:32-6 discussion 6-7
45. Perez-Soler R, Kemp B, Wu QP, Mao L, Gomez J, Zeleniuch-Jacquotte A. et al. Response and determinants of sensitivity to paclitaxel in human non-small cell lung cancer tumors heterotransplanted in nude mice. Clin Cancer Res. 2000;6:4932-8
46. Fichtner I, Rolff J, Soong R, Hoffmann J, Hammer S, Sommer A. et al. Establishment of patient-derived non-small cell lung cancer xenografts as models for the identification of predictive biomarkers. Clin Cancer Res. 2008;14:6456-68 doi:10.1158/1078-0432.CCR-08-0138
47. Merk J, Rolff J, Becker M, Leschber G, Fichtner I. Patient-derived xenografts of non-small-cell lung cancer: a pre-clinical model to evaluate adjuvant chemotherapy? European journal of cardio-thoracic surgery: official journal of the European Association for Cardio-thoracic Surgery. 2009;36:454-9 doi:10.1016/j.ejcts.2009.03.054
48. Smith HS, Wolman SR, Hackett AJ. The biology of breast cancer at the cellular level. Biochim Biophys Acta. 1984;738:103-23
49. Feuer EJ, Wun LM, Boring CC, Flanders WD, Timmel MJ, Tong T. The lifetime risk of developing breast cancer. J Natl Cancer Inst. 1993;85:892-7
50. Wolff MS, Collman GW, Barrett JC, Huff J. Breast cancer and environmental risk factors: epidemiological and experimental findings. Annual review of pharmacology and toxicology. 1996;36:573-96 doi:10.1146/annurev.pa.36.040196.003041
51. Del Duca D, Werbowetski T, Del Maestro RF. Spheroid preparation from hanging drops: characterization of a model of brain tumor invasion. Journal of neuro-oncology. 2004;67:295-303
52. Yip D, Cho CH. A multicellular 3D heterospheroid model of liver tumor and stromal cells in collagen gel for anti-cancer drug testing. Biochem Biophys Res Commun. 2013;433:327-32 doi:10.1016/j.bbrc.2013.03.008
53. Ong SM, Zhao Z, Arooz T, Zhao D, Zhang S, Du T. et al. Engineering a scaffold-free 3D tumor model for in vitro drug penetration studies. Biomaterials. 2010;31:1180-90 doi:10.1016/j.biomaterials.2009.10.049
54. Wartenberg M, Donmez F, Ling FC, Acker H, Hescheler J, Sauer H. Tumor-induced angiogenesis studied in confrontation cultures of multicellular tumor spheroids and embryoid bodies grown from pluripotent embryonic stem cells. FASEB J. 2001;15:995-1005
55. Unsworth BR, Lelkes PI. Growing tissues in microgravity. Nature medicine. 1998;4:901-7
56. Sourla A, Doillon C, Koutsilieris M. Three-dimensional type I collagen gel system containing MG-63 osteoblasts-like cells as a model for studying local bone reaction caused by metastatic cancer cells. Anticancer Res. 1996;16:2773-80
57. Bell E. Strategy for the selection of scaffolds for tissue engineering. Tissue engineering. 1995;1:163-79 doi:10.1089/ten.1995.1.163
58. Jacquot J, Spilmont C, Burlet H, Fuchey C, Buisson AC, Tournier JM. et al. Glandular-like morphogenesis and secretory activity of human tracheal gland cells in a three-dimensional collagen gel matrix. J Cell Physiol. 1994;161:407-18 doi:10.1002/jcp.1041610303
59. Tan W, Krishnaraj R, Desai TA. Evaluation of nanostructured composite collagen--chitosan matrices for tissue engineering. Tissue engineering. 2001;7:203-10 doi:10.1089/107632701300062831
60. Emmert-Buck MR, Bonner RF, Smith PD, Chuaqui RF, Zhuang Z, Goldstein SR. et al. Laser capture microdissection. Science. 1996;274:998-1001
61. Ivascu A, Kubbies M. Diversity of cell-mediated adhesions in breast cancer spheroids. Int J Oncol. 2007;31:1403-13
62. Beebe DJ, Moore JS, Yu Q, Liu RH, Kraft ML, Jo BH. et al. Microfluidic tectonics: a comprehensive construction platform for microfluidic systems. Proc Natl Acad Sci U S A. 2000;97:13488-93 doi:10.1073/pnas.250273097
63. Brophy CM, Luebke-Wheeler JL, Amiot BP, Remmel RP, Rinaldo P, Nyberg SL. Gene expression and functional analyses of primary rat hepatocytes on nanofiber matrices. Cells Tissues Organs. 2010;191:129-40 doi:10.1159/000223235
64. Dulong JL, Legallais C, Darquy S, Reach G. A novel model of solute transport in a hollow-fiber bioartificial pancreas based on a finite element method. Biotechnol Bioeng. 2002;78:576-82 doi:10.1002/bit.10230
65. Gillies RJ, Galons JP, McGovern KA, Scherer PG, Lien YH, Job C. et al. Design and application of NMR-compatible bioreactor circuits for extended perfusion of high-density mammalian cell cultures. NMR in biomedicine. 1993;6:95-104
66. Hartmann C, Kluwe L, Lucke M, Westphal M. The rate of homozygous CDKN2A/p16 deletions in glioma cell lines and in primary tumors. Int J Oncol. 1999;15:975-82
67. Steilen-Gimbel H, Steudel WI, Feiden W, Moringlane JR, Henn W, Zang KD. Genetic heterogeneity in human astrocytomas: spatial distribution of P16 and TP53 deletions in biopsies. Cancer Genet Cytogenet. 1999;113:115-9
68. Loeper S, Romeike BF, Heckmann N, Jung V, Henn W, Feiden W. et al. Frequent mitotic errors in tumor cells of genetically micro-heterogeneous glioblastomas. Cytogenetics and cell genetics. 2001;94:1-8 doi:48773
69. Fialkow PJ. The origin and development of human tumors studied with cell markers. N Engl J Med. 1974;291:26-35 doi:10.1056/NEJM197407042910109
70. Armulik A, Genove G, Betsholtz C. Pericytes: developmental, physiological, and pathological perspectives, problems, and promises. Developmental cell. 2011;21:193-215 doi:10.1016/j.devcel.2011.07.001
71. Xu F, Burk D, Gao Z, Yin J, Zhang X, Weng J. et al. Angiogenic deficiency and adipose tissue dysfunction are associated with macrophage malfunction in SIRT1-/- mice. Endocrinology. 2012;153:1706-16 doi:10.1210/en.2011-1667
72. Brown TA, Fetter RD, Tkachuk AN, Clayton DA. Approaches toward super-resolution fluorescence imaging of mitochondrial proteins using PALM. Methods. 2010;51:458-63 doi:10.1016/j.ymeth.2010.01.001
Author contact
![]() Corresponding author: changgefangcom (C.F.): Tel. 1(202) 277-1956; Fax. 1(703) 960-3216
Corresponding author: changgefangcom (C.F.): Tel. 1(202) 277-1956; Fax. 1(703) 960-3216