Impact Factor ISSN: 1837-9664

 Global reach, higher impact
J Cancer 2013; 4(7):536-548. doi:10.7150/jca.6477 This issue Cite
Research Paper
A New Method for Identifying Stem-Like Cells in Esophageal Cancer Cell Lines
Taghreed N. Almanaa1, Michael E. Geusz1, Roudabeh J. Jamasbi1,2 ![]()
1. Department of Biological Sciences, Bowling Green State University, Bowling Green, OH 43403, USA
2. Department of Public and Allied Health, Bowling Green State University, Bowling Green, OH 43403, USA
Received 2013-4-15; Accepted 2013-7-24; Published 2013-8-10
Abstract
Cancer stem cells (CSCs) appear to resist chemo-radiotherapy and initiate tumor recurrence in patients. Isolation and further characterization of this subpopulation is important for targeting CSCs. Flow cytometry using Aldefluor, a fluorescent substrate of aldehyde dehydrogenase, has been used to isolate CSCs from various cancer cell lines. However, new techniques are needed to locate and identify CSCs in culture for live-cell analyses such as fluorescence microscopy without introducing artifacts during cell sorting and to observe CSC and non-CSC interactions. Previously, we characterized a distinct CSC subpopulation within human esophageal cancer cell lines (ESCC). In this study we introduce the attached-cell Aldefluor method (ACAM) to detect CSCs in ESCC cell lines (KY-5, KY-10, TE-1, TE-8, YES-1, YES-2). To validate this technique, we isolated CSCs from the YES-2 parental line using standard Aldefluor flow cytometry to create a cell line enriched in CSCs (YES-2CSC). This line showed significantly greater ACAM staining and higher CD44 levels than YES-2. ACAM also showed significantly higher ALDH activity in YES-2CSC than in YES-2S, a cell line that has a diminished CSC subpopulation after having survived treatment with curcumin. ACAM stained cells within tumorspheres made from the CSC-enriched line but not differentiating cells from the tumorspheres. This study also demonstrates a new method for generating and growing tumorspheres without the growth factor supplements normally used in medium to form tumorspheres. ACAM should be evaluated using other cancer cell lines to further substantiate its effectiveness and to characterize CSCs in culture through various imaging techniques.
Keywords: Esophageal Cancer, Cancer Stem Cells, Aldefluor, Adherent Cells, CD44, Tumorsphere, Curcumin.
Introduction
Recent studies show that many solid tumors contain a subpopulation of cells known as cancer stem cells (CSCs) 1, 2. CSCs display stem cell characteristics including self-renewal and differentiation into a heterogeneous population of cancer cells consisting of progenitor cells and more differentiated cancer cells 3-5. It is likely that CSCs are responsible for initiation, progression, recurrence, metastasis, and chemo-radiotherapy resistance 6, 7. Additional methods to identify and isolate CSCs are needed for their functional characterization and to develop effective therapeutics targeting this cell subpopulation 8. CSCs have been identified and isolated from different cancer cell lines using several techniques. Tumor formation by CSCs in vivo is the most definitive method for identifying these cells, but several in vitro methods are also effective. For example, fluorescence-activated cell sorting (FACS) or magnetic cell separation are used to isolate CSCs based on expression of specific cell markers, such as the expression of CD24, CD44, and CD133 9-11, although the presence of these surface proteins varies considerably among CSCs of different cancers. Another method is to use the fluorescent Hoechst 33342 dye, which is used to isolate a Hoechst-negative CSC “side population” 12. With this method, however, the possible toxicity of the dye may cause side effects during cell sorting 13, 14.
CSCs often have significantly elevated aldehyde dehydrogenase (ALDH) activity 15. A substrate for ALDH1, Aldefluor, was initially developed to isolate hematopoietic stem cells using FACS 16. This Aldefluor method has been applied for separation of CSCs from tumor tissue and cancer cell lines 17, 18. Aldefluor has been used successfully to detect elevated ALDH1 activity in stem and progenitor cells of lung 18, prostate 19, breast 20, colon 21 and bladder 22 cancers.
Aldefluor contains the ALDH1 substrate BODIPY-aminoacetaldehyde (BAAA) that is converted by ALDH1 into the fluorescent product BODIPY-aminoacetate (BAA) 16, as described in the product literature (Stem Cell Technologies). Live cells retain BAA because of its charge and also because the multidrug-resistance transporters are intentionally inhibited by the Aldefluor reagents. Aldefluor treated cells expressing high levels of ALDH1 activity have high fluorescence and can be isolated with FACS into two subpopulations—ALDH-hi and ALDH-low 17. Even though this method has been used to identify CSCs and has been validated for some cancers, it has not been employed as widely as techniques that identify CSC surface markers such as CD44 or CD133 23.
Although these flow cytometry methods are effective for quantifying CSCs and enriching the CSC content of cell cultures, they have drawbacks and limitations concerning the handling of the cells 24. For example, they require cell trypsinization to produce cells in suspension and in this state cells clump together and metabolism may be altered by poor access to the medium. Cell handling can also induce stress, disrupt gene expression, and lead to altered cell physiology. To extend the usefulness of Aldefluor as a stem cell marker, we assessed the use of Aldefluor staining in cancer cells in adherent cell cultures, which resulted in the attached-cell Aldefluor method (ACAM). Being able to identify stem cells in live cell monolayers with a technique such as ACAM has several advantages: (1) single-cell imaging of physiological processes within CSCs is much more practical in monolayers than with cells in suspension or tumorsphere cultures, the typical method for growing CSCs 25; (2) the viability of CSCs in tumorspheres is highly variable depending on cell access to the medium and effects from the microenviroment, whereas monolayers have more uniform access to nutrients, oxygen and mitogens such as epidermal growth factor (EGF) and basic fibroblast growth factor (bFGF) 26, 27; and (3) derivation of CSC cultures from tumors would be aided by being able to identify live CSCs in monolayers 26. However, the standard Aldefluor technique in which cells in suspension are stained remains a valuable method for separating and collecting CSCs from cultures.
Here we describe the use of ACAM with six esophageal squamous cell carcinoma (ESCC) cell lines that were used previously to evaluate curcumin effects on CSCs 28, Curcumin, an ingredient of the spice turmeric, inhibits cancer cell growth 29, 30 including ESCCs 31, 32 and reduces the number of CSCs in cancer cell lines relative to the more differentiated cancer cells 28, 33-35. One of our CSC-depleted ESCC lines, YES-2S, that had survived curcumin treatment 28 was used in the current study. In addition, to create a cell line enriched in CSCs standard Aldefluor flow cytometry was applied to one of the ESCC lines, YES2, and tested with ACAM.
CSCs have also been identified by their ability to form tumorspheres in medium containing specific growth factors 36, 37. Tumorspheres are enriched in CSCs and the stem-like progenitor cells differentiating from CSCs 38. We applied Aldefluor directly to ESCC tumorspheres to test whether the cell types within the tumorspheres could be distinguished by fluorescence microscopy. Aldefluor has been used to detect CSCs in cell suspensions derived from tumorspheres 39, 40, but has not been used to stain intact tumorspheres in culture. To further characterize tumorspheres in terms of their CSC content, we examined tumorsphere formation, growth, sensitivity to curcumin, and ALDH1 activity. The present study discusses the potential benefits of ACAM for investigating individual CSCs in culture and is the first to demonstrate the usefulness of Aldefluor imaging in cancer cells growing as monolayers or tumorspheres.
Materials and Methods
Cell lines and culture conditions
Human ESCC lines (KY-5, KY-10, TE-1, TE-8, YES-1, and YES-2) were provided from various sources 41-44, and they were previously characterized immunologically and morphologically in our laboratory 28, 45 Cells were grown in a medium designated as Complete medium that consisted of Dulbecco's modified Eagle medium (DMEM) containing penicillin (100 units/ml), streptomycin (100 µg/ml), L-glutamine (2 mM) (Life Technologies, Grand Island, NY), and 10% fetal bovine serum (FBS, Summit Biotechnology, Ft. Collins, CO). Cells were grown in 100-mm tissue culture dishes (Falcon, Lincoln Park, NJ) at 37°C in 100% humidity and 5% CO2. Cells were passaged when they reached near confluency as described previously28.
Aldefluor assay and separation of cells with high-ALDH activity
ALDH activity was assayed in the YES-2 cell line using the Aldefluor kit according to the manufacturer's instructions (STEMCELL Technologies, Vancouver, BC, Canada). Briefly, 3 ml of a cell suspension (106 cells/ml in DMEM without serum) was centrifuged at 250 x g and resuspended in 3 ml of Aldefluor Buffer on ice. To produce the fluorescent product, 45 μl of activated Aldefluor substrate was mixed with 3 ml of the cell suspension. Immediately after mixing, 1 ml was used as the negative control by adding 30 μl of diethylaminobenzaldehyde (DEAB), the ALDH1 inhibitor. The test sample and negative control were incubated for 45 min at 37°C and agitated every 5 min. These cells were centrifuged and resuspended in Aldefluor Buffer and kept on ice for one hour. The cells were separated by flow cytometry using a FACSAria III (BD Biosciences, San Jose, CA) based on fluorescence and cell scattering into two subpopulations—CSCs and non-CSCs. FACS was performed at the Flow Cytometry Core Facility, University of Toledo, OH. After separation, cells were plated, grown in culture, and stored at -80°C for future experiments. Cell sorting data were analyzed with WinMDI 2.8 software.
Attached-cell Aldefluor method (ACAM)
To evaluate ACAM's ability to determine ALDH1 activity in ESCC lines, Aldefluor reagent was used to stain attached ESCC cells. Each cell line was grown on 25-mm glass coverslips in Complete medium. After 48 hours, the coverslips were washed with Hank's Buffered Salt Solution (HBSS). One ml of Aldefluor Buffer was added to 15 μl of activated Aldefluor, and 200 μl of this solution was added to each coverslip which were then incubated for 45 min at 37°C in an incubator supplied with humidified air containing 5% CO2. Next, the coverslips were washed three times with HBSS and inverted on a chamber containing 100 μl HBSS mounted on a glass microscope slide. Control coverslips did not receive the activated Aldefluor, but were otherwise treated identically. The cells were examined with a fluorescence microscope (Zeiss Axiophot, Carl Zeiss Microscopy LLC, Thornwood, NY) and imaged with a cooled-CCD camera system (MicroMax Princeton Instruments, Trenton, NJ). Images were analyzed with Metamorph (Universal Imaging Corporation, Downingtown, PA), ImageJ (NIH), and OriginLab software (OriginLab Corporation, Northampton, MA).
CD44 immunocytochemistry
The expression of CD44 in both the YES-2CSC and YES-2 lines was examined as described previously 28. Briefly, each cell line was cultured on glass coverslips, incubated for 48 hrs, and then washed with PBS. Next, the cells were fixed with methanol for 5 min, washed with PBS three times, exposed to 0.3% hydrogen peroxide for 3 min, and rinsed three times with PBS. The cells were then incubated with normal goat serum (NGS, Rockland, Gilbertsville, PA) at 1:100 dilution for 30 min at room temperature followed by mouse monoclonal anti-human CD44 antibody (BD Biosciences, Franklin Lakes, NJ) at 1:10 dilution for 2 hrs at room temperature. After three rinses with PBS, the cells were incubated with goat anti-mouse horseradish peroxidase-conjugated antibody (Sigma-Aldrich, St Louis, MO) at 1:40 dilution for 30 min and then exposed to ImmunPACT diaminobenzidine for 10 min (Vector Laboratories, Burlingame, CA). The cover slips were dehydrated in an ethanol series, cleared with Citrosolve (Fisher, Pittsburgh, PA), and mounted on glass slides with Permount (Fisher, Pittsburgh, PA). Control cells were treated identically but did not receive primary antibody.
Image analysis
The images of cell cultures immunostained for CD44 were analyzed with ImageJ (NIH) and OriginLab (OriginLab) software. Cell staining intensity was determined by imaging with a 12-bit digital camera (MicroMax, Princeton Instruments) and a Zeiss Axiophot microscope. The images were thresholded identically using a pixel intensity (brightness) value of 500 analog-to-digital units (ADUs). For counting cells, ImageJ was used to identify cells within a normal size range (500-4000 pixels in area) that did not touch the edge of the image.
Tumorsphere formation
To examine the tumorsphere formation, CSCs isolated from the YES-2 line using FACS were grown in tissue culture plates with Complete medium as a monolayer until they reached near confluency. The cells were trypsinized, collected, and washed three times to remove the FBS. The cells were then cultured in two different ways: (1) with Complete medium in a 60-mm untreated petri dish or (2) with CSC medium consisting of DMEM-F12 supplemented with 20 ng/ml EGF, 20 ng/ml bFGF and B27 supplement (Invitrogen, Carlsbad, CA, USA) in a 60-mm ultra-low attachment plate (Corning Life Sciences, Tewksbury, MA). Cells were plated at a density of 104 cells/ plate and incubated in a humidified atmosphere with 5% CO2 at 37°C. One week later, plates were examined for tumorsphere formation using an inverted microscope. The tumorspheres were collected by gentle centrifugation, counted, and dissociated into single cells by treatment with trypsin-EDTA and mechanical disruption using a glass Pasteur pipette. The resulting single cells were resuspended in CSC medium or Complete medium, washed with PBS, and plated to allow tumorspheres to form again. Tumorspheres were passaged every 5-7 days when they reached a diameter about 100 μm.
Tumorsphere staining with Aldefluor
To assess the ability of ACAM to identify ALDH1 activity in tumorspheres, Aldefluor was applied to tumorspheres cultured in CSC medium and tumorspheres cultured in Complete medium in petri dishes. Cover slips were rinsed with HBSS, and then 1 ml of Aldefluor Buffer was added to 15 μl of activated Aldefluor and 100 μl of this solution was applied to the coverslips for 45 min in a 37°C incubator. Next, the Aldefluor reagent was removed, tumorspheres were rinsed with HBSS, and propidium iodide (330 µg/ml) was applied for 5 min. The cover slips were washed three times with HBSS and the tumorspheres were imaged with a digital camera (MicroMax, Princeton Instruments) and a Zeiss Axiophot microscope.
Another group of tumorspheres were collected, cultured on cover slips as attached tumorspheres in Complete or CSC medium and incubated at 37°C in a humidified incubator containing 5% CO2. In this case, the tumorspheres were allowed to attach in a thin film of medium for only 12 hrs before they were treated with Aldefluor for 45 min at 37°C and then propidium iodide as above just before imaging. Another group of tumorspheres was not allowed to attach but was instead treated with Aldefluor, washed with HBSS by centrifugation, treated with propidium iodide, and then washed with HBSS. This low-speed 250 x g centrifugation caused the tumorspheres to fragment into cell clusters.
Effect of curcumin on tumorspheres
To determine the effect of curcumin on the growth of YES-2CSCs tumorspheres, spheres were counted and cultured with 40 or 60 µM curcumin and 0.2% DMSO in Complete medium for 30 hrs. After incubation, tumorspheres were counted, the medium was replaced with Complete medium without curcumin and incubated at 37°C for four days to allow tumorspheres that survived the treatment to grow. Tumorspheres were imaged after 30 hrs or 4 days of treatment. Control tumorspheres were given medium containing 0.2% DMSO.
To determine the effect of curcumin on tumorsphere formation, tumorspheres were collected, dissociated into single cells using trypsin-EDTA and mechanical disruption with a glass Pasteur pipette. Resulting dissociated cells were resuspended in Complete medium and washed by centrifugation. To allow tumorspheres to form, cells were plated at a density of 105 cells per 60-mm petri dish and either treated with 40 µM curcumin after four days of plating or treated with 60 µM curcumin at the time of plating and then incubated for 30 hrs, rinsed, and imaged.
Tumorsphere proliferation
To compare the growth of cells derived from dissociated tumorspheres that were made from YES-2CSC with the ones made from the original YES-2CSC cell line, tumorspheres were enzymatically dissociated as described above, and 103 cells/well were cultured in 12-well plates (Corning Life Sciences). The YES-2CSC line was plated at the same density. The cells were incubated for 10 days at 37°C in 5% CO2. Cell proliferation was assayed with the crystal violet staining method as described previously 28.
Statistical analysis
Statistical analyses were performed using OriginPro 7.5 (OriginLab). Statistical comparisons between two groups were made using Student's t-test. For comparing more than two groups, one-way analysis of variance (ANOVA) was used followed by the Scheffe multiple comparisons test with a significance of p<0.05. Variance was indicted as standard error of the mean (SE).
Results
Isolation of cancer stem cells using Aldefluor and FACS
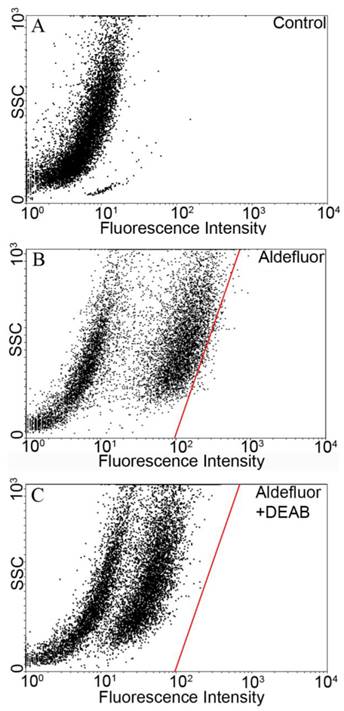
The Aldefluor assay was used to assess the presence of the subpopulation with high-ALDH enzyme activity within the YES-2 cell line. Cell suspensions were exposed to Aldefluor and then sorted by FACS to count and collect the CSCs. Cell sorting results without Aldefluor treatment (control) is shown in Figure 1A. A subpopulation with distinct fluorescence was present after Aldefluor treatment (Figure 1B). When the ALDH inhibitor DEAB was applied at the concentration suggested by the manufacturer (and also used by others 46-48) fluorescence was reduced (shifted to the left) and a gate was drawn to delineate the upper limit of these cells (Figure 1C). This gate, also shown in Figure 1B, was used to select for the ALDH high-staining subpopulation in the following cell sorting which used Aldefluor alone. The percentage of these highly fluorescent cells was 1.2% of the YES-2 cell line and these cells were considered the most stem-like cell subpopulation (YES-2CSC).
Flow cytometric isolation of cancer stem cells based on ALDH activity. A: untreated control cells. B: Aldefluor-treated YES-2 cells in the absence of ALDH enzyme inhibitor DEAB. C: Aldefluor-treated YES-2 cells in the presence of DEAB. The red line shows the gate used to select for cells with high ALDH activity. SSC: side scatter.
Detection of Aldefluor fluorescence in attached ESCC cell lines
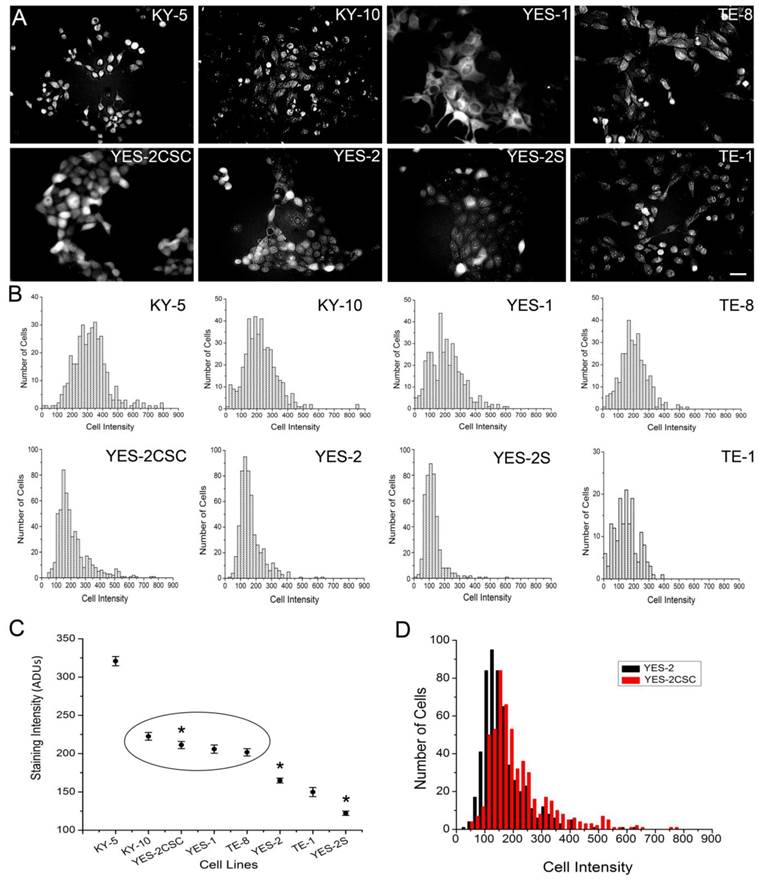
To identify CSCs in monolayer cultures, we applied Aldefluor to the attached ESCC cell lines. Fluorescence staining was detected in the cytoplasm of all eight lines, including the YES-2CSC and YES-2S cell lines as shown in Figure 2A. Measuring the staining intensity of ALDH activity of individual cells indicated significant differences among the mean intensities of the cell lines (ANOVA, F=151.968, p<0.0001) (Figure 2B). The order from high to low mean staining intensity was as follows: KY-5, KY-10, YES-2CSC, YES-1, TE-8, YES-2, TE-1, YES-2S (Figure 2C). KY-5 cells had significantly higher mean Aldeflour staining than all the other cell lines (0<0.05, Scheffe test). The range was 122 ±2.82 (YES-2S) to 320 ±6.01 (KY-5) analog-to-digital units (ADUs). There was no significant difference between KY-10, YES-2CSC, YES-1, and TE-8, whereas all of the other lines were distinctly different from each other and from this intermediate group. When YES-2 and the two YES-2-derived lines were compared, they were found to be significantly different (ANOVA, F=136.5, p<0.0001). YES-2CSC had significantly higher ALDH activity than the original YES-2 line (Figure 2D), which was in turn higher than the curcumin-surviving line YES-2S (p<0.05).
Fluorescence intensity of ALDH1 reaction product in ESCC lines. A: Fluorescence in the ESCC lines, including YES-2CSC and YES-2S, after Aldefluor was applied to attached cells growing in culture. Scale bar = 100 µm B: Histograms showing the distribution of relative ALDH activity in the ESCC lines. C: Mean intensity of all ESCC lines. YES-2CSC is enriched in CSCs, and YES-2S is CSC-depleted. Oval indicates lines that are not significantly different from each other. Asterisks indicate the significantly different YES-2 lines. D: YES-2CSC compared with YES-2 to indicate the increase in stem-like cells in YES-2CSC. ADUs = Analog-to-digital units
CD44 expression in YES-2 cell lines
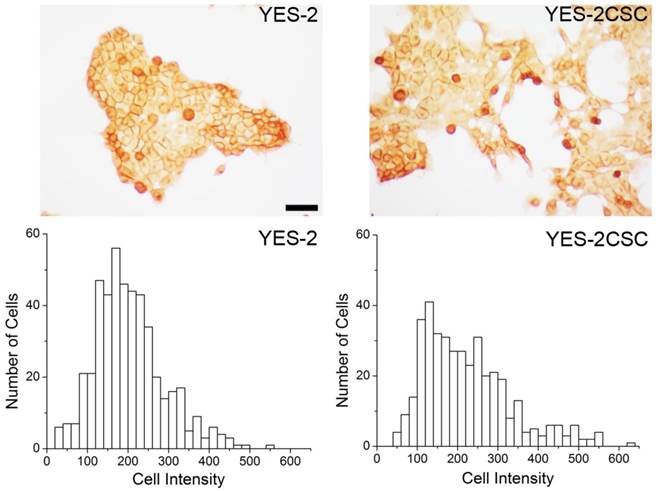
As a second measure of stemness, immunostaining for the CSC marker CD44 was used. YES-2CSC and the original line exhibited distinct high and low-staining cells. The mean intensity between the sorted (YES-2CSC) and original (YES-2) cell lines was significantly different based on t-test (two-tailed, t=-2.919, p=0.0036). YES-2CSC showed a higher percentage of positive cells (Figure 3).
CD44 immunocytochemistry. Above: CD44-stained cells are visible in YES-2 and in the YES-2CSC line which has high-Aldefluor staining as selected by FACS. Below: High CD44-staining cells are more abundant in the YES-2CSC line than in the YES-2 line. Scale bar = 100 µm
Formation of tumorspheres
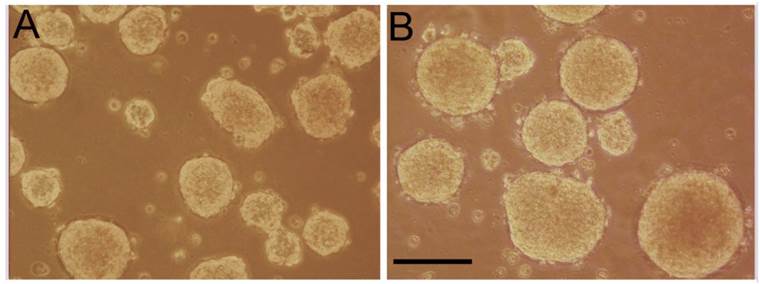
Tumorspheres were formed from YES-2CSC in two different ways: Cells were either grown in a standard CSC medium in low-attachment plates (Figure 4B) or in Complete medium in Petri plates (Figure 4A). In both cases, tumorspheres formed readily within one week. The tumorspheres formed in Complete medium were more numerous, but the CSC-medium tumorspheres were significantly more circular according to ImageJ (0.923 ±0.0049 vs. 0.887 ±0.0053, t-test, t=-4.949, p<0.0001). The average number of tumorspheres identified in Complete medium was higher (74 ±3.21) than in the CSC-medium (28.3 ±1.20), n=3 plates each. When tumorspheres made from YES-2CSC were dissociated and plated in Complete medium, the resulting monolayer cultures proliferated about twice as fast as monolayer cultures derived from the original YES-2CSC line during 10 days of culture (0.0880 ±0.00221 vs. 0.0401 ±0.00477, t= -9.11, p<0.0001).
Tumorspheres derived from YES-2CSC. YES-2CSC cells form tumorspheres when cultured in Complete medium in a Petri dish (A) or in CSC medium in a low-attachment plate (B). Scale bar = 100 µm
Live tumorspheres labeled with Aldefluor
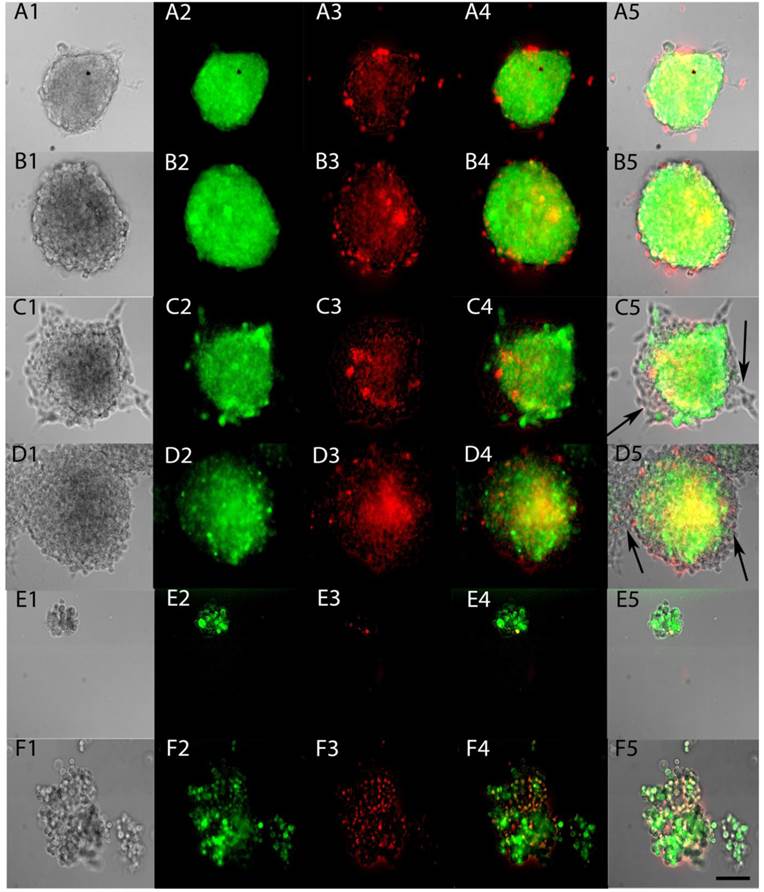
To test whether ACAM would effectively identify the stem-like cells within tumorspheres, Aldefluor was applied to tumorspheres made from YES-2CSC in Complete medium and in CSC medium. The entire sphere showed the fluorescent product of Aldefluor in both media (Figure 5A and 5B) and in all tumorspheres examined. When tumorspheres were allowed to partially differentiate on a glass surface, the cells proliferating from the tumorspheres were not stained with Aldefluor (Figure 5C and 5D). These results indicate that Aldefluor selects for the more stem-like cells within the remaining tumorsphere that have not differentiated. To better image individual cells from the tumorspheres, centrifugation was used to gently disrupt tumorspheres, the resulting cells were imaged immediately and found to only be distinguishable by their distinct high or low-fluorescence (Figure 5E and 5F).
ALDH activity of live tumorspheres. Tumorspheres were grown in Complete medium (A) or CSC medium (B), as in Figure 4, and then tested for ALDH activity by applying Aldefluor for 45 min (A2, B2). Propidium iodide fluorescence indicated dying cells (A3, B3). Merged fluorescence is shown in A4, B4 and as an overlay in A5, B5. Tumorspheres were allowed to attach to glass coverslips for 12 hrs in Complete medium (C1-5) and CSC medium (D1-5). Differentiated cells present at the edges of both types of tumorspheres were not stained after applying Aldefluor (arrows). Sphere fragments contained both high and low-Aldefluor staining in Complete medium (E1-5) and CSC medium (F1-5). Scale bar = 100 µm
Sphere inhibition by curcumin treatments
To determine the effect of curcumin on tumorspheres enriched with stem cells, YES-2CSC tumorspheres that developed in culture for 10 days were treated with 40 or 60 µM curcumin for 30 hrs. Sphere cultures were examined immediately after treatments and 4 days later. These primary tumorspheres are shown in Figure 6, left panel. Tumorspheres had more irregular margins when imaged after 30 hrs of 40 µM (Figure 6A) or 60 µM (Figure 6B) curcumin or, instead, 4 days after 30 hrs of 60 µM curcumin (Figure 6C). Control tumorspheres were imaged immediately (Figure 6D and 6E) and 4 days after treatment with 30 hrs of 0.2% DMSO (vehicle) in medium (Figure 6F). Also, 40 µM curcumin for 30 hrs significantly reduced the number of tumorspheres from (393 ±14.26) before to (162 ±20.69) after treatment (p= 0.001, t=9.192, n=3 plates).
Effects of curcumin on primary and secondary tumorspheres. Left: Primary tumorspheres immediately after 40 µM (A) or 60 µM (B) 30-hr curcumin treatment and 4 days after 60 µM 30-hr treatment (C). Control YES-2CSC tumorspheres immediately after treatment with vehicle alone for 30 hrs (D, E) and 4 days later (F). Note the irregular appearance of the treated tumorspheres. Right: Secondary tumorspheres, made from dissociated primary tumorspheres, treated with 40 µM curcumin for 30 hrs 4 days after cell plating (G). Other tumorspheres treated with 60 µM curcumin for 30 hrs at the time of plating and imaged immediately (H) or 4 days later (I). Control secondary tumorspheres imaged after 30 hrs of DMSO that was given after 4 days of growth (J) or when the cells were plated (K). Unlike the treated cells, control secondary sphere cells given 30 hrs of DMSO at the time of plating and then imaged 4 days later formed tumorspheres (L). Scale bar = 100 µm.
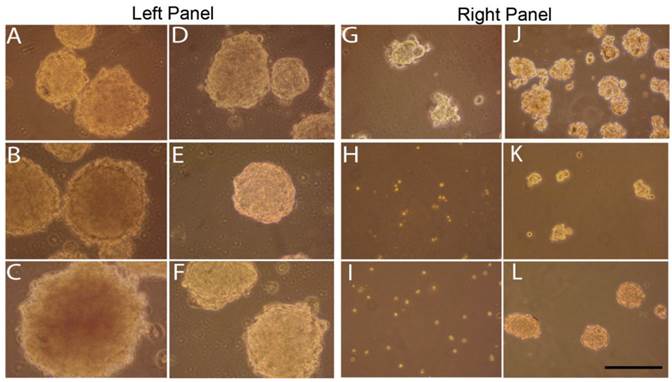
We also examined secondary tumorspheres that were formed from trypsin-dissociated tumorspheres (Figure 6, right panel). After 4 days of culture, these tumorspheres were treated with 40 µM curcumin for 30 hrs causing them to become so irregularly-shaped (Figure 6G) relative to the control (Figure 6J) that they could not be counted reliably as spheres. Cells from dissociated tumorspheres were treated with 60 µM curcumin for 30 hrs at the time the cells were plated. This treatment prevented tumorspheres from forming when imaged immediately after (Figure 6H) and 4 days later (Figure 6I) relative to controls (Figure 6K and 6L), respectively.
Discussion
Among the few current methods available to distinguish the stem-like cells from the remaining cancer cells is ALDH immunocytochemistry 28 or the standard Aldefluor enzyme assay. During the Aldefluor assay, a fluorescent product is deposited in live cells in response to the high ALDH content of CSCs. We expected the fluorescence intensity to vary because ALDH activity varies between CSCs due to differences in their differentiation state. The distribution of high Aldefluor-staining cells we detected by FACS in the YES-2 line is best explained by a variation in stem-like properties, as found in other cancer lines 49.
When the ALDH1 inhibitor DEAB was used in the assay, cell fluorescence decreased substantially but remained above the unstained cell population that consists of non-CSCs. It appears that stemness varies continuously in this cell line, and possibly others, as indicated by the range of Aldefluor staining in the ACAM histograms (Figure 2). By selecting for only the cells at the upper range of Aldefluor fluorescence, where no cells remained in the DEAB-treated assay, we generated an additional cell line (YES-2CSC) that contains, conservatively, the most stem-like component of the YES-2 line. We suspect that many of the cells that stain less effectively can be considered the progenitor cells that are generated from CSCs and then proliferate and further differentiate to form the bulk of tumors 50, 51. Similar low-staining populations were present in other studies using DEAB with Aldefluor 46-48, 52, further supporting the idea that these are progenitor cells with lower ALDH activity relative to CSCs. To confirm this possibility of using Aldefluor to identify progenitor cells, additional studies should examine co-localization of Aldefluor with a second stem cell marker, such as CD44, to test for a decline in both markers within these putative progenitor cells in relation to the expression levels in CSCs.
This heterogeneity of cells stained within the Aldefluor assay suggested initially that cells of a distinctly different morphology may be present in cancer cell lines and that the fluorescence intensity may correlate with cell shape. To address this possibility, the Aldefluor substrate was applied to six ESCC cell lines using ACAM. We observed both high and low-staining cells, but no cells of a distinctly different shape or size were distinguishable by ACAM in this cancer cell type.
When the cell lines were arranged according to mean fluorescent intensity, the order was similar to that of a previous study in which ALDH1A1 immunocytochemistry was used to characterize these cell lines 28, verifying the accuracy of ACAM at distinguishing between cell lines according to their CSC content. Specifically, the highest and lowest staining cell lines were the same in both assays, although not all intermediate-staining lines followed the same order. It should be noted that ACAM is particularly useful with epithelial cells such as the ESCC lines because they readily form a monolayer in culture.
Because this is the first reported use of Aldefluor in an attached-cell assay of stemness, we examined how it might be an alternative and complementary method to standard Aldefluor flow cytometry. First, we considered the limitations of the standard method. In addition to a lack of validation for some types of cancer stem cells, there are several other drawbacks and limitations to the Aldefluor procedure concerning the handling of the cells during the assay. During the standard Aldefluor procedure, suspended cells are subjected to increased cell stress in response to physiological or environmental effects that monolayers do not experience. The suspended cells are incubated with the reagent for 30 to 60 min and are then kept on ice until cell sorting, a step that will affect overall enzyme activity. The cell aggregation produced during centrifugation and processing could cause poor access to oxygen or glucose and buildup of lactic acid and CO2 near the cells. Excessive CO2 levels produce respiratory acidosis that alters cell metabolism 27. In fact, these stressors could act differentially on CSCs and non-CSCs resulting in an altered ratio of these two subpopulations. Another known effect of the standard Aldefluor assay is the intentional inhibition of the multidrug-resistance transporter system 16. When the reagent is added, the efflux is specifically inhibited in the suspended cells by the Aldefluor Buffer and this suppression of the transporter can alter cell physiology during sorting, whereas ACAM does not require the inhibitor during imaging thus avoiding its potential side effects. Taken together, these reasons provide adequate incentive to further develop ACAM as an alternative and complementary method to the standard flow cytometry method with Aldefluor.
To further verify the accuracy of using Aldefluor on attached cells, the Aldefluor substrate was also applied to the original line, the curcumin-surviving line, and the CSC-sorted cell line (YES-2, YES-2S, and YES-2CSC, respectively). The results showed that YES-2CSC had higher Aldefluor staining than the other cell lines and the curcumin-surviving cells had the lowest. These results indicate that ACAM is advantageous for detecting CSCs in adherent cells.
CD44 is a commonly expressed CSC marker that is observed in many cancer cell lines, including ESCC, and is also identifiable by immunostaining or FACS 28, 53, 54. The positive CD44 cells detected in the YES-2 and YES-2CSC lines confirm our results from ACAM and Aldefluor-based FACS. The YES-2CSCs showed more CD44 staining than the original YES-2 line and had higher mean fluorescence using ACAM, indicating again that ACAM is able to quantify the stem-like state of a cancer cell line that has been enriched in CSCs using FACS.
We also tested ACAM as a method to identify CSCs in tumorspheres using Aldefluor. A few studies have used Aldefluor to detect CSCs in cell suspension made from tumorspheres 39, 40, but no prior studies have used Aldefluor to stain the intact sphere. The results of the current report show the feasibility of this approach. When tumorspheres were grown by two different methods and then allowed to partially differentiate, Aldefluor treatment stained a major portion of all of the tumorspheres, but differentiating cells at the margin of the tumorspheres did not stain (Figure 5). To determine whether the differential staining we observed in monolayers of ESCC cells would be present in cells growing as tumorspheres, we applied Aldefluor to fragments produced by gentle centrifugation of tumorspheres, and again both high and low-staining cells were present. These initial results suggest that Aldefluor staining may also distinguish between CSCs, progenitor cells, and more differentiated cells within tumorspheres based on staining intensity (Figure 5).
The stemness and number of CSCs that remains in a cell line previously enriched in CSCs could change spontaneously during repeated passaging. The number of YES2-CSC passages used in the tumorsphere experiments ranged from 2 to 9 (average 5.8), whereas the ACAM and CD44 experiments used YES2-CSC cells after only 2 to 4 passages. Nevertheless, the ability to form primary and secondary spheres (Figure 6), which is an indicator of stemness, was not lost during passaging. Therefore, any ability of one cell subpopulation within YES2-CSC to grow faster and alter the CSC content of the cell line was not obvious from these results.
Tumorspheres enriched in CSCs can be formed when cancer cells are cultured in serum-free medium supplemented with growth factors, specifically bFGF and EGF, during culture in low-attachment plates 55. Although use of this culture technique with CSC medium is effective, it is costly and therefore less accessible than other cell culture methods. Our study discovered that use of standard CSC media with low-attachment plates is not required for sphere formation from the YES-2CSC cell line. As a more affordable alternative, we showed that ultralow-attachment plates could be replaced with a standard non-cell culture Petri dish when the CSC medium is replaced with Complete medium which contains FBS. In contrast, when CSC medium was used with the Petri dish the cells attached and differentiated and no tumorspheres formed (data not shown). The new method yielded more tumorspheres than the standard method, and when dissociated the cells proliferated faster than the original YES-2CSC line, suggesting that these tumorspheres had high CSCs content.
Although tumorspheres formed by the two methods appear to be very similar, the new method could have produced tumorspheres with fewer CSCs. To further test tumorspheres made by the new method, we prepared tumorspheres from the YES-2CSC line in Complete medium and treated them with curcumin which is reported to more effectively eliminate CSCs than non-stem cells in different cancer cell types 56, 57. For example, our previous research showed a reduction in ALDH1A1-positive cells in six curcumin-surviving ESCC lines by immunocytochemistry 28. Curcumin causes cell death in a variety of ways by targeting, membrane receptors, cytokines, kinases, and transcription factors 34. Moreover, curcumin effects seem to persist despite the typical chemo-resistant capabilities of CSCs and even select against CSCs, significantly reducing the number of cells showing CSC-markers in colon, glioma, and ESCC lines 28, 56, 57.
Our result showed that curcumin at 60 µM prevented secondary sphere formation from tumorspheres formed by the new method and 40 µM produced irregularly shaped spheres. These poorly shaped spheres suggest that cell interactions or extracellular matrix through which CSCs communicate may be disrupted. A recent study by Subramaniam, et al., 58 showed that curcumin treatment significantly reduces both primary and secondary sphere formation in a dose dependent manner in two ESCCs (TE-7 and TE-10). Similarly, we found that initial formation of secondary tumorspheres made by the new method was as effectively eliminated by 60 µM curcumin as tumorspheres made by the standard method that were given 50 µM curcumin, as reported previously 58. Based on these inhibitory effects of curcumin the new method likely produces tumorspheres enriched in CSCs. Furthermore, tumorspheres formed by both the new and standard methods were indistinguishable when stained by Aldefluor. Using another approach, Aldefluor has been shown to stain live neural stem and progenitor cells in the subventricular zone of mouse brain following intraventricular injection of the reagent 59, supporting novel use of Aldefluor, including ACAM, for identifying CSCs by microscopy.
Conclusion
Our study demonstrated the feasibility of identifying CSCs by using Aldefluor to stain live attached cells growing as monolayers. The benefit of detecting CSCs in attached cells with Aldefluor, rather than in cell suspensions, is that the cells can be imaged directly to evaluate morphology and intracellular dynamics of live cells. We also introduced and evaluated an alternative method for forming tumorspheres using ordinary Petri dishes and Complete medium. The finding that both YES-2CSC monolayers and tumorspheres are sensitive to curcumin provides further evidence that one of the mechanisms by which curcumin inhibits cancer cell growth is by targeting CSCs. It is likely that the two new methods introduced in this paper for detecting CSCs and producing tumorspheres would be valuable when used in CSC studies of other cancers.
Acknowledgements
This research was supported by the College of Health and Human Services and the Departments of Public and Allied Health and Biological Sciences, Bowling Green State University.
Competing Interests
The authors have declared that no competing interest exists.
References
1. Clarke MF, Dick JE, Dirks PB, Eaves CJ, Jamieson CH, Jones DL, Visvader J, Weissman IL, Wahl GM. Cancer stem cells--perspectives on current status and future directions: AACR Workshop on cancer stem cells. Cancer research. 2006;66:9339-44
2. Dalerba P, Cho RW, Clarke MF. Cancer stem cells: models and concepts. Annu Rev Med. 2007;58:267-84
3. D'Angelo RC, Wicha MS. Stem cells in normal development and cancer. Prog Mol Biol Transl Sci. 2010;95:113-58
4. Visvader JE, Lindeman GJ. Cancer stem cells in solid tumours: accumulating evidence and unresolved questions. Nat Rev Cancer. 2008;8:755-68
5. Reya T, Morrison SJ, Clarke MF, Weissman IL. Stem cells, cancer, and cancer stem cells. Nature. 2001;414:105-11
6. Schatton T, Frank MH. Cancer stem cells and human malignant melanoma. Pigment Cell Melanoma Res. 2008;21:39-55
7. Dean M, Fojo T, Bates S. Tumour stem cells and drug resistance. Nat Rev Cancer. 2005;5:275-84
8. Tang C, Ang BT, Pervaiz S. Cancer stem cell: target for anti-cancer therapy. FASEB J. 2007;21:3777-85
9. Takaishi S, Okumura T, Tu S, Wang SS, Shibata W, Vigneshwaran R, Gordon SA, Shimada Y, Wang TC. Identification of gastric cancer stem cells using the cell surface marker CD44. Stem Cells. 2009;27:1006-20
10. Zeppernick F, Ahmadi R, Campos B, Dictus C, Helmke BM, Becker N, Lichter P, Unterberg A, Radlwimmer B, Herold-Mende CC. Stem cell marker CD133 affects clinical outcome in glioma patients. Clinical cancer research: an official journal of the American Association for Cancer Research. 2008;14:123-9
11. Wright MH, Calcagno AM, Salcido CD, Carlson MD, Ambudkar SV, Varticovski L. Brca1 breast tumors contain distinct CD44+/CD24- and CD133+ cells with cancer stem cell characteristics. Breast Cancer Res. 2008;10:R10
12. Kondo T, Setoguchi T, Taga T. Persistence of a small subpopulation of cancer stem-like cells in the C6 glioma cell line. Proceedings of the National Academy of Sciences of the United States of America. 2004;101:781-6
13. Siemann DW, Keng PC. Cell cycle specific toxicity of the Hoechst 33342 stain in untreated or irradiated murine tumor cells. Cancer research. 1986;46:3556-9
14. Erba E, Ubezio P, Broggini M, Ponti M, D'Incalci M. DNA damage, cytotoxic effect and cell-cycle perturbation of Hoechst 33342 on L1210 cells in vitro. Cytometry. 1988;9:1-6
15. Cheung AM, Wan TS, Leung JC, Chan LY, Huang H, Kwong YL, Liang R, Leung AY. Aldehyde dehydrogenase activity in leukemic blasts defines a subgroup of acute myeloid leukemia with adverse prognosis and superior NOD/SCID engrafting potential. Leukemia. 2007;21:1423-30
16. Storms RW, Trujillo AP, Springer JB, Shah L, Colvin OM, Ludeman SM, Smith C. Isolation of primitive human hematopoietic progenitors on the basis of aldehyde dehydrogenase activity. Proceedings of the National Academy of Sciences of the United States of America. 1999;96:9118-23
17. Moreb JS. Aldehyde dehydrogenase as a marker for stem cells. Curr Stem Cell Res Ther. 2008;3:237-46
18. Jiang F, Qiu Q, Khanna A, Todd NW, Deepak J, Xing L, Wang H, Liu Z, Su Y, Stass SA, Katz RL. Aldehyde dehydrogenase 1 is a tumor stem cell-associated marker in lung cancer. Mol Cancer Res. 2009;7:330-8
19. Li T, Su Y, Mei Y, Leng Q, Leng B, Liu Z, Stass SA, Jiang F. ALDH1A1 is a marker for malignant prostate stem cells and predictor of prostate cancer patients' outcome. Lab Invest. 2010;90:234-44
20. Charafe-Jauffret E, Ginestier C, Iovino F, Tarpin C, Diebel M, Esterni B, Houvenaeghel G, Extra JM, Bertucci F, Jacquemier J, Xerri L, Dontu G. et al. Aldehyde dehydrogenase 1-positive cancer stem cells mediate metastasis and poor clinical outcome in inflammatory breast cancer. Clin Cancer Res. 2010;16:45-55
21. Huang EH, Hynes MJ, Zhang T, Ginestier C, Dontu G, Appelman H, Fields JZ, Wicha MS, Boman BM. Aldehyde dehydrogenase 1 is a marker for normal and malignant human colonic stem cells (SC) and tracks SC overpopulation during colon tumorigenesis. Cancer Res. 2009;69:3382-9
22. Su Y, Qiu Q, Zhang X, Jiang Z, Leng Q, Liu Z, Stass SA, Jiang F. Aldehyde dehydrogenase 1 A1-positive cell population is enriched in tumor-initiating cells and associated with progression of bladder cancer. Cancer Epidemiol Biomarkers Prev. 2010;19:327-37
23. Keysar SB, Jimeno A. More than markers: biological significance of cancer stem cell-defining molecules. Molecular cancer therapeutics. 2010;9:2450-7
24. Orfao A, Ruiz-Arguelles A. General concepts about cell sorting techniques. Clin Biochem. 1996;29:5-9
25. Pollard SM, Yoshikawa K, Clarke ID, Danovi D, Stricker S, Russell R, Bayani J, Head R, Lee M, Bernstein M, Squire JA, Smith A. et al. Glioma stem cell lines expanded in adherent culture have tumor-specific phenotypes and are suitable for chemical and genetic screens. Cell stem cell. 2009;4:568-80
26. Fael Al-Mayhani TM, Ball SL, Zhao JW, Fawcett J, Ichimura K, Collins PV, Watts C. An efficient method for derivation and propagation of glioblastoma cell lines that conserves the molecular profile of their original tumours. J Neurosci Methods. 2009;176:192-9
27. Hirschhaeuser F, Menne H, Dittfeld C, West J, Mueller-Klieser W, Kunz-Schughart LA. Multicellular tumor spheroids: an underestimated tool is catching up again. J Biotechnol. 2010;148:3-15
28. Almanaa TN, Geusz ME, Jamasbi RJ. Effects of curcumin on stem-like cells in human esophageal squamous carcinoma cell lines. BMC Complement Altern Med. 2012;12:195
29. Moragoda L, Jaszewski R, Majumdar AP. Curcumin induced modulation of cell cycle and apoptosis in gastric and colon cancer cells. Anticancer Res. 2001;21:873-8
30. Chen A, Xu J, Johnson AC. Curcumin inhibits human colon cancer cell growth by suppressing gene expression of epidermal growth factor receptor through reducing the activity of the transcription factor Egr-1. Oncogene. 2006;25:278-87
31. O'Sullivan-Coyne G, O'Sullivan GC, O'Donovan TR, Piwocka K, McKenna SL. Curcumin induces apoptosis-independent death in oesophageal cancer cells. Br J Cancer. 2009;101:1585-95
32. Hartojo W, Silvers AL, Thomas DG, Seder CW, Lin L, Rao H, Wang Z, Greenson JK, Giordano TJ, Orringer MB, Rehemtulla A, Bhojani MS, Beer DG, Chang AC. Curcumin promotes apoptosis, increases chemosensitivity, and inhibits nuclear factor kappaB in esophageal adenocarcinoma. Transl Oncol. 2010;3:99-108
33. Zhang XZ, Li XJ, Zhang HY. Curcumin's potential to modulate stem cell fate. Trends Pharmacol Sci. 2009;30:331-2
34. Anand P, Sundaram C, Jhurani S, Kunnumakkara AB, Aggarwal BB. Curcumin and cancer: an "old-age" disease with an "age-old" solution. Cancer Lett. 2008;267:133-64
35. Yan D, Geusz ME, Jamasbi RJ. Properties of lewis lung carcinoma cells surviving curcumin toxicity. J Cancer. 2012;3:32-41
36. Zhang L, Jiao M, Li L, Wu D, Wu K, Li X, Zhu G, Dang Q, Wang X, Hsieh JT, He D. Tumorspheres derived from prostate cancer cells possess chemoresistant and cancer stem cell properties. Journal of cancer research and clinical oncology. 2012;138:675-86
37. Cao L, Zhou Y, Zhai B, Liao J, Xu W, Zhang R, Li J, Zhang Y, Chen L, Qian H, Wu M, Yin Z. Sphere-forming cell subpopulations with cancer stem cell properties in human hepatoma cell lines. BMC Gastroenterol. 2011;11:71
38. Levina V, Marrangoni A, Wang T, Parikh S, Su Y, Herberman R, Lokshin A, Gorelik E. Elimination of human lung cancer stem cells through targeting of the stem cell factor-c-kit autocrine signaling loop. Cancer research. 2010;70:338-46
39. Saw YT, Yang J, Ng SK, Liu S, Singh S, Singh M, Welch WR, Tsuda H, Fong WP, Thompson D, Vasiliou V, Berkowitz RS. et al. Characterization of aldehyde dehydrogenase isozymes in ovarian cancer tissues and sphere cultures. BMC Cancer. 2012;12:329
40. Liang D, Shi Y. Aldehyde dehydrogenase-1 is a specific marker for stem cells in human lung adenocarcinoma. Med Oncol. 2012;29:633-9
41. Shimada Y, Imamura M, Wagata T, Yamaguchi N, Tobe T. Characterization of 21 newly established esophageal cancer cell lines. Cancer. 1992;69:277-84
42. Nakamura M. Establishment and characterization of a new human esophageal cancer cell line (YES-1). Nippon Geka Hokan. 1991;60:3-12
43. Nakamura M, Murakami T, Sakata K, Kusanagi H, Saeki T, Uchisako H, Hayashi H, Tangoku A, Suzuki T. stablishment and Characterization of a New Human Esophageal Cancer Cell Line (YES-2). Bull Yamaguchi Med Sch. 1994;41:149-53
44. Nishihira T, Hashimoto Y, Katayama M, Mori S, Kuroki T. Molecular and cellular features of esophageal cancer cells. J Cancer Res Clin Oncol. 1993;119:441-9
45. Jamasbi RJ, Stoner GD, Foote LJ, Lankford TK, Davern S, Kennel SJ. A monoclonal antibody to a carbohydrate epitope expressed on glycolipid and on alpha3beta1 integrin on human esophageal carcinoma. Hybrid Hybridomics. 2003;22:367-76
46. Awad O, Yustein JT, Shah P, Gul N, Katuri V, O'Neill A, Kong Y, Brown ML, Toretsky JA, Loeb DM. High ALDH activity identifies chemotherapy-resistant Ewing's sarcoma stem cells that retain sensitivity to EWS-FLI1 inhibition. PLoS One. 2010;5:e13943
47. Rasheed ZA, Yang J, Wang Q, Kowalski J, Freed I, Murter C, Hong SM, Koorstra JB, Rajeshkumar NV, He X, Goggins M, Iacobuzio-Donahue C. et al. Prognostic significance of tumorigenic cells with mesenchymal features in pancreatic adenocarcinoma. J Natl Cancer Inst. 2010;102:340-51
48. Visus C, Wang Y, Lozano-Leon A, Ferris RL, Silver S, Szczepanski MJ, Brand RE, Ferrone CR, Whiteside TL, Ferrone S, DeLeo AB, Wang X. Targeting ALDH(bright) human carcinoma-initiating cells with ALDH1A1-specific CD8(+) T cells. Clinical cancer research: an official journal of the American Association for Cancer Research. 2011;17:6174-84
49. Azizi E, Wicha MS. Point: cancer stem cells--the evidence accumulates. Clin Chem. 2013;59:205-7
50. Burger PE, Gupta R, Xiong X, Ontiveros CS, Salm SN, Moscatelli D, Wilson EL. High aldehyde dehydrogenase activity: a novel functional marker of murine prostate stem/progenitor cells. Stem Cells. 2009;27:2220-8
51. Douville J, Beaulieu R, Balicki D. ALDH1 as a functional marker of cancer stem and progenitor cells. Stem Cells Dev. 2009;18:17-25
52. Moreb JS, Ucar D, Han S, Amory JK, Goldstein AS, Ostmark B, Chang LJ. The enzymatic activity of human aldehyde dehydrogenases 1A2 and 2 (ALDH1A2 and ALDH2) is detected by Aldefluor, inhibited by diethylaminobenzaldehyde and has significant effects on cell proliferation and drug resistance. Chem Biol Interact. 2012;195:52-60
53. Jaggupilli A, Elkord E. Significance of CD44 and CD24 as cancer stem cell markers: an enduring ambiguity. Clin Dev Immunol. 2012;2012:708036
54. Zhao JS, Li WJ, Ge D, Zhang PJ, Li JJ, Lu CL, Ji XD, Guan DX, Gao H, Xu LY, Li EM, Soukiasian H. et al. Tumor initiating cells in esophageal squamous cell carcinomas express high levels of CD44. PloS one. 2011;6:e21419
55. Zhong Y, Guan K, Guo S, Zhou C, Wang D, Ma W, Zhang Y, Li C, Zhang S. Spheres derived from the human SK-RC-42 renal cell carcinoma cell line are enriched in cancer stem cells. Cancer letters. 2010;299:150-60
56. Fong D, Yeh A, Naftalovich R, Choi TH, Chan MM. Curcumin inhibits the side population (SP) phenotype of the rat C6 glioma cell line: towards targeting of cancer stem cells with phytochemicals. Cancer Lett. 2010;293:65-72
57. Yu Y, Kanwar SS, Patel BB, Nautiyal J, Sarkar FH, Majumdar AP. Elimination of Colon Cancer Stem-Like Cells by the Combination of Curcumin and FOLFOX. Transl Oncol. 2009;2:321-8
58. Subramaniam D, Ponnurangam S, Ramamoorthy P, Standing D, Battafarano RJ, Anant S, Sharma P. Curcumin induces cell death in esophageal cancer cells through modulating Notch signaling. PloS one. 2012;7:e30590
59. Obermair FJ, Fiorelli R, Schroeter A, Beyeler S, Blatti C, Zoerner B, Thallmair M. A novel classification of quiescent and transit amplifying adult neural stem cells by surface and metabolic markers permits a defined simultaneous isolation. Stem Cell Res. 2010;5:131-43
Author contact
![]() Corresponding author: Roudabeh J. Jamasbi, Professor. Departments of Public and Allied Health & Biological Sciences, 504 Life Sciences Building, Bowling Green State University, Bowling Green, OH 43403, USA. Phone: (419) 372-8724, Fax: (419) 372-2024. Email: rjamasbedu.
Corresponding author: Roudabeh J. Jamasbi, Professor. Departments of Public and Allied Health & Biological Sciences, 504 Life Sciences Building, Bowling Green State University, Bowling Green, OH 43403, USA. Phone: (419) 372-8724, Fax: (419) 372-2024. Email: rjamasbedu.