Impact Factor ISSN: 1837-9664

 Global reach, higher impact
J Cancer 2011; 2:81-89. doi:10.7150/jca.2.81 This volume Cite
Research Paper
Phase I Dose Escalation Study of Sodium Stibogluconate (SSG), a Protein Tyrosine Phosphatase Inhibitor, Combined with Interferon Alpha for Patients with Solid Tumors
Aung Naing1 ![]() , James M. Reuben2
, James M. Reuben2 ![]() , Luis H. Camacho1, Hui Gao2, Bang-Ning Lee2, Evan N. Cohen2, Claire Verschraegen3, Saneese Stephen1, Joann Aaron1, David Hong1, Jennifer Wheler1, Razelle Kurzrock1
, Luis H. Camacho1, Hui Gao2, Bang-Ning Lee2, Evan N. Cohen2, Claire Verschraegen3, Saneese Stephen1, Joann Aaron1, David Hong1, Jennifer Wheler1, Razelle Kurzrock1
1. Department of Investigational Cancer Therapeutics, The University of Texas MD Anderson Cancer Center, Houston Texas, USA
2. Department of Hematopathology, The University of Texas MD Anderson Cancer Center, Houston Texas, USA
3. University of New Mexico Cancer Research and Treatment Center, Albuquerque, NM 87131-0001, USA
Received 2011-1-14; Accepted 2011-2-10; Published 2011-2-10
Abstract
Purpose: Sodium stibogluconate (SSG), a small molecule inhibitor of protein tyrosine phosphatases, combined with IFN-alpha-2b (IFN-α) inhibited solid tumor cell line growth in vitro. We conducted a phase I clinical trial with SSG plus IFN-α in advanced cancer patients to assess tolerance, maximum tolerated dose (MTD) and immune system effects.
Experimental Design: SSG was administered intravenously alone for five days of week 1, cycle 1 (21 days per cycle) and together with IFN-α 2b s (3 million units sc TIW) in week 2, and after a rest during week 3, on a 2-week on/1-week off cycle. SSG dose levels were 400, 600, 900, 1125, and 1350 mg/m2.
Results: Twenty-four patients were studied. Common toxicities included asymptomatic elevated serum lipase, thrombocytopenia, fatigue, fever, chills and anemia. The dose-limiting toxicities (DLT) were hypokalemia, thrombocytopenia, fatigue, pancreatitis and skin rash. The MTD was 900 mg/m2 SSG and IFN-α, 3 million units TIW. At this dose, patients had a significantly lower number of regulatory T cells (TR Cells) (p = 0.012), myeloid dendritic cells (mDC) (p = 0.028); higher percentage of natural killer (NK) cells that synthesized perforin (p = 0.046) and of plasmacytoid dendritic cells (pDC) that secreted IFN-α (p = 0.018) in response to activation through toll-like receptor (TLR) 7 and TLR 8 by CL097, the highly water-soluble derivative of the imidazoquinoline compound R848.
Conclusions: SSG in combination with IFN-α 2b was well tolerated and augmented cellular immune parameters.
Keywords: sodium stibogluconate, phase 1, interferon alpha, immunity, cancer
INTRODUCTION
Sodium stibogluconate (SSG), a small molecule inhibitor of protein tyrosine phosphatases (PTPases) [1], has been used extensively for the treatment of human leishmaniasis [2,3] and preclinically with demonstrable activity against a murine melanoma cell line [3]. SSG putatively interferes with SHP-1, so that IFN-alpha (IFN-α) remains in the “on” state and inhibits tumorigenesis [4]. IFN-α 2b is FDA-approved for treating solid tumors such as malignant melanoma [5] and AIDS-related Kaposi's sarcoma [6], and hematologic malignancies such as aggressive follicular non-Hodgkin's lymphoma and chronic myelogenous leukemia [7]. However, tumor cell resistance and side effects often limit its clinical efficacy, which is expected to improve at a lower dose and when combined with other therapeutic agents [8,9].
The combination of SSG and IFN α-2b was shown to be effective against larger WM9 tumors in mice and was well tolerated in a long-term treatment course [1]. These preclinical observations suggested an important potential for PTPase inhibitors to improve the efficacy of IFN α-2b. Sodium stibogluconate is an ideal drug to evaluate as an antineoplastic agent in combination with IFN α-2b. We hypothesized that combining SSG and IFN-α 2b would modulate host-immune defense mechanisms and enhance antitumor activity in cancer patients with tumors known to be responsive to IFN-α therapy. Our goals in this phase I, dose-findin g study were to investigate the synergistic antitumor activity of the combination of SSG and IFN-α 2b, delineate the toxicity profile, establish the maximum tolerated dose (MTD), and immune effects in cancer patients.
PATIENTS AND METHODS
Patient eligibility and selection
Inclusion criteria included metastatic or locally advanced solid cancers not responsive to conventional therapy with no established life-prolonging therapy available; age ≥18 years; Eastern Cooperative Oncology Group (ECOG) (performance status 0-2; adequate bone marrow; adequate hepatic status, renal function (creatinine ≤1.5 mg/dL) and cardiac function (ejection fraction >50%); no chemotherapy or radiotherapy 3 weeks before study entry. Exclusion criteria included concurrent immunotherapy, no recovery from acute toxicity of previous therapy, medically uncontrolled cardiovascular illness, electrocardiogram anomalies suggestive of cardiac conduction delay (QTc > 0.47 seconds), past clinically significant cardiac arrhythmias, symptomatic or untreated central nervous system metastases and history of hypersensitivity to IFN-α 2b or SSG or their components.
Treatment/study plan
Sodium stibogluconate (Lenocta™) was supplied by VioQuest Pharmaceuticals, Inc. (Basking Ridge, NJ). Prior to enrollment, patients signed a written, informed consent in accordance with NCI requirements, the MD Anderson Cancer Center Institutional Review Board and the University of New Mexico (UNM) School of Medicine Human Research Review Committee policies.
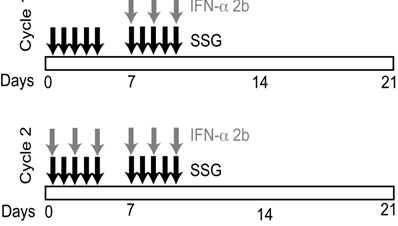
Cohorts of 3 patients each were enrolled using a standard phase I, 3+3 study design. Each cycle consisted of 21 days. During the first week of cycle 1, patients received SSG alone intravenously (IV) over 15 minutes for 5 days (Monday through Friday) (Figure 1). In week 2, cycle 1, patients received SSG IV for 5 days (Monday through Friday), along with 3x10⁶ units of IFN-α 2b subcutaneously (SQ) three times a week (Monday, Wednesday, Friday). Week 3, cycle 1, was a rest period. During cycle 2 and subsequent cycles, patients received SSG IV for 5 days and IFN-α 2b SQ thrice weekly for the first and second weeks of each cycle. The SSG dose was escalated in successive cohorts, with no escalation within cohorts. Cycles continued until disease progression or dose-limiting toxicities(s) (DLT).
Study design and treatment regimen. SSG was administered daily as a monotherapy during the first week of cycle 1. Peripheral blood samples were collected prior to therapy on the second week of cycle 1 (C1D8) to evaluate the effect of SSG. IFN-α 2b was administered 3 times per week beginning the second week of cycle 1. Peripheral blood samples were collected at the end of 2 cycles (C2D12) to evaluate the effect of SSG + IFN-α 2b combination therapy.
Toxicity in each group of 3 patients treated with different dosage levels was graded according to the Common Terminology Criteria for Adverse Events (CTCAE), version 3.0, at the end of each cycle. Even though the traditional definition of DLTs within the first cycle was initially used, we later extended our DLT window to cycle 2 as the cycles were relatively short and only SSG was given during the first week of the first cycle. DLT was defined as any one or more of the following events considered related to treatment with study drug that were grade >3: non-hematologic toxicity, grade 4 hematologic toxicity (neutropenia, anemia or thrombocytopenia), prolongation of QTc to >0.47 seconds, grade 2 or greater cardiovascular arrhythmia, and/or ECG changes associated with T wave inversion with ST segment depression, any grade 4 pancreatic enzyme elevation that lasted longer than 8 days or that was accompanied by clinical symptoms of pancreatitis.
A grade 3 non-hematologic toxicity or grade 4 hematologic toxicity was considered a DLT only after delivery of maximum supportive care. Important medical events other than those listed above were considered a DLT based upon appropriate medical judgment and following discussion among the investigators and the VioQuest medical monitor.
Dose escalation
The starting dose of SSG was 400 mg/m2/day administered daily IV over 15 minutes. With no significant toxicity, the dose for subsequent cohorts was increased by 50% of the preceding dose. If DLTs occurred, the dose in subsequent cohorts was increased by only 25% of the preceding dose. Cohorts of at least 3 patients were treated at each dose level until the MTD was defined. If 1 of 3 patients had a DLT, the cohort was expanded to a maximum of 6 patients. If only 1 of those 6 patients experienced a DLT, the dose for subsequent cohorts was escalated by 25%. If at least 2 patients in a cohort had DLTs, no dose escalation was permitted. The dose level at which 2 of 6 patients experienced a DLT was considered one dose level above the MTD. Table 1 shows the dose escalation scheme for this study.
Dose Escalation Schedule for SSG and Fixed Dose of IFN-α 2b (3 x 10⁶ units) (N = 24 patients)
| Dose of SSG (mg/m2) | N = | DLTs |
|---|---|---|
| 400 | 3 | 0 |
| 600 | 5 | 0 |
| 900 (expansion cohort) | 8 | 0 |
| 1125 | 4 | 3 (symptomatic pancreatitis and thrombocytopenia) |
| 1350 | 4 | 2 (hypokalemia, thrombocytopenia, fatigue and skin rash) |
Duration of therapy
Patients remained on protocol until disease progression, unacceptable adverse events, concurrent illness preventing further administration of drug, or if they had stable disease (SD), a partial response (PR), or a complete response (CR) to treatment, and if there was an acceptable toxicity profile. Patients were taken off study for therapy-related intolerable toxicity, progressive disease, or self-election to withdraw from study.
Clinical response
All patients underwent imaging with computed tomography (CT) scans and/or positron emission tomography (PET), and disease-specific tumor markers whenever applicable. Evaluation for treatment response was done every six weeks using Response Evaluation Criteria in Solid Tumors (RECIST) criteria [10].
Immune monitoring of patients
Patients were assessed prior to initiation of SSG therapy, cycle 1, day 1 (C1D1), at the end of SSG monotherapy (C1D5) and prior to addition of IFN-α on C1D8, at the end of the combination therapy (C1D12), and on C2D12. On days of assessment, patients provided 27 mL of peripheral blood for immune evaluation that included leukocyte immunophenotyping, cytokine syntheses by individual T cells activated through the T-cell receptor (TCR) using anti-CD3 antibodies and by toll-like receptor (TLR)-activated dendritic cells (DC); expression of granzyme B and perforin A by natural killer (NK), natural killer T (NKT) cells, and CD8+ T cells.
Enumeration of leukocyte subsets by flow cytometry
Subsets of T cells (CD4, CD8, and T-regulatory (TR)), B-cells (CD19), and NK cells (CD56/16) cells were determined as previously described [11].
Perforin A and Granzyme A expression by NK and NKT cells
Briefly, peripheral blood lymphocytes were stained for cell surface markers CD3, CD16+56, and CD8 as previously described [11], then permeabilized with BD CytoFix/CytoPerm according to the manufacturer's recommended procedures and stained with FITC conjugated antibodies against granzyme A, perforin or the appropriate isotype-matched control immunoglobin, and analyzed using 6-parameter flow cytometry. Perforin and granzyme expression was recorded as percentage of CD16/56+ (NK) or CD3+16/56+ (NKT) lymphocytes with fluorescent intensity of the perforin or granzyme antibodies greater than isotype-matched control antibodies.
Cytokine synthesis by anti-CD3 activated T cells
Intracellular cytoplasmic interleukin (IL)-2, IL-10, interferon-gamma (IFN-γ), and tumor necrosis factor-alpha (TNF-α) by TCR-activated T cells were measured by a flow cytometric assay as previously described [12].
Quantification of circulating DCs
Subsets of myeloid DCs (mDC/DC1) and plasmacytoid DCs (pDC/DC2) were enumerated as previously reported [13].
Cytokine synthesis by mDC and pDC activated through TLR
Cytokine synthesis by DCs stimulated with 10 µM of CL097, a highly water-soluble derivative of the imidazoquinoline compound R848 (Invivogen, San Diego, CA), was performed as previously described [14]. Similar to R848, CL097 is a TLR7 and TLR8 ligand that induces cytokine syntheses in DCs through the activation of the NF-κB [15,16].
Statistical analysis
Descriptive statistics were used for the patient treatment description. Due to small sample size and non-normal distribution of cytokine production, nonparametric tests compared median values for immunologic analysis. The Friedman test assessed significant rank differences in phenotype and cytokine measures over the study period followed by the Wilcoxon signed-rank test of paired samples to determine differences between specific time points in therapy. The Mann-Whitney U test analyzed differences among different treatment arms, i.e., low-dose SSG (<900 mg/m2) and high-dose (≥900 mg/m2). Graphs were plotted as mean plus or minus standard error to show central tendency and variance.
RESULTS
Patient characteristics
Twenty-four patients (13 men and 11 women) participated in this phase I study (median age of 59.5 years; range, 37-82). Nine patients had an ECOG performance status of 0, and 15 patients had an ECOG of 1. Prior therapies varied from 1 to 10 regimens (median, 4). Various solid tumors were included; most commonly melanoma, pancreatic and colorectal (Table 2).
Patient Characteristics (N = 24)
| Total Pts | 24 | |||
| Median Age | 59.5 | |||
| Range | 37-82 | |||
| Male | 13 | |||
| Female | 11 | |||
| Race | ||||
| White | 22 | |||
| Asian | 1 | |||
| Hispanic | 1 | |||
| ECOG | ||||
| PS= 0 | 9 | |||
| PS=1 | 15 | |||
| Media Prior Regimens | 4 | |||
| Max | 10 | |||
| Min | 1 | |||
| Diagnosis | Number | % | Dosage | Patients |
| Melanoma | 7 | 29 | 400 | 3 |
| Pancreatic | 4 | 17 | 600 | 5 |
| Colorectal | 3 | 13 | 900 | 8 |
| Adenocystic H&N | 2 | 8 | 1125 | 4 |
| Mesothelioma | 1 | 4 | 1350 | 4 |
| Prostate | 1 | 4 | ||
| Neuroendrocrine | 1 | 4 | Total | 24 |
| Ovarian | 1 | 4 | ||
| Squamous Cell H&N | 1 | 4 | ||
| Granulosa Cell | 1 | 4 | ||
| Merkel Cell | 1 | 4 | ||
| Angiosarcoma | 1 | 4 | ||
| Total | 24 | 99 |
PS , performance status; ECOG, Eastern Cooperative Oncology Group; H&N, head and neck
Dose escalation and MTD
Within the SSG 900 mg/m2 cohort, one patient progressed during cycle 1 and was replaced. Because three evaluable patients tolerated the 900 mg/m2 SSG dose, it was increased to 1350 mg/m2, and two patients experienced DLTs. The first patient with DLT had a grade 4 hypokalemia and a grade 4 thrombocytopenia (which did not return to baseline after platelet transfusion). The second patient with DLT had grade 3 fatigue and grade 3 skin rash. Subsequently, an intermediate dose of SSG of 1125 mg/m2 was tested. One patient in this cohort had a grade 2 DLT of clinically symptomatic pancreatitis and the cohort was expanded. Two additional patients had grade 2 pancreatitis and grade 4 thrombocytopenia. Thus, the MTD was set at 900 mg/m2. The cohort was expanded to total of 8 patients. No DLTs were observed.
Safety/Toxicity
Adverse events are shown in Table 3. Despite elevated serum amylase (n=7) and/or lipase (n=16) levels occurring frequently, most patients were asymptomatic; two had clinically significant grade 2 pancreatitis. Fourteen patients completed two cycles and were restaged. One patient with advanced refractory colorectal cancer in the 600 mg/m2 SSG cohort received cycle 3, but withdrew from the study. The second patient with adenocystic carcinoma in the 1350 mg /m2 SSG cohort, also with SD, withdrew from the study due to non-DLT side effects and treatment schedule. A third patient with ocular melanoma in the 400 mg /m2 SSG cohort had SD after two cycles, but withdrew from treatment. The other 11 patients had progressive disease at restaging at the end of cycle 2. Although there was no clinically observable anticancer activity in this study, SSG had significant effects on host-immune responses.
Drug Related Common Side Effects
| Side Effects at Different Dose Levels | ||||||||||||||||||
|---|---|---|---|---|---|---|---|---|---|---|---|---|---|---|---|---|---|---|
| TOTAL DLTS | 400 mg/m2 | 600 mg/m2 | 900 mg/m2 | 1125 mg/m2 | 1350 mg/m2 | |||||||||||||
| Grade | 1-2 | 3 | 4 | 1-2 | 3 | 4 | 1-2 | 3 | 4 | 1-2 | 3 | 4 | 1-2 | 3 | 4 | 1-2 | 3 | 4 |
| Nausea | 6 | 0 | 0 | 1 | 1 | 2 | 1 | 1 | ||||||||||
| Vomiting | 4 | 0 | 0 | 1 | 1 | 1 | 1 | |||||||||||
| Chills | 9 | 1 | 0 | 2 | 4 | 1 | 1 | 1 | 1 | |||||||||
| Fatigue | 7 | 4 | 0 | 2 | 1 | 3 | 1 | 1 | 1 | 1 | 1 | |||||||
| Fever | 10 | 1 | 0 | 1 | 5 | 2 | 1 | 1 | 1 | |||||||||
| Myalgia | 3 | 0 | 0 | 2 | 1 | |||||||||||||
| Rash | 1 | 1 | 0 | 1 | 1 | |||||||||||||
| Anorexia | 5 | 1 | 0 | 1 | 2 | 1 | 1 | 1 | ||||||||||
| Lymphopenia | 4 | 0 | 0 | 4 | ||||||||||||||
| Leukocytes | 4 | 1 | 0 | 1 | 1 | 1 | 2 | |||||||||||
| Neutrophils | 5 | 0 | 0 | 1 | 2 | 2 | ||||||||||||
| Platelets | 3 | 5 | 3 | 1 | 3 | 1 | 2 | 3 | 1 | |||||||||
| Hemoglobin | 3 | 7 | 0 | 1 | 1 | 5 | 2 | 1 | ||||||||||
| Amylase | 3 | 4 | 0 | 1 | 1 | 1 | 1 | 1 | 1 | 1 | ||||||||
| Lipase | 4 | 7 | 5 | 1 | 1 | 2 | 1 | 2 | 3 | 1 | 1 | 1 | 2 | 1 | ||||
| Potassium, Serum Low | 2 | 4 | 2 | 1 | 2 | 1 | 2 | 1 | 1 | |||||||||
| Pancreatitis | 2 | 0 | 0 | 2 | ||||||||||||||
Enumeration of leukocyte subsets by flow cytometry
Seventeen patients were evaluated for immune studies. For the immunology data analysis, patients who received SSG <900 mg/m2 (n=8) were defined as the low-dose SSG cohort, and patients who received a dose of SSG ≥900 mg/m2 were defined the high-dose SSG cohort (n=9).
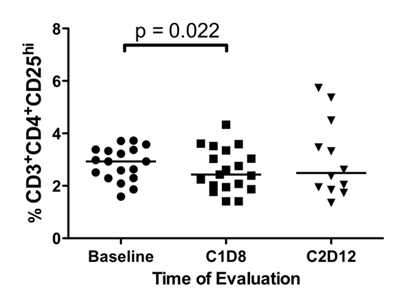
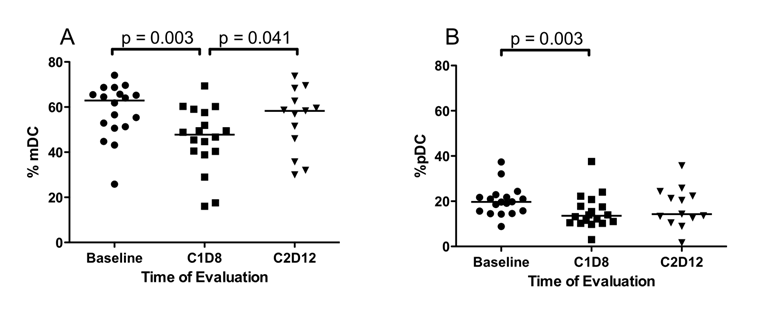
Initially, the effect of SSG monotherapy, C1D1 vs. C1D8, and the effect of SSG in combination with IFN-α (C1D8 vs. C2D12) were assessed in all patients. After SSG monotherapy, median %TR cells (p = 0.022) (Figure 2), median %mDC (p = 0.003) (Figure 3A) and median %pDC (p = 0.022) (Figure 3B) significantly decreased, but following combination therapy median %mDC (p = 0.041) significantly increased (Figure 3A). In patients receiving low-dose SSG monotherapy, there were statistically significant reductions in the median %CD4+ T cells (43.7% vs. 41.1%, p = 0.036) and median %TR cells (2.5% vs. 2.0%, p = 0.017), but statistically significant increases in median %NK cells (17.6% vs. 22.3%, p =0.05). Following combination therapy the median %mDC increased (47.8% vs. 58.3%, p = 0.028). However, in patients receiving high-dose SSG there were no statistically significant changes in median %CD4+ T (49.0% vs. 49.9%, p = 0.575), median %TR cells (3.4% vs. 3.0%, p = 0.444), and median %NK cells (16.6% vs. 14.4%, p = 0.721). Following combination therapy the median %mDC increased in patients receiving low-dose SSG (47.8% vs. 58.3%, p = 0.028), and although there was a similar trend in patients receiving high-dose SSG, it was not statistically significant (45.0% vs. 55.0%, p = 0.893).
Differences in the percentage of CD4+CD25hi TR cells. Fresh peripheral blood samples were evaluated by flow cytometry for the presence of CD3+CD4+CD25hi TR cells at baseline, following SSG monotherapy (C1D8), and following SSG + IFN-α 2b combination therapy (C2D12). There was a significant decrease in the percentage of CD3+CD4+CD25hi TR cells following SSG monotherapy.
Differences in the percentage of dendritic cells. Fresh peripheral blood samples were evaluated by flow cytometry for the presence of Lin-HLA-DR+ dendritic cells at baseline, following SSG monotherapy (C1D8) and following SSG + IFN-α combination therapy (C2D12). (A) Following SSG monotherapy, there was a transient decrease in the percentage of CD11c+CD123- mDC within the Lin-HLA-DR+ population followed by a significant increase with the addition of IFN-α 2b. (B) The percentage of CD11c-CD123+ pDC decrease within the Lin-HLA-DR+ DC population following SSG monotherapy.
Cytokine production by TLR-activated mDC and pDC
In all patients at the end of SSG monotherapy (C1D8) as well at the end of combination therapy (C2D12), there were no significant changes in %mDC and %pDC that synthesized cytokines following activation with the TLR agonist CL097 (data not shown). However, patients who received high-dose SSG had statistically significant increased median %pDC that synthesized IFN-α following activation through TLR7 and TLR8 by CL097 (3.15% vs. 9.09%, p = 0.012). When IFN-α 2b was added to this regimen, the percent of pDC that produced IFN-α increased further but not to statistical significance (9.09% vs. 12.98%, p = 0.0465). The syntheses of IL-10, IL-12, and TNF-α by TLR-activated mDC remained unchanged with high-dose SSG monotherapy or following combination therapy of high-dose SSG and IFN-α 2b in both dose groups. Similarly, SSG alone or in combination with IFN-α 2b did not affect the ability of TCR-activated CD4+ T and CD8+ T cells to synthesize cytokines.
Expression of granzyme B and perforin A by NK, NKT, and CD8+ T cells
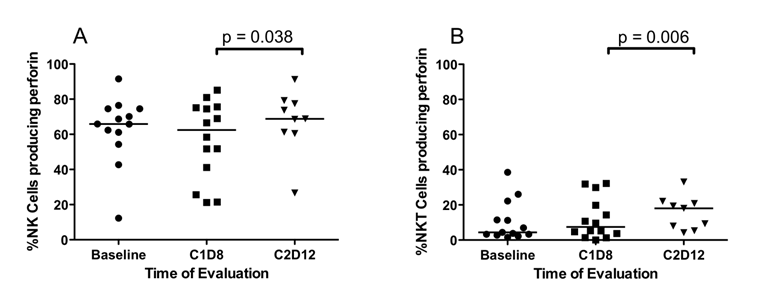
NK, NKT and CD8+ T cells mediate tumor cell cytotoxicity through expression of granzyme B and perforin A. Data on all patients show that SSG alone did not affect the expression of perforin A and granzyme B in NK, NKT, and CD8+ T cells. Following the addition of IFN-α 2b, there was a statistically significant increase in median %NK cells (62.4% vs. 68.8%, p = 0.038) (Figure 4A) and median %NKT cells (7.4% vs. 18.0%, p = 0.006) (Figure 4B), but not in median CD8+ T cells expressing perforin A. Patients receiving high-dose SSG and IFN-α 2b had a higher %NK cells expressing perforin A (66.5% vs. 75.6%, p = 0.028). No differences were observed in expression of granzyme B by NK, NKT, and CD8+ T cells of patients at either dose of SSG.
Differences in the percentage of NK and NKTcells that produced perforin A. Fresh peripheral blood samples were evaluated by flow cytometry for the presence of NK and NKT cells with constitutive perforin A. (A) Perforin expression by NK cells is unaffected by SSG monotherapy (C1D8). Following treatment with both SSG and IFN- α 2b (C2D12), there is a significant increase in the percentage of NK cells expressing perforin A. (B) Similarly in CD3+16/56+ NKT cells, perforin A expression was unaffected by SSG monotherapy but was significantly increased by treatment with both SSG and IFN-α 2b (C2D12).
DISCUSSION
This phase I study investigated the biological activity of SSG in combination with IFN-α 2b to determine toxicity profile, MTD, and immune system effects. All patients had multiple prior treatments. No clinical responses were observed, despite the known biological activity of SSG in a number of animal experimental systems [17] where SSG alone or in combination with IFN-α 2b, demonstrated antitumor activity against prostate cancer xenografts [18]. In another experiment of SSG plus IL-2, antitumor activity against renal cell carcinoma in mice was enhanced and mediated through an immune mechanism involving IFN-γ [19].
Common toxicities included asymptomatic elevated serum lipase, thrombocytopenia, fatigue, fever, chills and anemia. The DLT were hypokalemia, thrombocytopenia, fatigue, pancreatitis and skin rash.
Patients who received high-dose SSG had a statistically significant decrease in the median percentage of pDC at the end of SSG monotherapy with a concomitant statistically significant increase in the median percentage of pDC that produced IFN-α. At the end of cycle 2, day 12, the median percentages of pDC and pDC producing IFN-α were increased. Plasmacytoid dendritic cells are the most potent producers of IFN-α [20-22]. They greatly influence the differentiation of CD4+ T cells towards TH2 responses by producing IL-10 and inhibiting the production of IL-12 by mDC [23], or enhancing the development of TR cells, which, in turn, suppresses antigen-specific immune responses [24]. Conversely, IL-12 production by mDC enhances IFN-γ produced by T cells and NK cells and favors a TH1 immune response [25]. Here, low-dose SSG increased pDC activity as measured by the increased median percentage of TLR-activated pDC that produced IFN-α.
IFN-α also stimulates mDC to stimulate IL-12, which in turn stimulates T-cells to secrete IFN-γ, and arms NK cells and CD8+ cytotoxic T lymphocytes (CTL) with perforin A and granzyme B for killing tumor targets. However, increased production of IFN-α by pDC after SSG monotherapy were insufficient to induce expression of perforin A by NK or NKT cells. Only after IFN-α 2b administration did the median percentages of NK cells and NKT cells that expressed perforin A increase. Thus, the combination of SSG and IFN-α 2b was necessary to induce expression of perforin A by these innate immune cells.
Whereas NK cell activity is associated with innate immunity, CD8+ CTL is required for adaptive immunity. Sustained adaptive immunity depends upon the production of IL-2 by activated CD4+ T cells to sustain T-cell proliferation and the production of IFN-γ by activated macrophages to co-stimulate CD8+ CTL. As TR cells inhibit the production of IL-2 by activated T cells [26], the reduction in TR activity is desirable for an adequate antitumor response. In the current study, administration of low-dose and high-dose SSG alone yielded significantly lower percentages of TR cells. However, IL-2 production by TCR-activated T cells was observed only in patients receiving high-dose SSG, and only after adding IFN-α 2b. Activation of TR cells inhibits production of IL-2 by activated T cells [26]. Although we did not measure circulating levels of IFN-γ, we measured IL-12 produced by mDC following activation through the TLR. IL-12 is responsible for inducing IFN-γ by T cells and NK cells [25]. Unfortunately, SSG alone and in combination with IFN-α 2b failed to significantly augment the percentage of TLR-activated mDC that produced IL-12. This may account for the lack of IFN-γ production by T cells and the resultant lack of antitumor activity in our patients. Others reported increases in plasma levels of IFN-γ and in the percentage of CD4+ T cells that were capable of producing IFN-γ [27] as well as increased IFN-γ mRNA expression by alveolar macrophages following SSG administration [28] in mice.
This study was limited by the lack of a cohort that received IFN-α 2b prior to SSG, which would have permitted comparing IFN-α 2b and SSG as single agents, thereby helping to determine the optimal immune modulatory effect of these two drugs. This was not done because of limitations inherent in a phase I study.
In conclusion, SSG in combination with IFN-α 2b was well tolerated at 900 mg/m2 and demonstrated immune modulation. There was an increase in the proportion of TLR7- and TLR8-activated pDC in patients receiving high-dose SSG that produced IFN-α. These data represent increased adaptive and innate immune responses following therapy with high-dose SSG in combination with IFN-α 2b.
Acknowledgements
Sponsored Research Agreement: VioQuest Pharamceuticals, Inc.
Conflict of Interest
Declared none other than Sponsored Research Agreement with VioQuest Pharamceuticals, Inc.
References
1. Yi T, Pathak MK, Lindner DJ, Ketterer ME, Farver C, Borden EC. Anticancer activity of sodium stibogluconate in synergy with IFNs. J Immunol. 2002;169:5978-5985
2. Berman JD. Chemotherapy for leishmaniasis: biochemical mechanisms, clinical efficacy, and future strategies. Rev Infect Dis. 1988;10:560-586
3. Musa AM, Khalil EA, Mahgoub FA, Elgawi SH, Modabber F, Elkadaru AE, Aboud MH, Noazin S, Ghalib HW, El-Hassan AM. Leishmaniasis Research Group/Sudan. Immunochemotherapy of persistent post-kala-azar dermal leishmaniasis: a novel approach to treatment. Trans R Soc Trop Med Hyg. 2008;102:58-63
4. Myers MP, Andersen JN, Cheng A, Tremblay ML, Horvath CM, Parisien JP, Salmeen A, Barford D, Tonks NK. TYK2 and JAK2 are substrates of protein-tyrosine phosphatase 1B. J Biol Chem. 2001;276:47771-47774
5. Flodgren P, Borgstrom S, Jonsson PE, Lindstron C, Sjogren HO. Metastatic malignant melanoma: regression induced by combined treatment with interferon [HuIFN-alpha(Le)] and cimetidine. Int J Cancer. 1983;132:657-665
6. Volberding P, Valero R, Rothman J, Gee G. Alpha interferon therapy of Kaposi's sarcoma in AIDS. Ann N Y Acad Sci. 1984;437:439-446
7. Talpaz M, Kantarjian HM, McCredie K, Trujillo JM, Keating MJ, Gutterman JU. Hematologic remission and cytogenetic improvement induced by recombinant human interferon alpha A in chronic myelogenous leukemia. N Engl J Med. 1986;314:1065-1069
8. Jonasch E, Haluska FG. Interferon in oncological practice: review of interferon biology, clinical applications, and toxicities. Oncologist. 2001;6:34-55
9. Masci P, Bukowski RM, Patten PA, Osborn BL, Borden EC. New and modified interferon alfas: preclinical and clinical data. Curr Oncol Rep. 2003;5:108-113
10. Therasse P, Arbuck SG, Eisenhauer EA, Wanders J, Kaplan RS, Rubinstein L, Verweij J, Van Glabbeke M, van Oosterom AT, Christian MC, Gwyther SG. New guidelines to evaluate the response to treatment in solid tumors. European Organization for Research and Treatment of Cancer, National Cancer Institute of the United States, National Cancer Institute of Canada. J Natl Cancer Inst. 2000;92:205-216
11. Reuben JM, Lee BN, Li C, Gomez-Navarro J, Bozon VA, Parker CA, Hernandez IM, Gutierrez C, Lopez-Berestein G, Camacho LH. Biologic and immunomodulatory events after CTLA-4 blockade with ticilimumab in patients with advanced malignant melanoma. Cancer. 2006;106:2437-2444
12. Gao H, Lee BN, Talpaz M, Donato NJ, Cortes JE, Kantarjian HM, Reuben JM. Imatinib mesylate suppresses cytokine synthesis by activated CD4 T cells of patients with chronic myelogenous leukemia. Leukemia. 2005;19:1905-1911
13. Lee BN, Follen M, Rodriquez G, Shen DY, Malpica A, Shearer WT, Reuben JM. Deficiencies in myeloid antigen-presenting cells in women with cervical squamous intraepithelial lesions. Cancer. 2006;107:999-1007
14. Ida JA, Shrestha N, Desai S, Pahwa S, Hanekom WA, Haslett PA. A whole blood assay to assess peripheral blood dendritic cell function in response to Toll-like receptor stimulation. J Immunol Methods. 2006;310:86-99
15. Butchi NB, Pourciau S, Du M, Morgan TW, Peterson KE. Analysis of the neuroinflammatory response to TLR7 stimulation in the brain: comparison of multiple TLR7 and/or TLR8 agonists. J Immunol. 2008;180:7604-7612
16. Salio M, Speak AO, Shepherd D, Polzella P, Illarionov PA, Veerapen N, Besra GS, Platt FM, Cerundolo V. Modulation of human natural killer T cell ligands on TLR-mediated antigen-presenting cell activation. Proc Natl Acad Sci U S A. 2007;104:20490-20495
17. Pathak MK, Yi T. Sodium stibogluconate is a potent inhibitor of protein tyrosine phosphatases and augments cytokine responses in hemopoietic cell lines. J Immunol. 2001;167:3391-3397
18. Li J, Lindner DJ, Farver C, Borden EC, Yi T. Efficacy of SSG and SSG/IFNalpha2 against human prostate cancer xenograft tumors in mice: a role for direct growth inhibition in SSG anti-tumor action. Cancer Chemother Pharmacol. 2007;60:341-349
19. Fan K, Zhou M, Pathak MK, Lindner DJ, Altuntas CZ, Tuohy VK, Borden EC, Yi T. Sodium stibogluconate interacts with IL-2 in anti-Renca tumor action via a T cell-dependent mechanism in connection with induction of tumor-infiltrating macrophages. J Immunol. 2005;175:7003-7008
20. Liu YJ, Kanzler H, Soumelis V, Soumelis V, Gilliet M. Dendritic cell lineage, plasticity and cross-regulation. Nat Immunol. 2001;2:585-589
21. Rissoan MC, Soumelis V, Kadowaki N, Grouard G, Briere F, de Waal Malefyt R, Liu YJ. Reciprocal control of T helper cell and dendritic cell differentiation. Science. 1999;283:1183-1186
22. Grouard G, Rissoan MC, Filgueira L, Durand I, Banchereau J, Liu YJ. The enigmatic plasmacytoid T cells develop into dendritic cells with interleukin (IL)-3 and CD40-ligand. J Exp Med. 1987;185:1101-1111
23. Chen XQ, Yang J, Hu SP, Nie HX, Mao GY, Chen HB. Increased expression of CD86 and reduced production of IL-12 and IL-10 by monocyte-derived dendritic cells from allergic asthmatics and their effects on Th1- and Th2-type cytokine balance. Respiration. 2006;73:34-40
24. Robinson DS. The role of regulatory T lymphocytes in asthma pathogenesis. Curr Allergy Asthma Rep. 2005;5:136-141
25. Yoshida M, Watson RM, Rerecich T, O'Byrne PM. Different profiles of T-cell IFN-gamma and IL-12 in allergen-induced early and dual responders with asthma. J Allergy Clin Immunol. 2005;115:1004-1009
26. Thornton AM, Shevach EM. CD4+CD25+ immunoregulatory T cells suppress polyclonal T cell activation in vitro by inhibiting interleukin 2 production. J Exp Med. 1998;188:287-296
27. Suzuki Y, Adachi Y, Ohno N, Yadomae T. Th1/Th2-Balancing immunomodulating activity of gel-forming (1-->3)-beta-glucans from fungi. Biol Pharm Bull. 2001;24:811-819
28. Sakurai T, Ohno N, Suzuki I, Yadomae T. Effect of soluble fungal (1-->3)-beta-D-glucan obtained from Sclerotinia sclerotiorum on alveolar macrophage activation. Immunopharmacology. 1995;30:157-166
Author contact
![]() Corresponding author: Aung Naing, MD, FACP, Department of Investigational Cancer Therapeutics, University of Texas MD Anderson Cancer Center, 1515 Holcombe Blvd, Box 455, Houston Texas. anaingorg; Phone: (713) 792-2950 ; Fax: (713) 563-0566
Corresponding author: Aung Naing, MD, FACP, Department of Investigational Cancer Therapeutics, University of Texas MD Anderson Cancer Center, 1515 Holcombe Blvd, Box 455, Houston Texas. anaingorg; Phone: (713) 792-2950 ; Fax: (713) 563-0566