Impact Factor ISSN: 1837-9664




J Cancer 2026; 17(7):1362-1372. doi:10.7150/jca.136694 This issue Cite
Research Paper
A digital polymerase chain reaction method targeting non-recombined T-cell receptor sequences aids in diagnosing primary cutaneous T-cell lymphomas
Chien-Chin Chen1,2,3,4*, Cheng-Lin Wu5*, Bo-Jiun Tzeng6, Pin-Jun Chen6, Wan-Li Chen7, Sern Yan Lim1, Yi-Ling Chen8, Yi-Lin Chen5,7,8  , Chung-Liang Ho5,6,7 , Tsunglin Liu1
1. Department of Biotechnology and Bioindustry Sciences, College of Bioscience and Biotechnology, National Cheng Kung University, Tainan, Taiwan.
2. Department of Pathology, Ditmanson Medical Foundation Chia-Yi Christian Hospital, Chiayi, Taiwan.
3. Department of Cosmetic Science, Chia Nan University of Pharmacy and Science, Tainan, Taiwan.
4. Doctoral Program in Translational Medicine, National Chung Hsing University, Taichung, Taiwan.
5. Department of Pathology, National Cheng Kung University Hospital, College of Medicine, National Cheng Kung University, Tainan, Taiwan.
6. Institute of Molecular Medicine, College of Medicine, National Cheng Kung University, Tainan, Taiwan.
7. Molecular Medicine Core Laboratory, Research Center of Clinical Medicine, National Cheng Kung University Hospital, Tainan, Taiwan.
8. Medical Laboratory Science and Biotechnology, College of Medicine, National Cheng Kung University, Tainan, Taiwan.
* Chien-Chin Chen and Cheng-Lin Wu contributed equally to this work.
Received 2026-4-23; Accepted 2026-6-22; Published 2026-7-13
Abstract
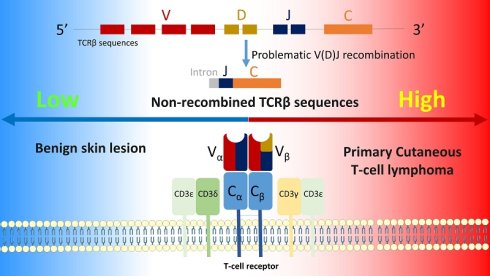
Background: Diagnosing primary cutaneous T-cell lymphoma (PCTCL) relies on the comprehensive evaluation of clinical presentation, histopathology, immune profile, and molecular testing. Regarding molecular testing, the BIOMED-2 assay is most commonly used for detecting monoclonality of T-cell receptor (TCR) genes. However, its sensitivity is not ideal for PCTCLs, and a supplementary test is required. We recently found that the ratios of non-recombined TCR sequences J2-2P and J2-3 of the TCRβ gene were higher in T-cell lymphoma (TCL) samples than in non-TCL cases. Here, we aim to evaluate the diagnostic value of this novel biomarker for PCTCL via digital polymerase chain reaction (dPCR) as a supplementary method to the BIOMED-2 clonality assay.
Methods: Formalin-fixed paraffin-embedded tissue samples of clinicopathologically proven PCTCL cases with a negative BIOMED-2 clonality result were retrospectively retrieved, and the clinicopathological characteristics were collected. After RNA extraction and quality checking, dPCR was performed on PCTCL specimens and control samples to quantify the J2-2P and J2-3 sequences.
Results: We collected 35 skin biopsy samples from patients with early-stage PCTCL and 11 inflammatory dermatoses as controls. Ratios of the J2-2P to J2-3 concentration in controls ranged from 0.03 to 0.55% (mean ± standard deviation: 0.21 ± 0.17%). In contrast, 25 of the 35 (71.42%) PCTCL specimens exhibited J2-2P/J2-3 ratios exceeding the defined upper limit of the control group.
Conclusion: Our dPCR assay on the non-recombined TCRβ sequences revealed that a majority of the PCTCL cases with a negative BIOMED-2 result had higher ratios of the J2-2P to J2-3 concentration than inflammatory dermatoses. Therefore, this approach may supplement the BIOMED-2 clonality assay for diagnosing PCTCL.
Keywords: BIOMED-2, cutaneous T-cell lymphoma, digital PCR, T-cell receptor
1. Introduction
Primary cutaneous T-cell lymphoma (PCTCL) is characterized by neoplastic T cells that develop primarily in the skin without evidence of systemic or extra-cutaneous involvement [1-3]. In the US National Cancer Registry data, 14,942 new PCTCL cases were diagnosed between 2000 and 2018, with an incidence of 8.55 per million [4]. PCTCLs are a heterogeneous set of lymphoma entities with varied clinical features (such as papules, patches, plaques, nodules, and erythroderma) and histological features (including intraepidermal, dermal, or subcutaneous lymphocyte infiltrates with varying cellular sizes and shapes) [1-3,5]. Additionally, their immunophenotypic and genetic characteristics are distinct [1,2]. The World Health Organization (WHO) has classified PCTCLs into eleven types, including mycosis fungoides (MF), Sézary syndrome, primary cutaneous CD30-positive lymphoproliferative disorders, primary cutaneous gamma-delta T-cell lymphoma, primary cutaneous CD4+ small/medium T-cell lymphoproliferative disorder, primary cutaneous acral CD8+ T-cell lymphoma, cutaneous CD8+ aggressive epidermotropic T-cell lymphoma, adult T-cell lymphoma/leukemia, systemic chronic active EBV disease, subcutaneous panniculitis-like T-cell lymphoma (SPTCL), and primary cutaneous peripheral T-cell lymphoma, NOS (PTCL) [3]. Among all types of PCTCLs, MF is indolent with globally the highest incidence rate (5.42 per million) but can transform into an aggressive leukemia known as Sézary syndrome, with an annual percentage increase of 3.83% [4]. Primary cutaneous CD30-positive lymphoproliferative disorders, primary cutaneous CD4+ small/medium T-cell lymphoproliferative disorder, and SPTCL are indolent, with the second to fourth incidences among PCTCLs [3]. In Taiwan, MF (56.8%), primary cutaneous CD30-positive lymphoproliferative disorders (14.8%), and SPTCL (3.7%) were the most common PCTCL subtypes, and most PCTCLs were presented at early stages (85.8%) [6].
PCTCL is diagnosed by integrating clinical manifestations, histological characteristics, immunophenotypic patterns, and molecular data. Early diagnosis of PCTCL can be challenging due to its modest clinical presentation, low percentage of tumor cells, small or limited tissue biopsy size, and nonspecific histopathological characteristics. In particular, PCTCLs and reactive lesions can be misdiagnosed because of their similar clinical and histopathological features. In these cases, molecular tests aid in diagnosing PCTCL [5], highlighting the importance of integrating various evidence [7-8]. The International Society for Cutaneous Lymphomas (ISCL) has suggested an algorithm to diagnose early-stage MF. The diagnosis involves a careful evaluation of histopathological features, clinical symptoms, immunohistochemical tests, and molecular tests, including examination of T-cell receptor (TCR) gene rearrangements [9-11].
For the molecular diagnosis of PCTCL, the BIOMED-2 multiplex polymerase chain reaction (PCR) assay is currently the most widely used molecular test worldwide. It examines the monoclonality of TCR rearrangement, whose existence supports the diagnosis of malignant T-cell lymphoma (TCL) [12-13]. However, for diagnosing PCTCL, the BIOMED-2 assay has variable sensitivities [14], e.g., 66% in a Netherlands study [15], 76% in Taiwan [16], and 78% in a German cohort [17]. Therefore, a supplementary test using a novel biomarker may help enhance the molecular test for PCTCL.
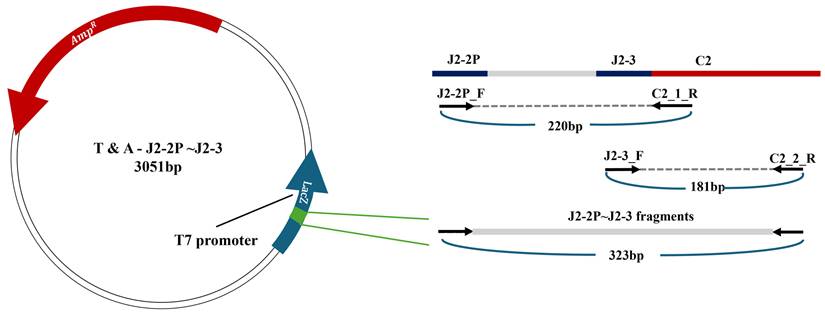
We recently found the prevalence of non-recombined TCRβ sequences in healthy individuals and TCL patients [18]. A non-recombined TCR sequence contains a J gene segment but not a D and V gene segment. Interestingly, the ratios of the non-combined TCRβ sequences, specifically J2-2P and J2-3 sequences, were higher in the TCL patients than in the non-TCL cases, suggesting a novel biomarker for supplementing the diagnosis of TCL. J2-2P is a pseudogene segment in front of the J2-3 gene segment and is used here to denote a stretch from the J2-2P to the J2-3 gene segment, i.e., J2-2P~J2-3 (Figure 1), which is always non-recombined. A J2-3 sequence is defined as a TCRβ sequence that contains the J2-3 gene segment, which can be present in either a J2-2P sequence or a recombined TCRβ gene involving J2-3, such as V1:J2-3. Therefore, J2-2P is included in J2-3, and the ratio of the J2-2P to J2-3 concentration should be less than one. Here, we examined whether this novel biomarker could also supplement the diagnosis of PCTCL. In particular, we investigated PCTCL cases with both clinical and histopathological evidence and demonstrated a negative BIOMED-2 result, indicating potential false negatives. We applied digital PCR (dPCR) to quantify the J2-2P to J2-3 concentration ratio and compared the results with those of control samples. The current study found that approximately 70% of the false-negative PCTCLs in the BIOMED-2 assay had a higher J2-2P/J2-3 ratio in dPCR, indicating its potential utility as a supplementary method.
The J2-2P~J2-3:C2 fragment of the plasmid construct. To construct the fragment, two sets of primers, J2-2P_F/C2_1R and J2-3_F/C2_2R, are used to amplify the mRNA containing the J2-2P and J2-3 gene segments separated by an intergenic region and concatenated to the C2 gene segment (top object on the right). In addition to the two amplicons of 220 bps and 181 bps respectively, the PCR results in longer amplicons starting from J2-2PF to C2_2R (323 bp). The longest amplicons are isolated via gel electrophoresis and inserted to the T&A clone.
2. Materials and Methods
2.1 Plasmid construction and determining the limit of detection (LoD) in dPCR
For accurate quantification, we constructed a plasmid containing the J2-2P~J2-3 gene segment of the TCRβ gene concatenated to the C2 gene segment (Figure 1). This construct served as a positive control in subsequent dPCR assays. The J2-2P~J2-3:C2 and J2-3:C2 segments were amplified via PCR using two distinct primer sets: J2-2P_F: 5'-AGGCGCTGCTGGGCGTCT-3' / C2_R: 5'-GGGTGGGAACACGTTTTTCAGG-3' for the J2-2P~J2-3:C2 segment and J2-3_F: 5'-GCACAGATACGCAGTATTTTGG-3' / Cβ2_R: 5'-TCAGCTCCACGTGGTCGGGGT-3' for the J2-3:C2 segment, respectively. Each PCR reaction was performed in a 25 μL volume under the following thermal cycling conditions: an initial denaturation at 95 °C for 5 minutes, followed by 35 cycles of 95 °C for 30 seconds, 60 °C for 60 seconds, and 72 °C for 60 seconds. A final extension step at 72 °C for 10 minutes completed the amplification, after which the reaction was held at 12°C. The PCR resulted in three amplicon products and the largest one (323 base pairs) was isolated via gel electrophoresis. The largest product was subsequently cloned into a T&A Cloning Vector (Geneaid, Taipei, Taiwan). The integrity of the cloned product was confirmed through Sanger sequencing. The copy number was calculated based on the concentration of plasmid DNA and its fragment size. This validated fragment was subsequently used as a positive control in our dPCR experiments.
To determine LoD for the J2-2P and J2-3 sequences, the plasmids were serially diluted 10-fold, generating standards ranging from 106 to 100 copies. The 100-106 copies of the plasmid were quantified by dPCR to evaluate the concentrations using the two primer sets, and the data were plotted to build a standard curve.
2.2 Collection of PCTCL specimens from clinical patients
This clinical study was approved by the Institutional Review Board of the National Cheng Kung University Hospital (NCKUH) (Number: B-ER-110-042, period of the project: 2021.04.27 to 2025.12.31). The requirement for patient-informed consent was waived because only de-identified cases were used.
We aimed to recruit patients with PCTCLs and negative BIOMED-2 results retrospectively. Inclusion criteria for this study comprised: 1) pathological confirmation of PCTCL, 2) negative TCR clonality as determined by the BIOMED-2 assay, 3) accessible formalin-fixed paraffin-embedded (FFPE) tumor tissue, and 4) availability of traceable and corroborating clinical data. Exclusion criteria for this study encompassed: 1) suboptimal RNA quality, 2) insufficient specimen quantity, 3) a positive TCR clonality from the BIOMED-2 assay, or 4) clinicopathological findings not fulfilling the diagnostic criteria for PCTCL.
From January 2019 to December 2024, 147 FFPE tissue samples of clinically suspicious PCTCL were requested for a BIOMED-2 test of TCR monoclonality at NCKUH. Forty-nine samples with a positive BIOMED-2 test (monoclonality shown in either TCR gamma or beta chain) were assumed to be consistent with PCTCLs and excluded because a supplementary test was unnecessary. Among the 98 samples with a negative BIOMED-2 test, we further excluded 3 recurrent samples to avoid repetitive calculations for the same patients, 25 samples with poor RNA quality, and 35 samples without histological evidence of PCTCL, as determined by reviewing the histopathology, immunophenotypes, and clinical outcomes. These specimens fulfilled the diagnostic criteria of the fifth edition of the WHO classification of lymphoid neoplasms for PCTCLs [2,3] but showed a polyclonal or equivocal result for the TCRγ and TCRβ genes in the BIOMED-2 assay. As a result, we identified 35 specimens from 35 patients as our experimental group.
These 35 specimens comprised 27 MF, 4 PTCL, and 4 SPTCL cases. Diagnosis, tumor proportion, and disease status (naïve, recurrent, or post-treatment) were further confirmed through histopathology and chart review. MF was diagnosed using the ISCL algorithm, and a total of 4 points from clinical, histopathological, molecular, and immunopathological factors were required [9]. PTCL and SPTCL were diagnosed according to the updated WHO classification criteria [2]. The detailed information is listed in Table 1. In addition, 11 FFPE tissues from skin samples of 11 patients with inflammatory dermatoses were retrieved from the pathology tissue bank at NCKUH as control samples.
The basic information and dPCR results of all PCTCLs.
| No. | Gender | Diagnosis | TCRG (BIOMED-2) | TCRB (BIOMED-2) | Biopsy size (cm) | tumor cell (%) | DNA quality | RNA concentration (ng/µL) | J2-2P (HEX) Positives | J2-2P (HEX) DNA copies/µL | J2-3 (FAM) Positives | J2-3 (FAM) DNA copies/µL | J2-2P/J2-3(%) |
|---|---|---|---|---|---|---|---|---|---|---|---|---|---|
| 1 | M | PTCL | Polyclonal | - | 0.7 | 40 | 400bp | 157.9 | 0 | 0.035 | 173 | 12.13 | 0.29 |
| 2 | F | PTCL | Polyclonal | - | 0.4 | 20 | 200bp | 17.2 | 9486 | 664.02 | 9735 | 681.45 | 97.44 |
| 3 | M | PTCL | Polyclonal | Polyclonal | 1.8 | 95 | 400bp | 7.1 | 0 | 0.035 | 41 | 2.87 | 1.22 |
| 4 | F | PTCL | Polyclonal | Polyclonal | 1 | 85 | 400bp | 141.9 | 7 | 0.48 | 780 | 54.58 | 0.88 |
| 5 | M | SPTCL | Polyclonal | Polyclonal | 3 | 10 | 400bp | 775.6 | 3 | 0.21 | 2671 | 187.03 | 0.11 |
| 6 | M | SPTCL | Equivocal | Polyclonal | 2 | 10 | 400bp | 9.5 | 3 | 0.23 | 839 | 68.07 | 0.36 |
| 7 | F | SPTCL | Polyclonal | Polyclonal | 1.5 | 8 | 400bp | 12.8 | 0 | 0.035 | 100 | 6.99 | 0.50 |
| 8 | F | SPTCL | Polyclonal | Polyclonal | 4.3 | 40 | 400bp | 1841.1 | 46 | 3.55 | 114 | 8.82 | 40.25 |
| 9 | M | MF | Polyclonal | Polyclonal | 0.8 | 6 | 400bp | 42.4 | 2 | 0.14 | 42 | 2.94 | 4.76 |
| 10 | M | MF | Polyclonal | Polyclonal | 0.8 | 4 | 400bp | 39 | 0 | 0.035 | 15 | 1.04 | 3.37 |
| 11 | F | MF | Polyclonal | Polyclonal | 0.8 | 16 | 300bp | 22.9 | 0 | 0.035 | 0 | 0.035 | NA* |
| 12 | M | MF | Polyclonal | Polyclonal | 0.9 | 5.5 | 400bp | 43.4 | 160 | 10.92 | 349 | 23.73 | 46.02 |
| 13 | F | MF | Polyclonal | - | 0.7 | 5 | 400bp | 8.2 | 0 | 0.035 | 5347 | 374.3 | 0.01 |
| 14 | F | MF | Polyclonal | - | 1 | 10 | 400bp | 19 | 2 | 0.14 | 23 | 1.66 | 8.43 |
| 15 | M | MF | Polyclonal | Polyclonal | 1 | 2 | 300bp | 38.4 | 823 | 55.96 | 861 | 58.54 | 95.59 |
| 16 | M | MF | Polyclonal | Polyclonal | 0.9 | 5 | 400bp | 101.6 | 338 | 22.98 | 399 | 27.13 | 84.70 |
| 17 | M | MF | Polyclonal | - | 1.2 | 3 | 300bp | 15.5 | 0 | 0.035 | 870 | 59.16 | 0.06 |
| 18 | M | MF | Polyclonal | Polyclonal | 0.8 | 20 | 300bp | 27.7 | 412 | 28.02 | 421 | 28.63 | 97.87 |
| 19 | F | MF | Polyclonal | Polyclonal | 0.5 | 15 | 400bp | 29.6 | 18 | 1.34 | 1663 | 134.79 | 0.99 |
| 20 | F | MF | Polyclonal | Polyclonal | 0.7 | 12 | 400bp | 36.7 | 128 | 14.82 | 349 | 23.73 | 62.45 |
| 21 | M | MF | Polyclonal | Polyclonal | 0.4 | 8 | 400bp | 11.4 | 409 | 27.81 | 479 | 32.57 | 85.39 |
| 22 | M | MF | Equivocal | Polyclonal | 0.9 | 1 | 300bp | 21.3 | 0 | 0.035 | 0 | 0.035 | NA* |
| 23 | M | MF | Polyclonal | Polyclonal | 0.5 | 3 | 400bp | 12.8 | 350 | 23.8 | 488 | 33.18 | 71.73 |
| 24 | M | MF | Polyclonal | - | 0.8 | 2 | 400bp | 8.5 | 5 | 0.35 | 669 | 46.84 | 0.75 |
| 25 | F | MF | Polyclonal | Polyclonal | 0.6 | 5 | 400bp | 11.6 | 4 | 0.3 | 55 | 3.87 | 7.75 |
| 26 | M | MF | Polyclonal | Polyclonal | 0.5 | 6 | 300bp | 12.5 | 0 | 0.035 | 162 | 11.36 | 0.31 |
| 27 | F | MF | Polyclonal | Polyclonal | 0.8 | 2 | 400bp | 29.2 | 1 | 0.11 | 21 | 1.5 | 7.33 |
| 28 | M | MF | Polyclonal | Polyclonal | 1 | 4.5 | 400bp | 28.6 | 0 | 0.035 | 60 | 4.2 | 0.83 |
| 29 | F | MF | Polyclonal | Polyclonal | 1 | 10 | 400bp | 8.3 | 2 | 0.15 | 285 | 19.94 | 0.75 |
| 30 | M | MF | Polyclonal | Polyclonal | 0.7 | 5 | 400bp | 10.5 | 2 | 0.14 | 53 | 3.69 | 3.79 |
| 31 | M | MF | Polyclonal | - | 0.7 | 20 | 400bp | 85.4 | 282 | 20.81 | 297 | 21.93 | 94.89 |
| 32 | F | MF | Polyclonal | - | 0.5 | 10 | 300bp | 59.8 | 6 | 0.44 | 59 | 4.31 | 10.21 |
| 33 | F | MF | Polyclonal | Polyclonal | 0.9 | 5 | 400bp | 158.5 | 156 | 11.09 | 192 | 13.67 | 81.13 |
| 34 | M | MF | Polyclonal | Polyclonal | 0.5 | 30 | 400bp | 68 | 3 | 0.27 | 548 | 50.21 | 0.54 |
| 35 | F | MF | Polyclonal | - | 0.7 | 10 | 400bp | 123.3 | 5 | 0.36 | 229 | 16.6 | 2.17 |
| Mean ± SD | 115.35±327.70 | 361.51±1597.88 | 25.39±111.81 | 811.11±1,840.68 | 57.76±129.11 | 27.66±37.97 | |||||||
Abbreviations: M: male, F: female, MF: mycosis fungoides, PTCL: peripheral T-cell lymphoma, SD: standard deviation, SPTCL: subcutaneous panniculitis-like T-cell lymphoma, TCRG: TCRγ gene rearrangement, TCRB: TCRβ gene rearrangement, FAM: fluorescein, HEX: hexachloro-fluorescein, NA = not available.
*the FAM-positive signals of J2-3 < 5
2.3 RNA extraction and RNA quality control
For PCTCL cases with a tumor percentage equal to or greater than 20%, we would cut five whole FFPE tissue slices per case, each with a thickness of 5 μm. For the remaining PCTCL cases with a tumor percentage of less than 20%, we would cut five blank tissue slides of 5 μm thickness, circle the area with a higher tumor percentage, and perform macro-dissection under the pathologist's observation. Then, the macrodissected tissues were sent for RNA extraction.
Tissues from whole FFPE tissue slices or macro-dissection were placed in a 1.5 mL tube. We used xylene and 100% ETOH to de-wax and dehydrate the specimen, put them in a 37 °C dry bath to evaporate the alcohol, and then used the Qiagen RNeasy FFPE Kit (Qiagen, Hilden, Germany) to extract RNA. In the entire RNeasy FFPE procedure, we added FFPE specimens with 10 μL proteinase K and 240 μL Buffer PKD, mixed them well, heated at 56°C and 80°C for 15 minutes each, ice bathed for 3 minutes, centrifuged at 10 °C, 13,500 rpm for 15 minutes, aspirated the supernatant, and then added DNase Booster Buffer 25 μL and 10 μL DNase reacting at room temperature for 15 minutes to remove genomic DNA effectively. After adding 500 μL Buffer RBC and 1,200 μL 100% ETOH, the solution was put into RNeasy MinElute spin column to purify concentrated RNA, centrifuged at 10 °C, 12,000 rpm for 30 seconds, washed twice with 500 μL Buffer RPE, centrifuged at 10 °C, 12,000 rpm for 30 seconds, and then idled for 3 minutes. Finally, 20-25 μL of RNase-free water was added to the solution, and the concentration was determined using a Nanodrop (Thermo, Massachusetts, USA). For subsequent experiments, the RNA concentration ranged from 7 to 776 ng/µL.
2.4 Reverse transcription-PCR (RT-PCR) and complementary DNA (cDNA) synthesis
Synthesis of first-strand cDNA was performed through the following steps. Step1: take 500 ng RNA into a 0.2 mL tube, add H2O to make up the volume to 5 μL, and set PCR conditions as shown in Supplementary Table S1; step2: add related reagents for first-strand cDNA syntheses (Supplementary Table S2), react, and PCR conditions are shown in Table S3. To ensure RNA quality, we used GAPDH (165bp) and β2-microglobulin (256bp) as housekeeping genes for internal control following the same methodology as in our previous publication [19]. In brief, if the GAPDH and β2-microglobulin can be successfully amplified, the reverse transcription is reliable and successful, as illustrated in Supplementary Figure S1. Otherwise, additional tissue slices would be cut to re-extract RNA and repeat RT-PCR.
Since FFPE samples are cumbersome to prepare and the quality of extracted RNA is relatively poor, the ReliaPrep™ DNA Clean-Up and Concentration System (Promega, Madison, WI) was used to remove excess nucleotides and primers from cDNA through purification. In brief, we added the reagent Membrane Binding Solution and 100% isopropanol provided by the kit in sequence, mixed the sample thoroughly, loaded the sample into ReliaPrep™ Minicolumn seated in a collection tube, centrifuged at 12,000 rpm for 15 seconds, and then added 200 μL Column Wash Solution (CWE), centrifuged for 15 seconds, then added 300 μL Buffer B (BWB) to wash the column twice, centrifuged for 15 seconds, idled for 1 minute, and finally added 25 μL H2O to dissolve.
2.5 dPCR for detecting the non-recombined J2-2P and J2-3 sequences
Clarity™ Digital PCR (JN MEDSYS, Henderson, SG) system, a chip-in-a-tube technology, was used to quantitatively detect the J2-2P and J2-3 concentrations. Regarding the detection mechanism, its wafer is divided into 10,000 holes, and the autoloader is used to disperse DNA sequences into each hole. Ideally, each hole may contain 1 or 0 strands of DNA. Furthermore, as a separate PCR space, the copy number is obtained by detecting the fluorescent signal and converting it to achieve an absolute quantitative method [20].
In general, dPCR adds two sets of different primers and probes into the PCR reaction tubes to detect different targets through the probe label with different fluorescence dyes (FAM: fluorescein, HEX: hexachloro-fluorescein). The operating reagents are shown in Supplementary Table S4. In this study, the above two sets of primers for amplifying the J2-2P and J2-3 sequences were used. The corresponding probes were prepared by Integrated DNA Technologies as previously published (J2-2P probe: 5'-HEX-CTCTCCCAG/ZENCACCCAGAACCAGGA/3IABkFQ/-3'; J2-3 probe: 5'-FAM-CTGACAGTG/ZEN CTCGAGGACCTGAAAAACGT/3IABkFQ/-3') [18]. After the specimen was thoroughly mixed and briefly centrifuged, the tube strip, platform, and slider of the JN Clarity™ consumables set (JN MEDSYS, Henderson, SG) were assembled. Following visual confirmation that the wafer was undamaged, the platform was inserted into the tube strip and aligned with the upper edge of the wafer. The wafer was then mounted onto the autoloader, and the slider was positioned on the platform. Mechanical partitioning was subsequently performed, evenly distributing 15 μL of the specimen across the wafer. The tube strip was then transferred to the sealing enhancer to securely seal each sample. Finally, 245 μL of sealing fluid was added to the tube prior to amplification. The dPCR cycling conditions are detailed in Supplementary Table S5.
After the dPCR reaction, we used the Clarity Plus dPCR system (JN MEDSYS, Henderson, SG) to detect whether each hole had a fluorescent signal and convert it to DNA concentration (copies/μL) for the J2-2P and J2-3 sequences as illustrated in Supplementary Figure S2. Ratio of the J2-2P to J2-3 concentration is the metric used to determine disease status, as described in our previous study [18]. To avoid underestimation, the concentration of a measurement of zero FAM positive signal was set as 0.035, which was half of the concentration when one FAM positive signal was detected. The entire workflow of the experimental work is illustrated in Supplementary Figure S3.
2.6 Statistical analysis
GraphPad Prism 8.01 software (GraphPad Software, San Diego, CA, USA) and Microsoft Office Excel 2016 (Microsoft, Redmond, WA, USA) were used for statistical analysis and data visualization. Data were presented as frequencies, percentages, means, standard deviations, and ranges. Mean ± standard deviation (SD) or median with interquartile range (IQR) or 95% confidence interval (CI) of the mean represents continuous variables, while number [percentage (%)] represents discrete variables. The Mann-Whitney U test was used to analyze two unpaired samples that were not normally distributed. The chi-square test or Fisher's exact test was employed to examine the presence of associations or dependencies between categorized variables. Regression analysis was used to explore the linear relationship between plasmid copy number and the concentrations of the J2-2P and J2-3 sequences. When a p-value is smaller than 0.05 (two-tailed), differences were considered statistically significant. In addition, we determined that a higher J2-2P to J2-3 ratio should be more than a three-SD increase relative to the control samples' mean.
3. Results
3.1 LoD of the J2-2P and J2-3 sequences in dPCR
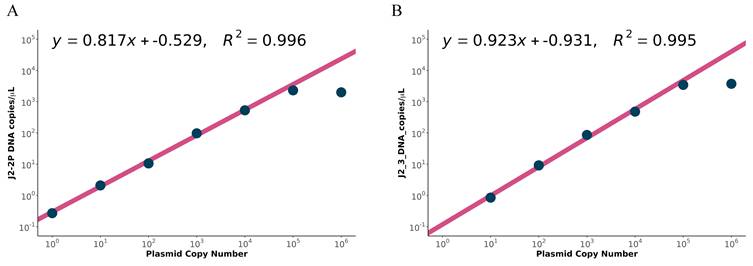
Before applying dPCR to clinical samples, we determined the LoD of our targeting sequences. The copy numbers of plasmids containing the J2-2P~J2-3 gene segment were serially diluted from 106 to 100 and quantified by dPCR, and the examination was performed in duplicate. Fluorescent signals of the J2-2P and J2-3 sequences were evenly distributed across the chip and decreased with the dilution (Supplementary Figure S4A). Based on Figure 2, the reliable detection range of plasmid copy numbers for the J2-2P and J2-3 sequences was determined to be 101 to 104 copies. This range was established because fewer than 101 copies yielded no signal in J2-3, while the measurement started to plateau at 105 copies for both the J2-2P and J2-3 sequences (Supplementary Figure S4B). Importantly, these plasmids copy numbers were utilized strictly as a calibration standard to establish the theoretical limit of detection and dynamic range of our primers. While directly comparing plasmid concentrations to FFPE-derived cDNA copies is complex due to matrix effects, the standard curve confirms assay linearity. In terms of the dPCR concentration, a value greater than 103 would suggest saturation and the sample was diluted for a re-measurement.
Relationship between plasmid copy number and the concentrations of the (A) J2-2P and (B) J2-3 sequences determined by dPCR. In each plot, the four data points with copy number 101 to 104 are used for linear regression.
3.2 Patients and tissue characteristics
Based on histopathology, immunophenotype, and clinical outcomes, we collected 35 skin samples from 35 patients confirmed with PCTCL. All patients were clinical stage I and evidence of tumor involvement was restricted to the skin, regardless of their PCTCL types. All the PCTCL specimens showed a negative BIOMED-2 test result, indicating false negatives. The age, gender, histological diagnosis, BIOMED-2 result, biopsy sample size, tumor proportion in histopathology, DNA quality, and RNA concentration were summarized in Table 1. In our cohort, the male-to-female ratio was 1.33:1, with a mean age of 57.91 years. Besides the 4 samples of PTCL and the 4 samples of SPTCL, the remaining 27 samples (77.14%) were of the MF type. The biopsy size ranged from 0.40 to 4.30 cm (mean ± SD: 1.01 ± 0.76 cm), and the tumor proportion was 15.23% on average (SD: 21.06%). The mean extracted RNA concentration was 115.35 ng/µL (SD: 327.70 ng/µL), and all PCTCL samples' cDNA quality was at least 300 bp.
3.3 Results of the dPCR assay for J2-2P and J2-3
The PCTCL samples and control tissues were subjected to dPCR to measure concentrations of the J2-2P and J2-3 sequences. To ensure accurate J2-2P/J2-3 ratio calculations, cases exhibiting fewer than five FAM-positive signals of the J2-3 measurement were excluded before further analysis, as the denominator of the ratio was not reliable. Herein, we excluded two PCTCL cases and one control case before further analysis.
In the control group, the J2-2P concentrations varied from 0.035 to 0.07 copies/µL, with a mean of 0.04 copies/µL, while the J2-3 concentrations had a mean of 41.22 copies/µL (range: 0.14-130.76 copies/µL). The ratios of J2-2P to J2-3 averaged 0.21% (range: 0.03-0.55%), and the SD was 0.17%. The dPCR results for the control samples are presented in Table 2. Based on the empirical rule, it is a statistical guideline that describes approximately 99.7% of data points that would fall within three SDs of the mean [21]. We determined that 0.72%, which represents the sum of the mean and three standard SDs of the control samples, of the J2-2P/J2-3 ratio represents the upper limit of inflammatory dermatoses.
The dPCR results for J2-2P and J2-3 of the control samples.
| Control | Tissue | J2-2P (HEX) Positives | J2-3 (FAM) Positives | J2-2P (HEX) DNA copies/µL | J2-3 (FAM) DNA copies/µL | J2-2P/J2-3(%) |
|---|---|---|---|---|---|---|
| 1 | skin | 0 | 2 | 0.035 | 0.14 | NA* |
| 2 | skin | 0 | 201 | 0.035 | 13.99 | 0.25 |
| 3 | skin | 0 | 87 | 0.035 | 6.38 | 0.55 |
| 4 | skin | 0 | 225 | 0.035 | 15.06 | 0.23 |
| 5 | skin | 1 | 1100 | 0.07 | 79.3 | 0.09 |
| 6 | skin | 0 | 1544 | 0.035 | 130.76 | 0.03 |
| 7 | skin | 0 | 1515 | 0.035 | 117.39 | 0.03 |
| 8 | skin | 0 | 303 | 0.035 | 21.25 | 0.16 |
| 9 | skin | 0 | 711 | 0.035 | 49.8 | 0.07 |
| 10 | skin | 0 | 142 | 0.035 | 9.71 | 0.36 |
| 11 | skin | 0 | 146 | 0.035 | 9.66 | 0.36 |
| Mean | 0.04 | 41.22 | 0.21 | |||
| Standard deviation | 0.01 | 46.97 | 0.17 | |||
*the FAM-positive signals of J2-3 < 5
Regarding the PCTCL group, the J2-2P concentrations varied from 0.00 to 664.02 copies/μL (mean±SD: 25.39±111.81 copies/μL; 95% CI: -13.02˗63.80 copies/μL), and the J2-3 concentrations ranged from 0.00 to 681.45 copies/μL (mean±SD: 57.76±129.11 copies/μL; 95% CI: 13.40˗102.1 copies/μL). The ratios of J2-2P to J2-3 had a mean value 27.66% with an SD of 37.97% (range: 0.01˗97.87%; 95% CI: 14.20˗41.13%) (Table 1). Figure 3A compares the J2-2P/J2-3 ratios in inflammatory dermatoses and primary cutaneous T-cell lymphomas (PCTCLs). The Mann-Whitney U test showed that the J2-2P/J2-3 ratios were significantly higher in PCTCLs than in the control group (p = 0.00018, two-tailed). There were no significant differences between PCTCL subtypes (Figure 3B). Additionally, Pearson's linear and Spearman's rank-order correlations were performed to evaluate the relationship between the J2-2P/J2-3 ratios and the histological tumor cell percentages, but demonstrated no statistical correlation (p = 0.48) in Pearson's correlation; p= 0.98 in Spearman's correlation).
(A) The J2-2P/J2-3 ratios between controls and PCTCLs. Using the Mann-Whitney U test, we found that the J2-2P/J2-3 ratios in PCTCL are significantly higher than those in the control group (p-value =0.00018, two-tailed). (B) The J2-2P/J2-3 ratios stratified by specific PCTCL subtypes including mycosis fungoides (MF), primary cutaneous peripheral T-cell lymphoma, NOS (PTCL), and subcutaneous panniculitis-like T-cell lymphoma (SPTCL), showed no statistically different among three subtypes.
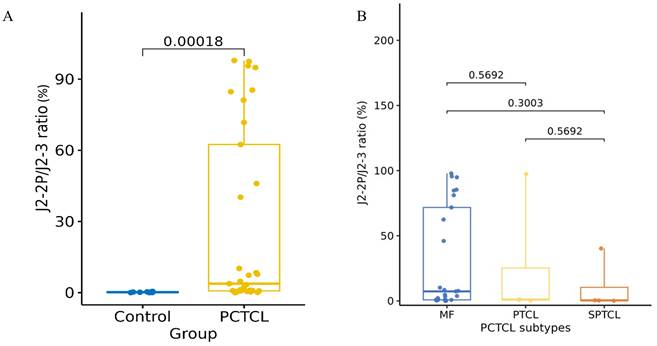
Based on the J2-2P/J2-3 ratios in PCTCL samples and the upper limit (0.72%) of controls, we divided the PCTCL samples into two groups: high (> 0.72%) and low (≤ 0.72%) J2-2P/J2-3 ratios. Twenty-five and eight PCTCL samples were in the high and low ratio groups, respectively, and their distinction needs further investigation.
3.4 Comparison between PCTCLs with high and low J2-2P/J2-3 ratios
In general, PCTCLs with a high J2-2P/J2-3 ratio had higher J2-2P (p-value = 0.0009) and J2-3 (p-value = 0.02) concentrations than PCTCLs with low J2-2P/J2-3 ratios. However, there was no statistically significant difference in PCTCL subtype (p-value = 0.07), age at diagnosis (p-value = 0.77), gender (p-value = 0.42), biopsy size (p-value = 1.00), tumor proportion in histology (p-value = 0.65), DNA quality (p-value = 0.62), and RNA concentrations (p-value = 0.24) between PCTCLs with high and low J2-2P/J2-3 ratios (Table 3). This indicates that the ratio is positively associated with the concentrations of the J2-2P and J2-3 sequences.
Comparison of PCTCL patient characteristics between high and low groups of the J2-2P/J2-3 ratios.
| PCTCL with negative BIOMED-2 (n = 33a) | ||||
|---|---|---|---|---|
| Characteristics | Total | High J2-2P/J2-3 ratio | Low J2-2P/J2-3 ratio | P valueb |
| Case number | N = 33 (100)c | N = 25 (75.76) | N = 8 (24.24) | |
| Diagnosis | 0.07 | |||
| MF | 25 (75.76) | 21 (84.00) | 4 (50.00) | |
| Non-MF | 8 (24.24) | 4 (15.00) | 4 (50.00) | |
| Age at diagnosis , median (IQR) | 61.00 (46.00-70.50) | 61.00 (46.00-71.00) | 63.50 (42.75-67.00) | 0.77 |
| Gender | 0.42 | |||
| Male | 19 (57.58) | 13 (52.00) | 6 (75.00) | |
| Female | 14 (42.42) | 12 (48.00) | 2 (25.00) | |
| Biopsy size | 1.00 | |||
| ˃ 0.5cm | 26 (78.79) | 20 (80.00) | 6 (75.00) | |
| ≤ 0.5cm | 7 (21.21) | 5 (20.00) | 2 (25.00) | |
| Tumor proportion | 0.65 | |||
| ≥ 5% | 26 (78.79) | 19 (76.00) | 7 (87.50) | |
| < 5% | 7 (21.21) | 6 (24.00) | 1 (12.50) | |
| DNA quality | 0.62 | |||
| ≥ 400 bp | 27 (81.82) | 21 (84.00) | 6 (75.00) | |
| < 400 bp | 6 (18.18) | 4 (16.00) | 2 (25.00) | |
| RNA concentration | 0.24 | |||
| ≥ 20 ng/µL | 19 (57.58) | 16 (64.00) | 3 (37.50) | |
| < 20 ng/µL | 14 (42.42) | 9 (36.00) | 5 (62.50) | |
| J2-2P concentration | 0.0009 | |||
| ≥ 0.3 copies/µL | 17 (51.52) | 17 (68.00) | 0 (0.00) | |
| < 0.3 copies/µL | 16 (48.48) | 8 (32.00) | 8 (100.00) | |
| J2-3 concentration | 0.02 | |||
| ≥ 50 copies/µL | 9 (27.27) | 4 (16.00) | 5 (62.50) | |
| < 50 copies/µL | 24 (72.73) | 21 (84.00) | 3 (37.50) | |
Abbreviations: MF, mycosis fungoides; IQR, interquartile range.
aWe started with 35 PCTCL cases, but excluded 2 from analysis because their FAM-positive signals fell below the threshold of 5.
bFisher's exact test was performed on all variables except the age at diagnosis, which was analyzed by the Mann-Whitney test. Fisher's exact test was utilized due to the small sample sizes across several categories.
cData are expressed as the No. (%) of participants unless otherwise specified.
4. Discussion
Approximately 83% of primary cutaneous lymphomas were PCTCLs, according to a global meta-analysis [22]. Worldwide, MF was the most common type of PCTCL (62%), despite variances by study and region. Regarding other types, SPTCL and PTCL were more prevalent in Asia [22]. In our institute, MF constituted 82.6% of PCTCLs, and most MF cases were at the early stage [23]. Moreover, pathological appearances may overlap features among certain subtypes of PCTCLs and benign mimics [24]. Based on the low neoplastic T-cell infiltrates in early PCTCLs, a sensitive approach is crucial for early diagnosis and patient treatment.
Since T-cell malignancies are caused by a single T-cell clone, examining malignant T cells would reveal an identical TCR gene sequence, known as monoclonality [25]. Consequently, molecular analyses for the monoclonality of TCR genes can support the diagnosis of PCTCLs, although monoclonality can sometimes develop in autoimmune diseases and reactive lesions [26-27]. Among molecular tests, the standardized TCR primer sets from BIOMED-2/EuroClonality and multiplex PCR protocols have been widely employed to differentiate between PCTCLs and lymphoproliferative skin diseases [12,13,28]. However, around 20% of PCTCLs failed to show monoclonality in the BIOMED-2 clonality assay [14,17]. The sensitivities of the BIOMED-2 clonality assay for the early stages of PCTCLs, particularly early MF, could be lower than all PCTCL cases (TCRγ alone: 43-69.6%; TCRβ alone: 78.3-83%) [14,29]. Although the BIOMED-2 multiplex PCR is a reliable and valuable diagnostic technique for patients with a preliminary suspicion of PCTCL, it is crucial to have alternative biomarkers or supplementary methods to facilitate accurate diagnosis or precise monitoring of PCTCLs.
While TCR exists as an alpha/beta or gamma/delta heterodimer, each T cell and its progeny possess a set of TCR genes uniquely rearranged due to the various combinations of V(D)J gene segments during T-cell maturation [25]. On the contrary, non-recombined TCR sequences are characterized by the absence of a V (or D) gene segment, containing only a J gene segment joined to a constant (C) region segment. In contrast, the BIOMED-2 primers are designed to target the V (or D) and J gene segments, enabling the detection of various fully recombined TCR alleles. Consequently, the BIOMED-2 assay has predominantly bypassed these non-recombined TCR sequences [18]. Interestingly, our recent study found high frequencies of non-recombined TCR sequences in the TCRβ repertoire sequencing, and the non-recombined TCRβ sequences, J2-2P, were most abundant in TCL samples [18]. Herein, we previously examined concentrations of the J2-2P and J2-3 sequences via dPCR in blood or bone marrow samples of nine TCLs with either positive or negative results of BIOMED-2 TCR beta clonality. All nine cases had a high ratio of the J2-2P to J2-3 concentration, while non-TCL cases did not [18]. Since the BIOMED-2 assay has fair detection rates for TCLs, we want to examine the novel biomarker (J2-2P/J2-3 ratio) for PCTCLs, a heterogeneous group with frequent diagnostic challenges.
Our current study demonstrated that the concentrations of J2-2P among all inflammatory dermatoses samples were consistently low (range: 0.035 to 0.07 copies/µL), and the ratios of the J2-2P to J2-3 concentrations averaged 0.21% (Table 2). The results of control samples indicated that the J2-2P sequences and the J2-2P/J2-3 ratios should be at low concentrations and ratios in benign or reactive cutaneous lesions. On the contrary, 25 PCTCL specimens exhibited a definitively high ratio of J2-2P/J2-3 (> 0.72%). When comparing PCTCLs with high and low J2-2P/J2-3 ratios, those with a high J2-2P/J2-3 ratio had statistically higher J2-2P and J2-3 concentrations. This suggests that the presence of the non-recombined J2-2P sequences in T cells was associated with the high expression. Although not statistically significant—likely due to the limited sample size—PCTCLs with a high J2-2P/J2-3 ratio exhibited a trend towards presenting in patients with MF and having higher RNA concentrations. These observations warrant further investigation in larger studies to confirm their clinical significance. Moreover, the biological or diagnostic meaning of the 8 PCTCL cases with low J2-2P/J2-3 ratios remains an area for continued studies. These low ratios may be explained by intra-tumoral heterogeneity, instances of extremely low neoplastic T-cell fractions that persist even after macro-dissection, variations in FFPE-derived RNA integrity, or distinct biological behaviors among certain PCTCL subtypes.
Since the non-recombined J2-2P and J2-3 sequences are derived from V(D)J recombination of TCRβ repertoire, the elevated concentrations of non-recombined sequences deserve further investigation into the potential mechanism and clinical impacts. Our previous report showed higher J2-2P/J2-3 ratios in blood or bone marrow from patients with TCLs and polyclonal TCRβ results [18]. Our current study is the first report to investigate the existence of non-recombined TCR sequences in skin samples and their potential roles in PCTCLs with a negative BIOMED-2 result. The concentrations and ratios of J2-2P and J2-3 (non-recombined TCR sequences) might be possibly associated with disease status, therapeutic response, or prognosis, although we did not find such a relationship based on our limited clinical data and case number.
In addition, a highly sensitive method is crucial to quantitatively target J2-2P and J2-3 and supplement the moderate sensitivity of BIOMED-2 multiplex PCR for PCTCLs. Notably, dPCR performed well in detecting minimal residual disease for leukemia and lymphoma due to its high sensitivity to detect low amplicon numbers [30]. In addition, dPCR enables the detection and absolute quantitation of rare targets with a higher sensitivity by partitioning samples into thousands or millions of individual PCR reactions, allowing for the amplification and detection of even a single target molecule [31]. This absolute partitioning is highly advantageous for detecting the low absolute concentrations of J2-2P copies seen in certain clinical samples, mitigating the measurement reliability issues typically encountered in conventional qPCR. Herein, using the dPCR method to target the J2-2P and J2-3 sequences may be a good strategy to supplement the detection of PCTCLs after the BIOMED-2 clonality assay and provide an early diagnosis in small biopsy specimens and low tumor cellularity. With the improvement in detecting early cancer, patients with PCTCLs can largely benefit from personalized approaches and immunotherapy [32].
This study comes with several limitations. First, the study is a retrospective analysis of a limited-sized patient cohort and controls from a single medical facility, which may limit the generalizability of the results. Prospective, multi-center, large case cohorts, and large benign mimics are needed for further validation and clinical correlation. Second, we only selected clinicopathologically-proven PCTCL cases with a negative result of the BIOMED-2 clonality assay for testing, which did not inform the sensitivity of our method. Furthermore, while our control group of 11 inflammatory dermatoses provided a preliminary assessment of specificity, the exclusion of a larger cohort of non-PCTCL clinical mimics restricts our ability to fully define the diagnostic specificity of the J2-2P/J2-3 ratio. However, we aim to develop a supplementary method for the missing PCTCL cases in the BIOMED-2 clonality assay in this report. Third, we did not compare the current method to more advanced but expensive technologies, such as TCR gene high-throughput sequencing analysis. Although high-throughput sequencing might become more and more prevalent for clonality evaluations in PCTCLs [33-36], a recent report employing TCR sequencing in skin tissues demonstrated a sensitivity of 68% and a specificity of 100% in distinguishing PCTCLs from reactive conditions [35]. These detection rates are not dominantly superior to those obtained with the BIOMED-2 clonality assay. Moreover, utilizing high-throughput sequencing for the TCR gene in evaluating clonality and T-cell fractions is much more time-consuming and expensive than the current dPCR method. Fourth, the limited number of non-MF PCTCL cases restricts our ability to draw definitive conclusions about the performance of this biomarker across all PCTCL subtypes, as explored in our subtype stratification.
5. Conclusion
In conclusion, our study shows that probing the non-recombined J2-2P and J2-3 sequences using dPCR is promising for adjunctively diagnosing PCTCLs with a negative BIOMED-2 result. The method can identify PCTCLs with a higher J2-2P/J2-3 ratio than those of reactive skin lesions and serves as supplementary testing for equivocal or negative results in the BIOMED-2 assay. The high concentrations of non-recombined TCR sequences may indicate clonal relatedness and warrant further investigation and exploration. In addition, prospective validation in large cohorts is critical before clinical metrics such as sensitivity, specificity, and predictive values can be fully assessed.
Supplementary Material
Supplementary figures and tables.

Acknowledgements
Funding support
This study was funded by grants from the National Science and Technology Council (NSTC 113-2221-E-006-194-MY3 and NSTC 113-2320-B-705-002) and the Ditmanson Medical Foundation Chia-Yi Christian Hospital (CYCH-R111-48).
Author contributions
Chien-Chin Chen: Conceptualization, formal analysis, visualization, funding acquisition, software, writing - original draft.
Cheng-Lin Wu: Resources, writing - original draft.
Bo-Jiun Tzeng: Investigation, methodology.
Pin-Jun Chen: Investigation, methodology.
Wan-Li Chen: Investigation, methodology.
Sern Yan Lim: visualization.
Yi-Lin Chen: Conceptualization, funding acquisition, project administration, supervision.
Chung-Liang Ho: funding acquisition, project administration, supervision.
Tsunglin Liu: Conceptualization, formal analysis, software, supervision, Writing - review & editing, project administration.
Ethics approval and consent to participate
The study was conducted in accordance with the Declaration of Helsinki, the International Conference on Harmonization guidelines, the principles of Good Clinical Practice, and applicable local regulatory requirements. The study protocol was approved by the Institutional Review Board of National Cheng Kung University Hospital (NCKUH) (Number: B-ER-110-042, project period: 2021.04.27 to 2025.12.31). The requirement for patient-informed consent was waived because only de-identified cases were used.
Data availability statement
The data presented in this study are provided within the manuscript or supplementary information files.
Competing Interests
The authors have declared that no competing interest exists.
References
1. Willemze R, Jaffe ES, Burg G. et al. WHO-EORTC classification for cutaneous lymphomas. Blood. 2005;105(10):3768-3785 doi:10.1182/blood-2004-09-3502
2. Alaggio R, Amador C, Anagnostopoulos I. et al. The 5th edition of the World Health Organization Classification of Haematolymphoid Tumours: Lymphoid Neoplasms. Leukemia. 2022;36(7):1720-1748 doi:10.1038/s41375-022-01620-2
3. Kempf W, Pulitzer M, Willemze R. et al. Introduction to primary cutaneous T-cell neoplasms. In: WHO Classification of Tumours Editorial Board. Haematolymphoid tumours [Internet; beta version ahead of print]. Lyon (France): International Agency for Research on Cancer; 2022 [cited. 2023 June 10]. (WHO classification of tumours series, 5th ed.; vol. 11). Available from: https://tumourclassification.iarc.who.int/chapters/63
4. Cai ZR, Chen ML, Weinstock MA, Kim YH, Novoa RA, Linos E. Incidence Trends of Primary Cutaneous T-Cell Lymphoma in the US From 2000 to 2018: A SEER Population Data Analysis. JAMA Oncol. 2022;8(11):1690-1692 doi:10.1001/jamaoncol.2022.3236
5. Kamarádová K, Hrochová K, Salavec M, Belada D. T-cell receptor antibodies expression in benign and malignant cutaneous lymphoid infiltrates in comparison with T-cell receptor gene rearrangement and its diagnostic utility in borderline cases. Pathol Res Pract. 2020;216(12):153279 doi:10.1016/j.prp.2020.153279
6. Wu CL, Chang SW, Lee JY. et al. Distribution and clinical features of lymphomas involving skin in Taiwan. Kaohsiung J Med Sci. 2023;39(5):522-532 doi:10.1002/kjm2.12659
7. Hague C, Farquharson N, Menasce L, Parry E, Cowan R. Cutaneous T-cell lymphoma: diagnosing subtypes and the challenges. Br J Hosp Med (Lond). 2022;83(4):1-7 doi:10.12968/hmed.2021.0149
8. Nakai S, Kiyohara E, Watanabe R. Malignant and Benign T Cells Constituting Cutaneous T-Cell Lymphoma. Int J Mol Sci. 2021;22(23):12933 doi:10.3390/ijms222312933
9. Pimpinelli N, Olsen EA, Santucci M. et al. Defining early mycosis fungoides. J Am Acad Dermatol. 2005;53(6):1053-1063 doi:10.1016/j.jaad.2005.08.057
10. Olsen E, Vonderheid E, Pimpinelli N. et al. Revisions to the staging and classification of mycosis fungoides and Sezary syndrome: a proposal of the International Society for Cutaneous Lymphomas (ISCL) and the cutaneous lymphoma task force of the European Organization of Research and Treatment of Cancer (EORTC) [published correction appears in Blood. 2008 May 1;111(9):4830]. Blood. 2007;110(6):1713-1722 doi:10.1182/blood-2007-03-055749
11. Vandergriff T, Nezafati KA, Susa J. et al. Defining early mycosis fungoides: validation of a diagnostic algorithm proposed by the International Society for Cutaneous Lymphomas. J Cutan Pathol. 2015;42(5):318-328 doi:10.1111/cup.12470
12. van Dongen JJ, Langerak AW, Brüggemann M. et al. Design and standardization of PCR primers and protocols for detection of clonal immunoglobulin and T-cell receptor gene recombinations in suspect lymphoproliferations: report of the BIOMED-2 Concerted Action BMH4-CT98-3936. Leukemia. 2003;17(12):2257-2317 doi:10.1038/sj.leu.2403202
13. Langerak AW, Groenen PJ, Brüggemann M. et al. EuroClonality/BIOMED-2 guidelines for interpretation and reporting of Ig/TCR clonality testing in suspected lymphoproliferations. Leukemia. 2012;26(10):2159-2171 doi:10.1038/leu.2012.246
14. López Aventín D, Gallardo F, Colomo L. et al. Diagnostic Value of Genotypic Analysis in Primary Cutaneous Lymphomas using Standardized BIOMED-2 Polymerase Chain Reaction Protocols: Experience in Daily Clinical Practice. Acta Derm Venereol. 2021;101(5):adv00460 doi:10.2340/00015555-3828
15. Sandberg Y, Heule F, Lam K. et al. Molecular immunoglobulin/T- cell receptor clonality analysis in cutaneous lymphoproliferations. Experience with the BIOMED-2 standardized polymerase chain reaction protocol. Haematologica. 2003;88(6):659-670
16. Chen YL, Su IJ, Cheng HY. et al. BIOMED-2 protocols to detect clonal immunoglobulin and T-cell receptor gene rearrangements in B- and T-cell lymphomas in southern Taiwan. Leuk Lymphoma. 2010;51(4):650-655 doi:10.3109/10428191003660631
17. Lukowsky A, Muche JM, Möbs M. et al. Evaluation of T-cell clonality in archival skin biopsy samples of cutaneous T-cell lymphomas using the biomed-2 PCR protocol. Diagn Mol Pathol. 2010;19(2):70-77 doi:10.1097/PDM.0b013e3181b2a1b7
18. Chen YL, Ho CL, Hung CY. et al. Enhancing diagnosis of T-cell lymphoma using non-recombined T-cell receptor sequences. Front Oncol. 2022;12:1014132 doi:10.3389/fonc.2022.1014132
19. Chen YL, Chen WL, Cheng YC. et al. Development of a novel ALK rearrangement screening test for non-small cell lung cancers. PLoS One. 2021;16(9):e0257152 doi:10.1371/journal.pone.0257152
20. Low H, Chan SJ, Soo GH, Ling B, Tan EL. Clarity™ digital PCR system: a novel platform for absolute quantification of nucleic acids. Anal Bioanal Chem. 2017;409(7):1869-1875 doi:10.1007/s00216-016-0131-7
21. Lee DK, In J, Lee S. Standard deviation and standard error of the mean. Korean J Anesthesiol. 2015;68(3):220-223 doi:10.4097/kjae.2015.68.3.220
22. Dobos G, Pohrt A, Ram-Wolff C. et al. Epidemiology of Cutaneous T-Cell Lymphomas: A Systematic Review and Meta-Analysis of 16,953 Patients. Cancers (Basel). 2020;12(10):2921 Published 2020 Oct 11. doi:10.3390/cancers12102921
23. Lee C-N, Hsu C-K, Chang K-C, Wu C-L, Chen T-Y, Lee JY-Y. Cutaneous lymphomas in Taiwan: A review of 118 cases from a medical center in southern Taiwan. Dermatologica Sinica. 2018;36(1):16-24 doi: 10.1016/j.dsi.2017.08.004
24. Goodlad JR, Cerroni L, Swerdlow SH. Recent advances in cutaneous lymphoma-implications for current and future classifications. Virchows Arch. 2023;482(1):281-298 doi:10.1007/s00428-022-03421-5
25. Walia R, Yeung CCS. An Update on Molecular Biology of Cutaneous T Cell Lymphoma. Front Oncol. 2020;9:1558 doi:10.3389/fonc.2019.01558
26. Lukowsky A, Muche JM, Sterry W, Audring H. Detection of expanded T cell clones in skin biopsy samples of patients with lichen sclerosus et atrophicus by T cell receptor-gamma polymerase chain reaction assays. J Invest Dermatol. 2000;115(2):254-259 doi:10.1046/j.1523-1747.2000.00040.x
27. Ponti R, Quaglino P, Novelli M. et al. T-cell receptor gamma gene rearrangement by multiplex polymerase chain reaction/heteroduplex analysis in patients with cutaneous T-cell lymphoma (mycosis fungoides/Sézary syndrome) and benign inflammatory disease: correlation with clinical, histological and immunophenotypical findings. Br J Dermatol. 2005;153(3):565-573 doi:10.1111/j.1365-2133.2005.06649.x
28. Qayyum S, Bullock GC, Swerdlow SH, Brower R, Nikiforova M, Aggarwal N. Diagnostic Utility of Isolated Tube C Positivity in T-Cell Receptor β Testing Using BIOMED-2 Primers. Am J Clin Pathol. 2019;151(4):386-394 doi:10.1093/ajcp/aqy157
29. Schachter O, Tabibian-Keissar H, Debby A, Segal O, Baum S, Barzilai A. Evaluation of the polymerase chain reaction-based T-cell receptor β clonality test in the diagnosis of early mycosis fungoides. J Am Acad Dermatol. 2020;83(5):1400-1405 doi:10.1016/j.jaad.2020.05.110
30. Shirai R, Osumi T, Keino D. et al. Minimal residual disease detection by mutation-specific droplet digital PCR for leukemia/lymphoma. Int J Hematol. 2023;117(6):910-918 doi:10.1007/s12185-023-03566-2
31. Zhang L, Parvin R, Fan Q, Ye F. Emerging digital PCR technology in precision medicine. Biosens Bioelectron. 2022;211:114344 doi:10.1016/j.bios.2022.114344
32. Dai J, Duvic M. Cutaneous T-Cell Lymphoma: Current and Emerging Therapies. Oncology (Williston Park). 2023;37(2):55-62 doi:10.46883/2023.25920984
33. Kirsch IR, Watanabe R, O'Malley JT. et al. TCR sequencing facilitates diagnosis and identifies mature T cells as the cell of origin in CTCL. Sci Transl Med. 2015;7(308):308ra158 doi:10.1126/scitranslmed.aaa9122
34. Sufficool KE, Lockwood CM, Abel HJ. et al. T-cell clonality assessment by next-generation sequencing improves detection sensitivity in mycosis fungoides. J Am Acad Dermatol. 2015;73(2):228-36.e2 doi:10.1016/j.jaad.2015.04.030
35. Rea B, Haun P, Emerson R. et al. Role of high-throughput sequencing in the diagnosis of cutaneous T-cell lymphoma. J Clin Pathol. 2018;71(9):814-820 doi:10.1136/jclinpath-2018-205004
36. de Masson A, O'Malley JT, Elco CP. et al. High-throughput sequencing of the T cell receptor β gene identifies aggressive early-stage mycosis fungoides. Sci Transl Med. 2018;10(440):eaar5894 doi:10.1126/scitranslmed.aar5894
Author contact
Corresponding authors: Chung-Liang Ho, M.D., Ph. D., clh9ncku.edu.tw; Yi-Lin Chen, M. S., emeraldncku.edu.tw; Tsunglin Liu, Ph. D., tsunglinncku.edu.tw.