Impact Factor ISSN: 1837-9664




J Cancer 2026; 17(12):1996-2006. doi:10.7150/jca.142566 This issue Cite
Research Paper
Dynamic Postoperative Skeletal Muscle Trajectories Predict Survival in Stage II-III Gastric Cancer
Jeong Eun Kim1#, Song Ee Park2#, Jin Hwa Choi3,4  , In Gyu Hwang3,5
1. Department of Oncology, Chung-Ang University Hospital, Chung-Ang University College of Medicine, Seoul, South Korea
2. Department of Oncology, Seoul St. Mary's Hospital, College of Medicine, The Catholic University of Korea
3. Chung-Ang University Integrated Oncology and Palliative Care Research Institute, Seoul, Korea
4. Department of Radiation Oncology, Chung-Ang University College of Medicine, Seoul, South Korea
5. Department of Internal Medicine, Chung-Ang University College of Medicine, Seoul, South Korea
# These authors contributed equally to this work.
Received 2026-8-14; Accepted 2026-10-3; Published 2026-11-6
Abstract
Background: Although sarcopenia is associated with poor outcomes in gastric cancer, single-time-point assessment may not adequately capture clinically meaningful postoperative muscle dynamics. This study aimed to evaluate the prognostic significance of longitudinal skeletal muscle index (SMI) trajectory analysis in patients with stage II-III gastric cancer who underwent curative gastrectomy.
Methods: This retrospective study included 217 patients with stage II-III gastric cancer who underwent curative gastrectomy between 2011 and 2017. SMI was measured on computed tomography at baseline, 3-6 months, and 12 months postoperatively. A total of 181 patients with both postoperative CT scans were classified into four trajectory groups according to sequential SMI changes during the early and late postoperative intervals. Disease-free survival (DFS) and overall survival (OS) were analyzed using Kaplan-Meier estimates and Cox proportional hazards models.
Results: Baseline sarcopenia was present in 29.5% of patients. Mean SMI declined by 6.5% at 3-6 months and remained 7.2% below baseline at 12 months. However, longitudinal SMI trajectory analysis revealed heterogeneous postoperative muscle patterns, including early muscle loss followed by partial recovery. SMI trajectories were significantly associated with DFS and OS, with clear survival differences across the four groups (p = 0.042 and p < 0.001, respectively). Patients with maintained or recovered SMI showed more favorable 5-year DFS and OS than those with continuous muscle depletion. In multivariable analyses, SMI trajectory (DFS, p = 0.029; OS, p < 0.001), stage, and baseline sarcopenia were independently associated with survival outcomes.
Conclusions: Longitudinal SMI trajectory analysis provides clinically relevant prognostic information beyond static assessment of sarcopenia. Postoperative muscle loss after gastrectomy is dynamic rather than uniformly progressive, and serial SMI monitoring may help identify patients who could benefit from nutrition, exercise, and rehabilitation-based supportive care after curative treatment for stage II-III gastric cancer.
Keywords: Sarcopenia, Skeletal muscle index, Postoperative muscle trajectory, Gastric cancer, Survival
Introduction
Gastric cancer continues to pose a significant health challenge worldwide. Although there have been improvements in surgical procedures and perioperative care, the long-term results after curative gastrectomy for stage II-III cancers are still not ideal. Nutritional health and body composition are increasingly recognized as crucial factors influencing postoperative recovery and survival in patients with gastric cancer. In particular, the body mass index (BMI) and skeletal muscle mass have emerged as clinically relevant prognostic factors [1-6].
A low BMI is associated with increased postoperative complications and poor long-term survival in patients with gastric cancer. Preoperative underweight status is associated with inferior overall survival, while both perioperative BMI and postoperative weight loss have prognostic significance [7]. However, BMI alone does not adequately reflect alterations in body composition, particularly in skeletal muscle mass, which plays a central role in cancer-related cachexia and functional decline.
Sarcopenia, defined as a low skeletal muscle mass, is an independent predictor of postoperative morbidity and mortality in patients with gastric cancer undergoing gastrectomy [8-10]. Preoperative sarcopenia has been linked to increased postoperative complications and reduced long-term survival even in patients with a normal BMI [9, 11]. These findings highlight the limitations of BMI-based assessment and underscore the prognostic importance of skeletal muscle evaluation.
Nevertheless, most previous studies have focused on the static assessment of body composition, typically at a single preoperative or early postoperative time point. These approaches implicitly assume that skeletal muscle loss is unidirectional and irreversible. Emerging evidence from advanced and metastatic gastric cancer suggests that ongoing skeletal muscle loss during systemic therapy is also associated with poor prognosis [12]. However, the longitudinal behavior of skeletal muscle after curative gastrectomy in non-metastatic disease remains insufficiently characterized.
Skeletal muscle is a dynamic tissue that responds to surgical stress, adjuvant therapy, nutritional support, and physical activity. Whether postoperative skeletal muscle loss is uniformly progressive or whether muscle mass recovery occurs, and if so, whether such recovery has prognostic significance, has not been systematically investigated in patients with resectable gastric cancer. In particular, the clinical relevance of the late postoperative muscle dynamics beyond the early postoperative period remains unclear.
Therefore, the present study aimed to longitudinally investigate the postoperative skeletal muscle index (SMI) changes using serial computed tomography (CT) in patients with stage II-III gastric cancer who underwent curative gastrectomy. By classifying patients into distinct postoperative SMI trajectory groups, we sought to clarify the heterogeneity of postoperative muscle changes and determine the prognostic significance of muscle recovery and late postoperative muscle resilience for disease-free survival (DFS) and overall survival (OS).
Methods
Study Design and Population
This retrospective observational study included patients with stage II-III gastric adenocarcinoma who underwent curative gastrectomy at the Chung-Ang University College of Medicine between January 2011 and December 2017. Eligible patients met the following criteria: (1) histologically confirmed gastric adenocarcinoma; (2) pathological stage II or III according to the American Joint Committee on Cancer (AJCC) 8th edition [13]; (3) complete tumor resection with negative margins (R0 resection); (4) availability of a baseline contrast-enhanced abdominopelvic computed tomography (CT) scan; (5) Eastern Cooperative Oncology Group (ECOG) performance status of 0-2; and (6) complete clinical follow-up data for survival analysis. Patients with recurrent disease at the initial diagnosis were excluded. The primary endpoints were the magnitude of postoperative changes in SMI and the incidence of sarcopenia following surgery. Secondary endpoints included the changes in body weight and BMI, OS, and the association between longitudinal SMI trajectories and survival outcomes. DFS was defined as the interval from the date of curative surgery to the first occurrence of tumor recurrence or death from any cause. OS was defined as the time from surgery to death from any cause. Of these, 181 patients with CT scans at both postoperative time points (3-6 and 12 months) were included in the SMI trajectory analyses; the remaining 36 patients (no postoperative CT, n = 13; one postoperative CT, n = 23) were excluded from these analyses (Fig. S1). This study was approved by the Institutional Review Board of Chung-Ang University Hospital (IRB No. 2407-002-19530), and the requirement for informed consent was waived owing to its retrospective nature.
Body Composition Assessment
Body composition was assessed using axial CT images at the level of the third lumbar vertebra (L3) following previously validated methodologies. The skeletal muscle area (cm²) at the L3 level was quantified using standard Hounsfield unit thresholds (-29 to +150 HU). SMI was calculated as the skeletal muscle area divided by height squared (cm²/m²). Sarcopenia was defined using sex-specific cut-off values previously applied in CT-based studies of Korean patients with gastric cancer (men: SMI < 49 cm²/m²; women: SMI < 31 cm²/m²) [12, 14]. BMI was calculated as weight divided by height squared (kg/m²) and categorized according to Asian-specific criteria: underweight (< 18.5 kg/m²), normal weight (18.5-22.9 kg/m²), and overweight (≥ 23.0 kg/m²) [15]. For Fig. 2B, high and low SMI were defined using the median baseline SMI of the cohort (47.8 cm²/m²) as the cutoff. CT scans were analyzed at three predefined time points: baseline, first follow-up (3-6 months postoperatively, during adjuvant chemotherapy, or routine surveillance), and second follow-up (12 months post-surgery).
Classification of Postoperative SMI Changes
To further characterize heterogeneous postoperative muscle trajectories, we developed a categorical classification based on sequential SMI changes across three predefined postoperative intervals: baseline to 3-6 months (interval 1), 3-6 to 12 months (interval 2), and baseline to 12 months (interval 3). This trajectory-based framework was designed to distinguish transient muscle loss from subsequent recovery from sustained or progressive muscle deterioration.
Interval 1

Interval 2

Interval 3

Accordingly, patients were classified into four groups:
Group 1: maintained or increased SMI during both intervals;
Group 2: maintained or increased SMI during interval 1, followed by a decrease during interval 2;
Group 3: decreased SMI during interval 1, followed by maintenance or recovery during interval 2; and
Group 4: continuous decrease in SMI during both intervals.
In addition, to evaluate the clinical relevance of late postoperative muscle dynamics, patients were further categorized into a simplified binary classification based on interval 2 behavior: an SMI-resilient group (groups 1 and 3), representing preserved or recovered muscle mass, and an SMI non-resilient group (groups 2 and 4), representing ongoing muscle loss.
Statistical Analysis
Statistical analyses were performed using R software (version 4.5.2; R Foundation for Statistical Computing, Vienna, Austria), with a two-sided significance threshold of p < 0.05. Continuous variables are summarized as mean ± standard deviation or median (range), and categorical variables as frequencies and percentages. Normality was assessed using the Shapiro-Wilk test. Longitudinal changes in SMI were analyzed using the paired Student's t-test or Wilcoxon signed-rank test, as appropriate. Changes in categorical body composition variables, including sarcopenia status, were evaluated using McNemar's test. Survival curves for OS and DFS were estimated using the Kaplan-Meier method and compared using the log-rank test. Cox proportional hazards regression models were used to identify the independent prognostic factors for OS and DFS. Variables with p < 0.20 in univariate analyses were included in multivariate models. SMI trajectory was entered into the Cox models as a categorical variable, with group 4 as the reference. Sex-stratified exploratory analyses were performed to evaluate potential sex-specific associations between SMI changes and survival outcomes. As a sensitivity analysis, the cumulative incidence of recurrence was estimated with death without recurrence treated as a competing event and compared using Gray's test, and subdistribution hazard ratios (sHRs) were estimated using the Fine-Gray model adjusted for the same covariates as the multivariate Cox model.
Results
Patient Characteristics
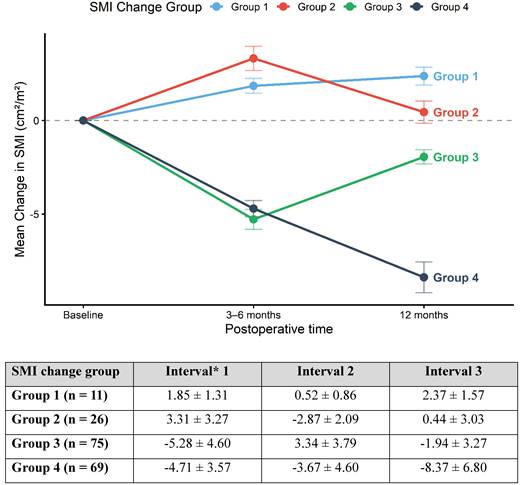
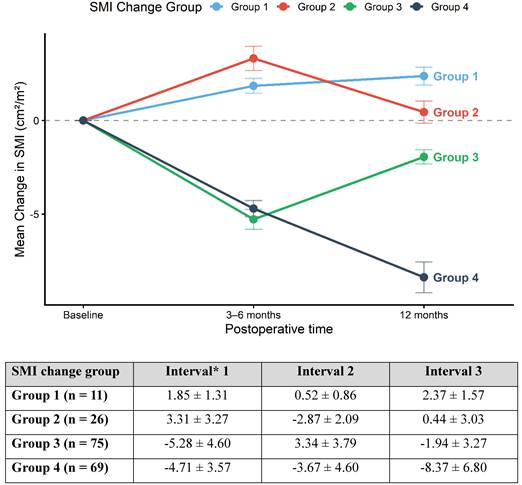
A total of 217 patients with stage II-III gastric cancer were included in the final analysis. The baseline clinical, pathological, and body composition characteristics are summarized in Table 1. The median age was 67.0 years (range, 30.0-90.0), and 69.6% of patients were male. Subtotal gastrectomy was performed in 66.4% of patients; 84.8% received adjuvant chemotherapy. The mean baseline SMI was 47.9 ± 8.6 cm²/m², and baseline sarcopenia was present in 64 patients (29.5%). A total of 181 patients with both postoperative CT scans were further classified into four groups based on postoperative SMI change trajectories (Fig. 1; Fig. S1). Baseline characteristics were generally comparable across the groups, except for baseline SMI, which was the highest in group 4 (continuous depletion) (Table S1).
Longitudinal postoperative skeletal muscle index trajectories according to SMI change groups. *Interval definitions: Interval 1: SMI change from baseline to 3-6 months; interval 2: SMI change from 3-6 to 12 months, and interval 3: overall SMI change from baseline to 12 months.
Baseline patient characteristics.
| Characteristics | Total (N = 217) |
|---|---|
| Age (years), median (range) | 67.0 (30.0-90.0) |
| Sex, n(%) Male Female | 151 (69.6%) 66 (30.4%) |
| Stage, n(%) II III | 98 (45.2%) 119 (54.8%) |
| Surgery type, n(%) Total Subtotal | 73 (33.6%) 144 (66.4%) |
| Height (cm), mean ± SD | 162.2 ± 9.1 |
| Weight (kg), mean ± SD | 61.0 ± 11.8 |
| BMI, n(%) Underweight (BMI < 18.5) Normal weight (18.5 ≤ BMI < 23) Overweight (BMI≥23) | 21 (9.7%) 89 (41.0%) 107 (49.3%) |
| Baseline SMI (cm2/m2), mean ± SD | 47.9 ± 8.6 |
| Baseline Sarcopenia, n(%) | 64 (29.5%) |
| Hemoglobin (g/dL), median (range) | 12.4 (5.1-17.3) |
| Albumin (g/dL), median (range) | 3.9 (1.4-5.0) |
| Chemotherapy Regimen, n(%) 5FL TS-1 CAPOX FOLFOX SOX Others None | 25 (11.5%) 84 (38.7%) 57 (26.3%) 4 (1.8%) 10 (4.6%) 4 (1.8%) 33 (15.2%) |
Abbreviations: 5FL, 5-fluorouracil plus leucovorin; BMI, body mass index; CAPOX, capecitabine plus oxaliplatin; FOLFOX, 5-fluorouracil/leucovorin plus oxaliplatin; SD, standard deviation; SMI, skeletal muscle index; SOX, S-1 plus oxaliplatin; TS-1, tegafur/gimeracil/oteracil.
Postoperative Longitudinal Changes in Skeletal Muscle
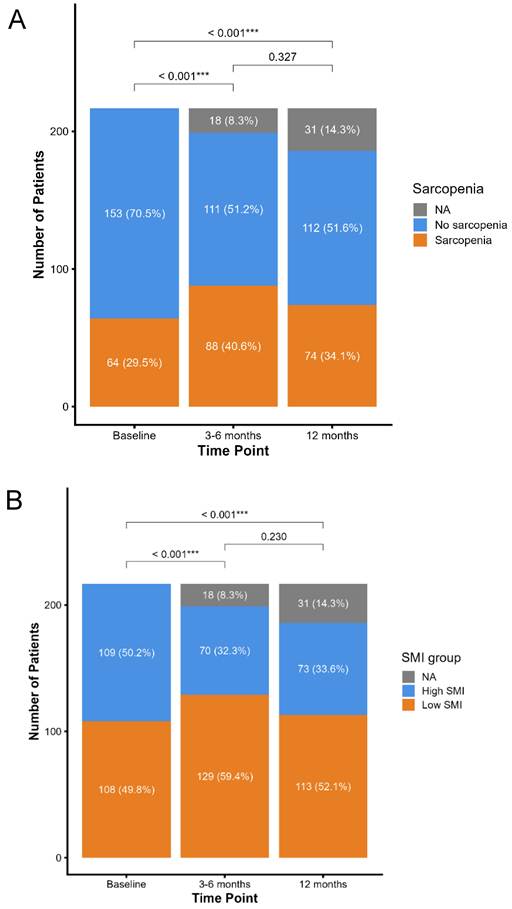
Longitudinal changes in body composition were evaluated at baseline, 3-6, and 12 months postoperatively (Table 2, Fig. 2). Overall, SMI significantly declined during the early postoperative period, decreasing from 47.9 ± 8.6 cm²/m² at baseline to 45.0 ± 7.7 cm²/m² at 3-6 months (mean change -6.5%, p < 0.001). No significant recovery was observed between 3-6 and 12 months, resulting in a sustained reduction at 12 months (44.9 ± 8.4 cm²/m²; -7.2% from baseline, p < 0.001). The prevalence of sarcopenia increased from 29.5% at baseline to 40.6% at 3-6 months, and partially decreased to 34.1% at 12 months, demonstrating that postoperative muscle loss was common but not uniformly progressive (Fig. 2). Similar temporal patterns were observed for BMI and body weight (Table 2).
Body composition values.
| 0 months | 3* months | 12 months | Interval† 1 | p value (Interval 1) | Interval 2 | p value (Interval 2) | Interval 3 | p value (Interval 3) | |
|---|---|---|---|---|---|---|---|---|---|
| Skeletal muscle index , Mean ± SD (cm2/m2) | 47.9 ± 8.6 | 45.0 ± 7.7 | 44.9 ± 8.4 | -3.5[-6.5%] | < 0.001 | -0.4 [-0.5%] | 0.293 | -3.7 [-7.2%] | < 0.001 |
| Male | 50.6 ± 7.9 | 47.3 ± 6.9 | 47.0 ± 8.3 | -4.0 [-7.3%] | < 0.001 | -0.6 [-1.3%] | 0.173 | -4.2 [-8.0%] | < 0.001 |
| Female | 41.9 ± 7.1 | 39.8 ± 7.1 | 39.9 ± 6.4 | -2.4 [-4.9%] | 0.003 | 0.1 [1.5%] | 0.831 | -2.4 [-5.3%] | < 0.001 |
| BMI, Mean ± SD (kg/m2) | 23.1 ± 3.7 | 20.9 ± 3.1 | 21.0 ± 3.1 | -2.4 [-9.9%] | < 0.001 | -0.0 [0.1%] | 0.698 | -2.3 [-9.5%] | < 0.001 |
| Male | 23.1 ± 3.6 | 20.9 ± 2.9 | 21.1 ± 2.9 | -2.4 [-9.7%] | < 0.001 | 0.1 [0.6%] | 0.667 | -2.3 [-9.2%] | < 0.001 |
| Female | 23.2 ± 3.8 | 20.9 ± 3.5 | 20.6 ± 3.4 | -2.5 [-10.3%] | < 0.001 | -0.3 [-1.3%] | 0.101 | -2.5 [-10.2%] | < 0.001 |
| Weight, Mean ± SD (kg) | 61.0 ± 11.8 | 55.4 ± 9.9 | 55.6 ± 10.2 | -6.3 [-9.8%] | < 0.001 | -0.1 [0.1%] | 0.804 | -6.2 [-9.5%] | < 0.001 |
| Male | 63.8 ± 11.4 | 57.9 ± 9.5 | 58.4 ± 9.5 | -6.5 [-9.7%] | < 0.001 | 0.2 [0.7%] | 0.641 | -6.3 [-9.2%] | < 0.001 |
| Female | 54.6 ± 10.4 | 49.8 ± 8.7 | 49.0 ± 8.7 | -5.9 [-10.3%] | < 0.001 | -0.8 [-1.3%] | 0.116 | -6.0 [-10.2%] | < 0.001 |
3* months, 3-6months; †Interval definitions, Interval 1, SMI change from baseline to 3* months; Interval 2, SMI change from 3* months to 12 months; Interval 3, overall SMI change from baseline to 12 months. Abbreviations: BMI, body mass index; SD, standard deviation; SMI, skeletal muscle index.
Longitudinal changes in sarcopenia and skeletal muscle index status following gastrectomy. (A) Changes in sarcopenia status at baseline, 3-6 months, and 12 months following gastrectomy (men, SMI < 49 cm²/m²; women, SMI < 31 cm²/m²). (B) Changes in skeletal muscle index (SMI) group status at baseline, 3-6 months, and 12 months following gastrectomy (high vs. low SMI, dichotomized at the median baseline SMI of 47.8 cm²/m²). NA, CT scan not available at the corresponding time point (missing CT follow-up). ***p < 0.001.
Postoperative SMI Trajectories and Survival
Based on sequential SMI changes across two postoperative intervals (intervals 1 and 2), patients were classified into four distinct SMI trajectory groups (Fig. 1). Group 1 maintained or increased SMI throughout the follow-up period; group 2 demonstrated transient muscle gain followed by loss; group 3 experienced early muscle loss with subsequent recovery; and group 4 exhibited continuous muscle depletion. Quantitatively, group 3 showed a mean SMI decrease of -5.28 ± 4.60 cm²/m² during the first interval, followed by recovery (+3.34 ± 3.79 cm²/m²) during the second interval, whereas group 4 showed a persistent decline across both intervals (Fig. 1).
The postoperative SMI trajectories were significantly associated with both DFS and OS (Fig. 3). DFS differed significantly among the four groups (p = 0.042). The recovery group (group 3) demonstrated the most favorable prognosis, with a 5-year DFS rate of 68.5%, followed by groups 1 (54.5%), 2 (48.9%), and 4 (44.0%). A more pronounced separation was observed for OS (p < 0.001). Five-year OS rates were highest in groups 1 (80.8%) and 3 (82.2%), whereas group 4 had the poorest outcome (41.3%).
Disease-free and overall survival according to postoperative skeletal muscle index change trajectories. (A) Disease free survival (DFS). (B) Overall survival (OS) (n = 181).
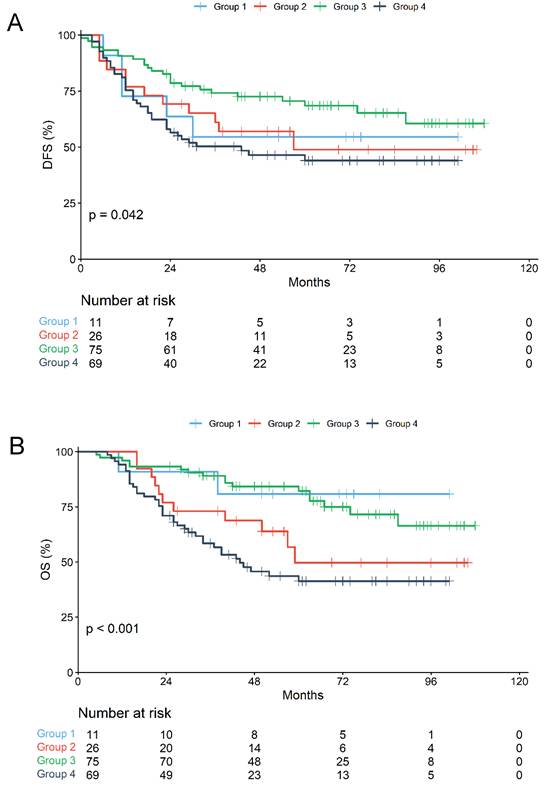
Analysis of DFS events revealed that death without documented recurrence accounted for a larger proportion of events in group 4 (12 of 37, 32.4%) than in groups 1-3 (8.3-20.0%) (Fig. 3, Table S2). In a competing-risk sensitivity analysis treating death without recurrence as a competing event, the cumulative incidence of recurrence did not differ significantly among the four trajectory groups (5-year cumulative incidence: group 1, 36.4%; group 2, 47.3%; group 3, 28.1%; group 4, 36.5%; Gray's test, p = 0.405), and SMI trajectory was not independently associated with recurrence in the Fine-Gray model (group 3 vs. group 4, sHR 0.709, 95% CI 0.378-1.327; overall p = 0.660). In contrast, the 5-year cumulative incidence of death without recurrence tended to be higher in group 4 than in group 3 (19.5% vs. 3.4%; Gray's test, p = 0.058) (Table S5). These findings suggest that the association between SMI trajectory and DFS was driven largely by deaths without recurrence.
Late Postoperative Muscle Resilience and Survival
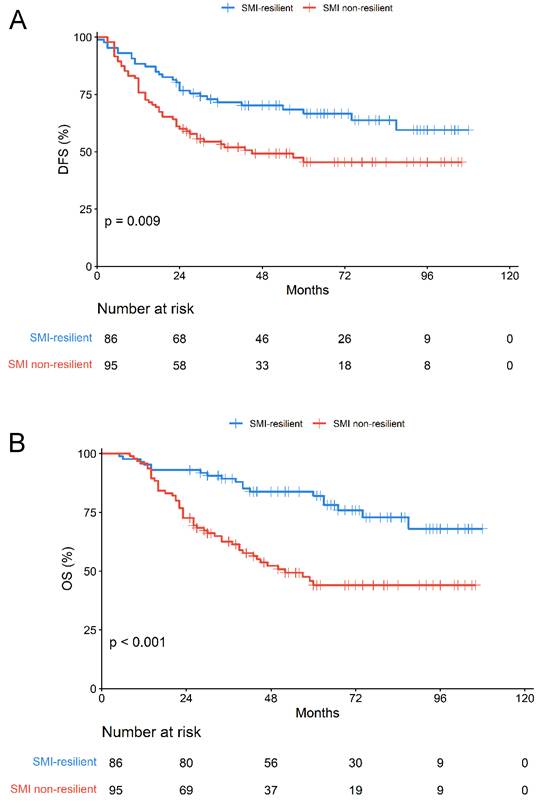
We determined how SMI changes in interval 2 influenced long-term outcomes regardless of the initial changes observed in interval 1. Based on their SMI trajectories during interval 2, patients were reclassified into two groups: the resilient group (maintained or recovered SMI: groups 1 and 3) and the non-resilient group (decreased SMI: groups 2 and 4). Patients in the resilient group showed significantly better DFS (p = 0.009) and OS (p < 0.001) than those in the non-resilient group (Fig. 4).
Disease-free and overall survival according to late postoperative skeletal muscle resilience. (A) Disease free survival (DFS). (B) Overall survival (OS) (n = 181).
Univariable, Multivariable, and Sex-Stratified Analyses
In the univariate Cox regression analyses, advanced stage and baseline sarcopenia were associated with worse survival outcomes, whereas adjuvant chemotherapy and subtotal gastrectomy were associated with improved DFS and OS. In multivariate analyses, SMI trajectory (overall p = 0.029 for DFS and p < 0.001 for OS; group 3 vs. group 4, HR 0.469 and 0.306, respectively), stage, and baseline sarcopenia were independently associated with both DFS and OS (Tables 3 and 4). Exploratory sex-stratified analyses demonstrated that the adverse prognostic effect of late muscle loss was more pronounced in males (Table S3).
Univariate and multivariate analysis according to disease-free survival.
| Univariate analysis | Multivariate analysis | |||
|---|---|---|---|---|
| Characteristics | HR (95%CI) | p value | HR (95%CI) | p value |
| Age > 65 | 1.680 (1.136-2.484) | 0.009 | 1.281 (0.802-2.047) | 0.300 |
| Male Sex | 0.831 (0.556-1.241) | 0.364 | — | — |
| Stage III | 4.451 (2.820-7.027) | < 0.001 | 3.998 (2.397-6.668) | <0.001 |
| BMI < 18.5 | 1.993 (1.113-3.568) | 0.020 | 2.311 (1.059-5.046) | 0.035 |
| Chemotherapy | 0.387 (0.245-0.610) | < 0.001 | 0.545 (0.235-1.267) | 0.159 |
| Subtotal gastrectomy | 0.614 (0.417-0.905) | 0.014 | 0.796 (0.483-1.312) | 0.371 |
| Hb < 10 | 1.750 (1.160-2.643) | 0.008 | 1.738 (0.989-3.055) | 0.055 |
| Albumin < 3.5 | 1.448 (0.936-2.241) | 0.096 | 1.030 (0.558-1.901) | 0.924 |
| Baseline sarcopenia | 1.854 (1.252-2.745) | 0.002 | 1.715 (1.054-2.791) | 0.030 |
| SMI trajectory | 0.040 | 0.029 | ||
| Group 4 (reference) | Reference | Reference | ||
| Group 1 vs Group 4 | 0.786 (0.309-2.001) | 0.614 | 0.377 (0.124-1.142) | 0.085 |
| Group 2 vs Group 4 | 0.787 (0.410-1.511) | 0.472 | 0.665 (0.332-1.333) | 0.251 |
| Group 3 vs Group 4 | 0.478 (0.285-0.799) | 0.005 | 0.469 (0.275-0.800) | 0.005 |
Abbreviations: BMI, body mass index; CI, confidence interval; Hb, hemoglobin; HR, hazard ratio; SMI, skeletal muscle index. Analyses including SMI trajectory were performed in 181 patients with evaluable trajectories.
Univariate and multivariate analysis according to overall survival.
| Univariate analysis | Multivariate analysis | |||
|---|---|---|---|---|
| Characteristics | HR (95%CI) | p value | HR (95%CI) | p value |
| Age > 65 | 1.684 (1.112-2.551) | 0.014 | 1.225 (0.737-2.036) | 0.433 |
| Male sex | 0.823 (0.538-1.261) | 0.371 | — | — |
| Stage III | 4.932 (2.976-8.172) | < 0.001 | 4.459 (2.507-7.930) | <0.001 |
| BMI <18.5 | 1.873 (0.996-3.521) | 0.051 | 1.749 (0.683-4.477) | 0.244 |
| Chemotherapy | 0.321 (0.200-0.516) | < 0.001 | 0.434 (0.172-1.093) | 0.076 |
| Subtotal gastrectomy | 0.566 (0.375-0.853) | 0.007 | 0.754 (0.442-1.286) | 0.300 |
| Hb < 10 | 1.350 (0.859-2.121) | 0.193 | 1.049 (0.556-1.981) | 0.882 |
| Albumin < 3.5 | 1.327 (0.830-2.123) | 0.237 | — | — |
| Baseline sarcopenia | 1.940 (1.286-2.926) | 0.002 | 1.852 (1.114-3.078) | 0.017 |
| SMI trajectory | <0.001 | <0.001 | ||
| Group 4 (reference) | Reference | Reference | ||
| Group 1 vs Group 4 | 0.245 (0.059-1.020) | 0.053 | 0.122 (0.026-0.562) | 0.007 |
| Group 2 vs Group 4 | 0.667 (0.340-1.308) | 0.238 | 0.518 (0.247-1.086) | 0.082 |
| Group 3 vs Group 4 | 0.309 (0.174-0.551) | <0.001 | 0.306 (0.167-0.563) | <0.001 |
Abbreviations: BMI, body mass index; CI, confidence interval; Hb, hemoglobin; HR, hazard ratio; SMI, skeletal muscle index. Analyses including SMI trajectory were performed in 181 patients with evaluable trajectories.
Discussion
The results of this study showed that postoperative skeletal muscle changes in stage II-III gastric cancer are heterogeneous and can be classified into distinct longitudinal trajectories. Importantly, skeletal muscle mass recovery following early postoperative loss, rather than the occurrence of muscle loss itself, was associated with improved survival. Postoperative skeletal muscle dynamics are not limited to continuous muscle loss: some patients experienced persistent depletion, whereas others showed partial recovery or fluctuating changes over time. These findings suggest that postoperative sarcopenia is a dynamic process rather than a uniformly progressive condition [16].
Accordingly, dynamic muscle trajectories and late postoperative muscle resilience provide important prognostic insights beyond the conventional baseline sarcopenia assessments.
Our findings demonstrate that postoperative skeletal muscle changes in stage II-III gastric cancer can be categorized into four distinct longitudinal trajectories, revealing diverse patterns of muscle remodeling. This approach extends the existing evidence that skeletal muscle status after gastrectomy is prognostic; postoperative muscle loss is associated with poor survival outcomes following gastric cancer surgery, with surgery-induced sarcopenia independently predicting mortality and relapse-free survival [16]. By capturing dynamic patterns across multiple time points, our trajectory-based classification provided deeper insights into postoperative muscle behavior than static post-surgical measurements alone.
A key result of our study was that recovery of muscle mass, despite an initial postoperative decline, was closely linked to better disease-free and overall survival. This indicates that regaining muscle later after surgery might reduce the negative effects of early muscle loss. Past research mainly highlighted the harmful effects of preoperative sarcopenia on surgical outcomes, such as increased complications and lower long-term survival. Meta-analyses have shown strong links between sarcopenia and higher risks of mortality and complications following gastrectomy [17]. The prognostic relevance of postoperative muscle recovery has not been thoroughly investigated in gastric cancer cohorts, highlighting the need for further research in this area.
Unlike traditional studies that examine sarcopenia at a single time point—usually preoperative or early postoperative—our findings show that observing dynamic, longitudinal changes in skeletal muscle offers a stronger prognostic value than static assessments. Preoperative sarcopenia has consistently been associated with negative outcomes, such as impaired long-term survival in patients undergoing gastrectomy [18].
In our study, the ability of muscles to maintain or recover post-surgery—detectable only through repeated measurements—proved to be a crucial factor influencing both disease-free and overall survival. This highlights the importance of including serial muscle evaluations in postoperative care, rather than relying solely on initial muscle mass measurements.
Our sex-stratified analysis (Table S3) revealed that the adverse prognostic effect of late postoperative muscle loss was more pronounced in male than in female patients. Although the exact mechanism remains unclear, this sex-specific difference may be attributed to baseline physiological differences, such as relatively higher average muscle mass and distinct hormonal profiles in males [2], which may enhance susceptibility to the physiological stress of sustained muscle depletion. These findings are consistent with those of previous research, indicating that surgery-induced sarcopenia is a particularly significant prognostic factor in male patients [16].
The first follow-up CT (median, 3.8 months after surgery) was obtained during adjuvant chemotherapy in most patients, and chemotherapy-related toxicity may have contributed to early muscle loss [12]. However, interval 1 SMI change did not differ according to receipt of chemotherapy, regimen, or early discontinuation and was not significantly correlated with scan timing (Table S4), suggesting that early muscle loss was driven mainly by surgery and postgastrectomy nutritional changes.
Because all patients underwent R0 resection, early postoperative muscle loss is more likely attributable to gastrectomy-related nutritional impairment and adjuvant chemotherapy than to tumor-driven cachexia; consistently, the distribution of trajectory groups did not differ between stage II and III disease (p = 0.472). However, DFS events occurring before the second follow-up CT were concentrated in the non-resilient groups, suggesting that late muscle loss may partly reflect cachexia associated with recurrence [19].
This study has several important clinical implications. The observation that delayed postoperative muscle recovery is associated with improved survival suggests that postoperative sarcopenia should not be considered irreversible. Instead, skeletal muscle mass is a modifiable prognostic factor, particularly in the late postoperative period. Routine longitudinal monitoring of skeletal muscles using clinically available CT imaging may help identify high-risk patients who could benefit from targeted nutritional support, exercise-based rehabilitation, or multimodal cachexia interventions after gastrectomy.
Future prospective studies are necessary to confirm these findings in multicenter cohorts and determine the optimal thresholds and timeframes for meaningful muscle recovery in clinical settings. Interventional trials that include structured exercises, nutritional supplementation, or anti-inflammatory strategies should focus on whether enhancing late postoperative muscle resilience can improve oncological outcomes. Furthermore, integrating biological markers of inflammation, metabolism, and tumor burden could help elucidate the mechanisms linking muscle dynamics to cancer prognosis.
This study has several limitations. First, this was a retrospective, single-center analysis, which may limit generalizability and introduce residual confounding factors despite comprehensive multivariable adjustment. Second, detailed data on postoperative nutritional intake, physical activity, inflammatory markers, and rehabilitation interventions were not available, precluding a mechanistic exploration of the factors driving muscle recovery. Third, although serial CT imaging enabled objective longitudinal assessment of skeletal muscle, imaging time points were determined based on routine clinical practice rather than a standardized research protocol, and trajectory analysis was limited to patients with both follow-up scans. Fourth, cancer cachexia could not be formally assessed owing to the lack of data on preoperative weight loss and inflammatory markers. These limitations warrant a cautious interpretation of our findings.
In conclusion, postoperative skeletal muscle loss following gastrectomy in stage II-III gastric cancer patients does not follow a uniform pattern of progression. Longitudinal data on muscle changes indicate that preserving or regaining muscle mass during the late postoperative stage may be associated with better disease-free and overall survival. This offers prognostic insights beyond static sarcopenia assessments. These findings highlight postoperative muscle resilience as a clinically meaningful and potentially modifiable prognostic factor, underscoring the importance of dynamic muscle monitoring and intervention in gastric cancer care.
Supplementary Material
Supplementary figures and tables.

Ethics Declarations
Ethical approval
This study was conducted in line with the principles of the Declaration of Helsinki. This study was approved by the Institutional Review Board of Chung-Ang University Hospital (IRB No. 2407-002-19530).
Consent to participate
The requirement for informed consent was waived due to the retrospective nature of the study.
Author contributions
All authors contributed to the study conception and design. Material preparation, data collection and/or analysis were performed by all authors. All authors reviewed the manuscript. Jeong Eun Kim and Song Ee Park have contributed equally to this work and wrote the main manuscript text. Jin Hwa Choi and In Gyu Hwang are Co-correspondences.
Competing Interests
The authors have declared that no competing interest exists.
References
1. Kim CH, Park SM, Kim JJ. The Impact of Preoperative Low Body Mass Index on Postoperative Complications and Long-term Survival Outcomes in Gastric Cancer Patients. J Gastric Cancer. 2018;18:274-86
2. Kim EY, Jun KH, Kim SY, Chin HM. Body mass index and skeletal muscle index are useful prognostic factors for overall survival after gastrectomy for gastric cancer: Retrospective cohort study. Medicine (Baltimore). 2020;99:e23363
3. Kuwada K, Kuroda S, Kikuchi S, Yoshida R, Nishizaki M, Kagawa S. et al. Sarcopenia and Comorbidity in Gastric Cancer Surgery as a Useful Combined Factor to Predict Eventual Death from Other Causes. Ann Surg Oncol. 2018;25:1160-6
4. Lee HH, Park JM, Song KY, Choi MG, Park CH. Survival impact of postoperative body mass index in gastric cancer patients undergoing gastrectomy. Eur J Cancer. 2016;52:129-37
5. Lee JH, Park B, Joo J, Kook MC, Kim YI, Lee JY. et al. Body mass index and mortality in patients with gastric cancer: a large cohort study. Gastric Cancer. 2018;21:913-24
6. Ma S, Liu H, Ma FH, Li Y, Jin P, Hu HT. et al. Low body mass index is an independent predictor of poor long-term prognosis among patients with resectable gastric cancer. World J Gastrointest Oncol. 2021;13:161-73
7. Moriwaki Y, Kunisaki C, Kobayashi S, Harada H, Imai S, Kasaoka C. Does body mass index (BMI) influence morbidity and long-term survival in gastric cancer patients after gastrectomy? Hepatogastroenterology. 2003;50:284-8
8. Zhuang CL, Huang DD, Pang WY, Zhou CJ, Wang SL, Lou N. et al. Sarcopenia is an Independent Predictor of Severe Postoperative Complications and Long-Term Survival After Radical Gastrectomy for Gastric Cancer: Analysis from a Large-Scale Cohort. Medicine (Baltimore). 2016;95:e3164
9. Sun X, Xu J, Chen X, Zhang W, Chen W, Zhu C. et al. Sarcopenia in Patients With Normal Body Mass Index Is an Independent Predictor for Postoperative Complication and Long-Term Survival in Gastric Cancer. Clin Transl Sci. 2021;14:837-46
10. Sahin MEH, Akbas F, Yardimci AH, Sahin E. The effect of sarcopenia and sarcopenic obesity on survival in gastric cancer. BMC Cancer. 2023;23:911
11. Salavatizadeh M, Soltanieh S, Radkhah N, Ataei Kachouei AH, Bahrami A, Khalesi S. et al. The association between skeletal muscle mass index (SMI) and survival after gastrectomy: A systematic review and meta-analysis of cohort studies. Eur J Surg Oncol. 2023;49:106980
12. Park SE, Choi JH, Park JY, Kim BJ, Kim JG, Kim JW. et al. Loss of skeletal muscle mass during palliative chemotherapy is a poor prognostic factor in patients with advanced gastric cancer. Sci Rep. 2020;10:17683
13. Amin MB, Greene FL, Edge SB, Compton CC, Gershenwald JE, Brookland RK. et al. The Eighth Edition AJCC Cancer Staging Manual: Continuing to build a bridge from a population-based to a more "personalized" approach to cancer staging. CA Cancer J Clin. 2017;67:93-9
14. Lee JS, Kim YS, Kim EY, Jin W. Prognostic significance of CT-determined sarcopenia in patients with advanced gastric cancer. PLoS One. 2018;13:e0202700
15. World Health Organization Regional Office for the Western Pacific. The Asia-Pacific perspective: redefining obesity and its treatment. Sydney: Health Communications. 2000
16. Lee JK, Park YS, Lee K, Youn SI, Won Y, Min SH. et al. Prognostic significance of surgery-induced sarcopenia in the survival of gastric cancer patients: a sex-specific analysis. J Cachexia Sarcopenia Muscle. 2021;12:1897-907
17. Chen F, Chi J, Liu Y, Fan L, Hu K. Impact of preoperative sarcopenia on postoperative complications and prognosis of gastric cancer resection: A meta-analysis of cohort studies. Arch Gerontol Geriatr. 2022;98:104534
18. Terayama M, Ohashi M, Ri M, Makuuchi R, Hayami M, Ida S. et al. Long-term impact of sarcopenia in older patients undergoing gastrectomy for gastric cancer: a systematic review and meta-analysis. Transl Gastroenterol Hepatol. 2023;8:35
19. Fearon K, Strasser F, Anker SD, Bosaeus I, Bruera E, Fainsinger RL. et al. Definition and classification of cancer cachexia: an international consensus. Lancet Oncol. 2011;12:489-95
Author contact
Corresponding authors: In Gyu Hwang, Division of Hemato-oncology, Department of Internal Medicine, Chung-Ang University College of Medicine, 84 Heukseok-ro, Dongjak-gu, Seoul 06973, Korea, Phone: +82-2-6299-1403, Fax:+82-2-6299-2114, E-mail: oncologyac.kr; Jin Hwa Choi, Department of Radiation Oncology, Chung-Ang University College of Medicine, 84 Heukseok-ro, Dongjak-gu, Seoul 06973, Republic of Korea. Tel: 82-2-6299-2676; E-mail: bonnybeeac.kr