Impact Factor ISSN: 1837-9664




J Cancer 2026; 17(12):1981-1995. doi:10.7150/jca.140797 This issue Cite
Research Paper
RFC1, RPA1, and POLE expression characterizes the clinical behavior and immune microenvironment of colorectal cancer
Michał Gola1,2  , Bartłomiej Emil Kraziński1, Jacek Kieżun1, Hanna Majewska3, Janusz Godlewski1,4
1. Department of Anatomy and Histology, School of Medicine, University of Warmia and Mazury, Olsztyn, Poland.
2. Department of Oncology and Immuno-Oncology, Clinical Hospital of the Ministry of Internal Affairs and Administration with the Warmia-Mazury Oncology Centre, Olsztyn, Poland.
3. Department of Pathomorphology and Forensic Medicine, School of Medicine, University of Warmia and Mazury, Olsztyn, Poland.
4. Department of Surgical Oncology, Clinical Hospital of the Ministry of Internal Affairs and Administration with the Warmia-Mazury Oncology Centre, Olsztyn, Poland.
Received 2026-7-13; Accepted 2026-9-23; Published 2026-10-31
Abstract
Background: Colorectal cancer remains a major cause of cancer-related mortality, and reliable biomarkers associated with prognosis and the tumor immune microenvironment are still needed. Replication-associated proteins, including RFC1, RPA1, and POLE, participate in DNA replication and repair processes and may contribute to colorectal cancer biology. However, their expression patterns and clinical significance remain insufficiently characterized. This study investigated the mRNA and protein expression of RFC1, RPA1, and POLE in colorectal cancer and their associations with clinicopathological features, survival outcomes, and the tumor immune microenvironment.
Methods: RNA sequencing clinical data for colorectal cancer were obtained from The Cancer Genome Atlas and analyzed for differential gene expression, clinicopathological associations, and survival outcomes. Immune infiltration and immune correlations were evaluated using transcriptomic deconvolution and public immune databases. Survival analyses were performed using Kaplan-Meier estimates and Cox proportional hazards regression. Findings were validated in an independent institutional colorectal cancer cohort using immunohistochemical analysis of RFC1 and RPA1 protein expression.
Results: At the mRNA level, RPA1 expression was downregulated in colorectal cancer, POLE was upregulated, and RFC1 showed no significant differential expression. High mRNA RFC1 expression was associated with improved overall survival in univariate analysis, but this association was not retained in multivariate analysis, while RPA1 and POLE were not prognostic. Transcriptomic analyses revealed gene-specific associations with the tumor immune microenvironment, with RPA1 showing the most consistent associations with immune checkpoint molecules and cytotoxic immune signatures, while RFC1 and POLE showed weaker immune associations. In the independent validation cohort, RFC1 protein expression was reduced in tumor tissues and showed an association with overall survival in univariate analysis, whereas RPA1 was overexpressed in tumors but was not associated with survival outcomes. No specific nuclear POLE immunoreactivity was detectable in colorectal cancer cells under the conditions used for immunohistochemical assessment. No significant associations between protein expression and clinicopathological features were observed in multivariate analysis.
Conclusions: RFC1, RPA1, and POLE demonstrate distinct, gene-specific roles in colorectal cancer. RFC1 is most consistently associated with patient outcomes, whereas RPA1 is linked to an immune-active tumor microenvironment. Discrepancies between transcriptomic and protein-level findings highlight the importance of multi-level biomarker validation. These findings suggest that replication-associated genes may represent potential prognostic and immunological biomarkers in colorectal canc
Keywords: colorectal cancer, DNA replication and repair, replication factor C subunit 1, replication protein A1, DNA polymerase epsilon catalytic subunit, tumor immune microenvironment
Introduction
Colorectal cancer (CRC) is the third most common malignancy worldwide, accounting for almost 10% of new cancer cases and the second leading cause of cancer-related deaths [1]. In recent years, molecularly targeted therapies and immune checkpoint inhibitors (ICIs) have improved outcomes for some patients; however, a substantial proportion still experience disease recurrence or progression, highlighting the need for reliable biomarkers that can inform prognosis and guide personalized therapy [2, 3].
Accurate DNA replication and effective repair of genomic damage are essential for maintaining genomic stability, and dysregulation of these pathways is a fundamental feature of cancer development and progression [4]. DNA polymerases, together with accessory proteins, coordinate the faithful duplication of the genome and support DNA repair processes [5].
POLE and POLD1, the catalytic subunits of polymerase ε and δ, drive leading- and lagging-strand synthesis, respectively, while RFC1, the largest subunit of replication factor C (RFC), and RPA1, the main subunit of replication protein A (RPA), coordinate polymerase activity and stabilize single-stranded DNA [5]. Functional alterations in these subunits can impair replication fidelity, induce replication stress, and promote genomic instability, contributing to tumorigenesis [4, 5]. Therefore, these features make them promising candidates for prognostic and predictive biomarkers across multiple cancer types [2, 6].
Mutations in POLE and POLD1 are increasingly recognized for their clinical significance in cancer. In endometrial cancer, POLE-mutated tumors define a distinct molecular subtype with favorable prognosis, while in CRC, POLE/POLD1 mutations are associated with high tumor mutational burden and may predict responsiveness to ICIs [7-9]. Moreover, POLE/POLD1 proofreading-deficient tumors frequently display an ultra-mutated phenotype with elevated neoantigen load, enhanced T-cell infiltration, and increased expression of immune checkpoints, features that can shape the tumor immune microenvironment and influence immunotherapy outcomes [9-13].
However, these mutation-driven effects represent a distinct biological dimension, and comparatively little is known about the role of expression of these polymerase subunits and their accessory proteins in cancer biology. Emerging evidence across multiple cancer types suggests that altered expression of POLE and related replication factors may be associated with tumor aggressiveness, immune contexture, and clinical outcomes, independent of mutational status [11, 14, 15]. Despite this, the expression of POLE, RFC1, and RPA1 remains poorly characterized in CRC.
In this study, we investigated the mRNA expression of RFC1, RPA1, and POLE in CRC using The Cancer Genome Atlas (TCGA) data and assessed their associations with clinicopathological characteristics, survival outcomes, and the tumor immune microenvironment. These findings were subsequently validated at the protein level in an independent cohort of CRC patients using immunohistochemistry (IHC).
2. Materials and Methods
2.1 Bioinformatics analysis
RNA sequencing (RNA-seq) gene expression data and corresponding clinicopathological information for CRC were obtained from TCGA database [16], cBioPortal for Cancer Genomics (https://www.cbioportal.org/; accessed on 18 November 2024 [17]), and UCSC Xena (https://xenabrowser.net/; accessed on 18 November 2024 [18]). The analysis included colon adenocarcinoma (COAD) and rectal adenocarcinoma (READ) cohorts.
Paired RNA-seq expression data from 32 matched CRC and normal colorectal tissue samples retrieved from UCSC Xena were used for comparative expression analyses.
Clinicopathological, molecular, and survival analyses were performed using TCGA/cBioPortal datasets. Patients with complete data regarding age, sex, TNM classification, overall survival (OS), and disease-free survival (DFS) were included in this part of the analysis, resulting in a final cohort of 494 primary tumor samples. DFS analyses were based on TCGA disease-free status data, where events included recurrence and/or progression.
mRNA expression levels of RFC1, RPA1, and POLE were analyzed in tumor tissues and compared with normal colorectal samples. RNA-seq data were normalized and log2-transformed prior to analysis. Patients were stratified into high- and low-expression groups based on median expression values for analyses of associations with clinicopathological variables.
Associations between RFC1, RPA1, and POLE expression and clinicopathological as well as molecular features, including age, sex, tumor localization, TNM stage, perineural and vascular invasion, microsatellite instability (MSI) status (classified as MSI-high versus MSI-low/stable based on previously published TCGA-derived supplementary data [19]), tumor mutational burden (TMB), and KRAS mutation status, were subsequently evaluated.
2.2 TIMER3 and TIMEDB analysis
To investigate the relationship between RFC1, RPA1, and POLE expression and the tumor immune microenvironment in CRC, transcriptomic analyses were performed using the Tumor Immune Estimation Resource, version 3 (TIMER3), platform [20]. Gene expression data from TCGA COAD and READ cohorts were analyzed separately. Correlation analyses were conducted to assess associations between RFC1, RPA1, and POLE expression and key immune checkpoint molecules, as well as selected functional immune markers.
In addition, immune infiltration data were obtained from the Tumor Immune Microenvironment Database (TIMEDB) (https://timedb.deepomics.org/; accessed on 18 January 2026 [21]), based on immune-cell abundance estimates derived using the CIBERSORTx deconvolution method in TCGA colorectal cancer samples. A total of 618 patients from the TCGA COAD and READ cohorts with complete data available for both immune infiltration and expression levels of the analyzed genes (RNA-seq) were included in the analysis. Estimated immune infiltration levels were subsequently compared between tumor groups stratified according to the expression levels of the analyzed genes.
2.3 Validation Cohort and collection of tissue samples
For protein-level validation of the transcriptomic analyses, a cohort of patients with CRC who underwent surgical treatment between 2010 and 2012 at our institution (Clinical Hospital of the Ministry of Internal Affairs and Administration with the Warmia-Mazury Oncology Centre, Olsztyn, Poland) was included. The study group comprised 78 patients, including 48 men and 30 women, with a median age of 67.5 years (range: 32-90 years). Detailed demographic and clinicopathological characteristics of the cohort are presented in Table 3.
None of the patients had received preoperative chemo- or radiotherapy. Patients with a history of other malignancies or inflammatory bowel disease were excluded from the study. All participants provided written informed consent prior to inclusion. Clinical, demographic, and preoperative blood parameter data were collected at the time of enrollment, and OS data were available for all patients. The median follow-up time was 69.7 months (range: 1.7-105.8 months).
Matched colorectal tissue samples were obtained intraoperatively from patients undergoing partial surgical resection of the large intestine at the Department of Surgical Oncology of our institution. For each case, two types of specimens were collected: (i) tumor tissue and (ii) macroscopically normal mucosa from a distant region of the resected colon. All samples were collected within 20 minutes of resection and immediately fixed in 10% neutral buffered formalin, followed by standard processing and embedding in paraffin blocks for histopathological and immunohistochemical analyses.
The study was conducted in accordance with the ethical standards and approved by the Bioethics Committee of the University of Warmia and Mazury in Olsztyn, Poland (approval no. 4/2010 and 21/2017). Written informed consent was obtained from all patients prior to inclusion in the study.
2.4 Immunohistochemistry, and evaluation of RPA1 and RFC1 immunoreactivity
RPA1 and RFC1 immunostaining was performed on formalin-fixed, paraffin embedded paired tumor and non-cancerous large intestine tissue sections of CRC patients following previously established protocols [15, 22].
Rabbit monoclonal anti-human antibodies directed against RPA1 and RFC1 [both diluted 1:800 in phosphate-buffered saline, #ab79398 and #ab180613, respectively, Abcam, Cambridge, UK] were applied. The specificity of immunohistochemical staining was checked by omitting the primary antibody and by replacing it with the rabbit serum.
All immunostained sections of CRC and corresponding non-cancerous large intestine were evaluated by a pathologist (H.M.), blinded to clinical data. Representative images were captured using an Olympus BX41 light microscope for documentation.
The immunoreactivity levels of RPA1 and RFC1 were evaluated in tumor and non-cancerous large intestine tissue of CRC patients according to the 12-point immunoreactive score system (IRS) of Remmele and Stegner [23].
2.5 Statistical analysis
Statistical analyses were performed using Statistica 13.1 (Statsoft, Tulsa, OK, USA) and R 4.3.2 (R Foundation for Statistical Computing, Vienna, Austria) software with the stats package.
Associations between gene or protein expression and categorical clinicopathological variables (for instance, sex, age, TNM stage) were assessed using Fisher's exact test. Correlations between RFC1 and RPA1 protein immunoexpression and preoperative blood parameters were evaluated using Spearman's rank correlation coefficient (Spearman's rho).
Comparisons of mRNA expression levels of RFC1, RPA1, and POLE in the TCGA cohort, as well as IRS for RFC1 and RPA1 proteins in our patient cohort, were performed using the Mann-Whitney U test implemented in Python (SciPy). The expression and immunoexpression plots were generated using the Matplotlib library.
For survival analyses, optimal cut-off points for RFC1, RPA1, and POLE expression were determined using receiver operating characteristic (ROC) curve analysis with Youden's J statistic. OS and DFS were estimated using Kaplan-Meier method and compared with the log-rank test in univariate analyses (GraphPad Prism version 8.4.3 for Windows; GraphPad Software, San Diego, CA, USA). Variables with p<0.1 in univariate analysis were included in multivariate Cox proportional hazards regression models (Statistica version 13; TIBCO Software Inc., Palo Alto, CA, USA) to identify independent predictors of patients' survival. Hazard ratios (HRs) with 95% confidence intervals (95% CIs) were calculated.
For immune infiltration analyses derived from the TIMEDB database, estimated immune cell fractions were compared between high- and low-expression groups using an unpaired Student's t-test. Correlations between gene expression and immune checkpoint molecules or functional immune markers within the TIMER3 platform were assessed using Spearman's rank correlation analysis.
A p-value <0.05 was considered statistically significant for all analyses.
3. Results
3.1 Differential and correlative mRNA expression of RFC1, RPA1, and POLE in colorectal cancer (TCGA)
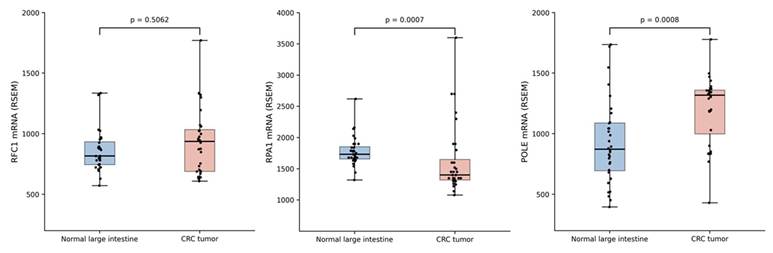
Analysis of the TCGA cohort demonstrated differential mRNA expression patterns of RFC1, RPA1, and POLE in CRC tissues compared with normal samples (Figure 1). RPA1 expression was reduced in tumor tissues, whereas POLE expression was upregulated. In contrast, RFC1 expression did not show a significant difference between cancer and normal samples.
Comparative mRNA expression of RFC1, RPA1, and POLE in colorectal cancer and normal tissues (TCGA). Boxplots of normalized mRNA expression quantified using RNA-Seq by expectation maximization (RSEM) in CRC tissues and matched normal samples (n=32) from the TCGA cohort. Tumor tissues show decreased RPA1 and increased POLE expression, while RFC1 levels remain largely unchanged. Boxes represent the interquartile range, horizontal lines indicate the median, and whiskers depict the full range of values.
3.2 Clinicopathological and prognostic associations of RFC1, RPA1, and POLE expression (TCGA)
To further evaluate the clinical and molecular context of RFC1, RPA1, and POLE expression, TCGA data comprising 494 cases of CRC (COAD and READ combined) were analyzed with respect to selected clinicopathological and molecular features. Patients were stratified into high and low expression groups based on median cut-offs, and associations with demographic variables, tumor characteristics, MSI status, TMB, and KRAS mutation status were evaluated (Table 1).
Associations of RFC1, RPA1, and POLE expression in TCGA colorectal cancer
| Parameter | Number of cases | RFC1 low | RFC1 high | p-value | RPA1 low | RPA1 high | p-value | POLE low | POLE high | p-value |
|---|---|---|---|---|---|---|---|---|---|---|
| Sex | ||||||||||
| Men | 256 | 122 (47.7%) | 134 (52.3%) | 0.3219 | 124 (48.4%) | 132 (51.6%) | 0.5285 | 123 (48.0%) | 133 (52.0%) | 0.4177 |
| Women | 238 | 125 (52.5%) | 113 (47.5%) | 123 (51.7%) | 115 (48.3%) | 124 (52.1%) | 114 (47.9%) | |||
| Age | ||||||||||
| <67 | 261 | 125 (47.9%) | 136 (52.1%) | 0.3675 | 124 (47.5%) | 137 (52.5%) | 0.2794 | 123 (47.1%) | 138 (52.9%) | 0.2070 |
| >67 | 233 | 122 (52.4%) | 111 (47.6%) | 123 (52.8%) | 110 (47.2%) | 124 (53.2%) | 109 (46.8%) | |||
| Localization | ||||||||||
| Cecum+Right | 283 | 143 (50.5%) | 140 (49.5%) | 0.8557 | 153 (54.1%) | 130 (45.9%) | 0.0453 | 147 (51.9%) | 136 (48.1%) | 0.3631 |
| Left+Rectum | 211 | 104 (49.3%) | 107 (50.7%) | 94 (44.5%) | 117 (55.5%) | 100 (47.4%) | 111 (52.6%) | |||
| T status: T1-3 | 437 | 220 (50.3%) | 217 (49.7%) | 0.7784 | 219 (50.1%) | 218 (49.9%) | 1.0000 | 220 (50.3%) | 217 (49.7%) | 0.7784 |
| T status: T4 | 57 | 27 (47.4%) | 30 (52.6%) | 28 (49.1%) | 29 (50.9%) | 27 (47.4%) | 30(52.6%) | |||
| N status: N0 | 283 | 143 (50.5%) | 140 (49.5%) | 0.8557 | 142 (50.2%) | 141 (49.8%) | 1.0000 | 146 (51.6%) | 137 (48.4%) | 0.4669 |
| N status: N1+N2 | 211 | 104 (49.3%) | 107 (50.7%) | 105 (49.8%) | 106 (50.2%) | 101 (47.9%) | 110 (52.1%) | |||
| M status: negative | 426 | 210 (49.3%) | 216 (50.7%) | 0.5140 | 212 (49.8%) | 214 (50.2%) | 0.8962 | 209 (49.1%) | 217 (50.9%) | 0.3607 |
| M status: positive | 68 | 37 (54.4%) | 31 (45.6%) | 35 (51.5%) | 33 (48.5%) | 38 (55.9%) | 30 (44.1%) | |||
| TNM stage: I+II | 276 | 140 (50.7%) | 136 (49.3%) | 0.7858 | 139 (50.4%) | 137 (49.6%) | 0.9278 | 143 (51.8%) | 133 (48.2%) | 0.4148 |
| TNM stage: III+IV | 218 | 107 (49.1%) | 111 (50.9%) | 108 (49.5%) | 110 (50.5%) | 104 (47.7%) | 114 (52.3%) | |||
| Perineural invasion: negative | 148 | 34 (23.0%) | 114 (77.0%) | 0.3533 | 38 (25.7%) | 110 (74.3%) | 0.8540 | 39 (26.4%) | 109 (73.6%) | 0.7162 |
| Perineural invasion: positive | 51 | 15 (29.4%) | 36 (70.6%) | 14 (27.5%) | 37 (72.5%) | 15 (29.4%) | 36 (70.6%) | |||
| Vascular invasion: negative | 321 | 153 (47.7%) | 168 (52.3%) | 0.3718 | 149 (46.4%) | 172 (53.6%) | 0.3700 | 155 (48.3%) | 166 (51.7%) | 0.2643 |
| Vascular invasion: positive | 106 | 56 (52.8%) | 50 (47.2%) | 55 (51.9%) | 51 (48.1%) | 58 (54.7%) | 48 (45.3%) | |||
| MSI status: low/stable | 191 | 77 (40.3%) | 114 (59.7%) | 0.5872 | 80 (41.9%) | 111 (58.1%) | 0.0261 | 77 (40.3%) | 114 (59.7%) | 1.0000 |
| MSI status: high | 37 | 13 (35.1%) | 24 (64.9%) | 8 (21.6%) | 29 (78.4%) | 15 (40.5%) | 22 (59.5%) | |||
| TMB: <10 | 135 | 126 (93.3%) | 9 (6.7%) | 0.6825 | 126 (93.3%) | 9 (6.7%) | 0.1236 | 120 (88.9%) | 15 (11.1%) | 0.1035 |
| TMB: >10 | 25 | 23 (92.0%) | 2 (8.0%) | 21 (84.0%) | 4 (16.0%) | 19 (76.0%) | 6 (24.0%) | |||
| KRAS mutation: wild-type | 24 | 2 (8.3%) | 22 (91.7%) | 0.0047 | 11 (45.8%) | 13 (54.2%) | 0.5735 | 5 (20.8%) | 19 (79.2%) | 0.5319 |
| KRAS mutation: positive | 28 | 13 (46.4%) | 15 (53.6%) | 10 (35.7%) | 18 (64.3%) | 9 (32.1%) | 19 (67.9%) |
Patients were stratified into high and low expression groups based on median mRNA levels. The table summarizes the distribution of expression across sex, age, tumor localization, TNM stage, perineural and vascular invasion, microsatellite instability (MSI) status, tumor mutational burden (TMB), and KRAS mutation status in the TCGA colorectal cancer cohort (COAD + READ, n=494), with corresponding p-values for statistical comparisons. For variables with fewer available cases, analyses were restricted to patients with available corresponding clinical or molecular annotations in the TCGA database. Statistically significant associations (p<0.05) are shown in bold.
No significant differences in RFC1, RPA1, or POLE expression were observed with respect to patients' sex or age.
RFC1 expression was significantly associated with KRAS mutation status (p=0.0047), with a higher proportion of RFC1-high cases in KRAS wild-type tumors.
RPA1 expression was significantly associated with tumor localization (p=0.0453), with higher expression observed in left-sided and rectal tumors, and with MSI status (p=0.0261), with a greater proportion of RPA1-high cases in MSI-high tumors.
POLE expression was not significantly associated with the analyzed clinicopathological or molecular features, although a tendency toward higher expression in tumors with elevated TMB was observed (p=0.1035).
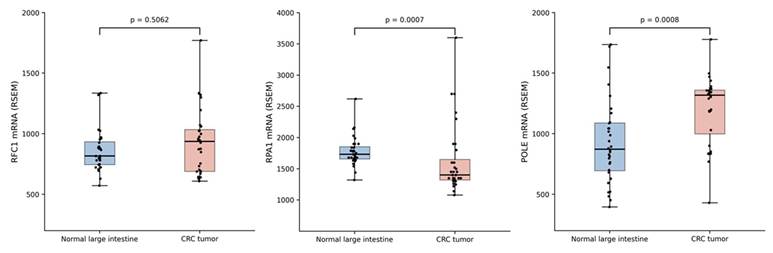
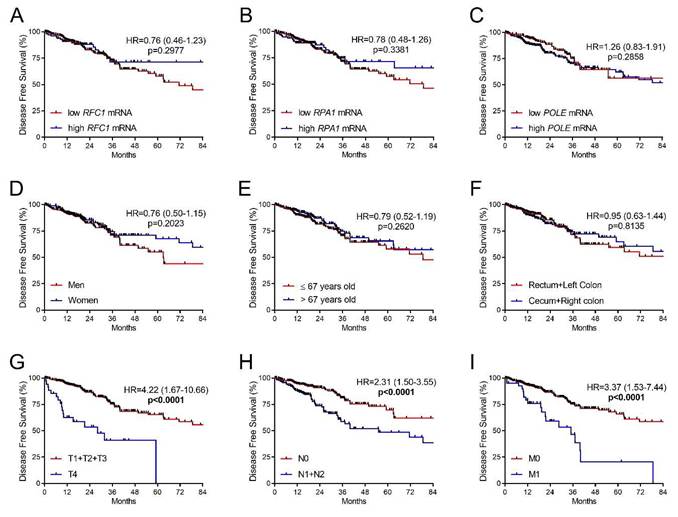
Next, survival analyses were performed to evaluate the prognostic significance of RFC1, RPA1, and POLE expression. Kaplan-Meier analysis followed by log-rank test demonstrated that high RFC1 expression was associated with improved OS (HR=0.53, 95% CI: 0.33-0.85, p=0.0266), whereas POLE and RPA1 expression showed no significant association with OS (Figure 2A-C). Among clinicopathological variables, older age (>67 years; HR=2.08, 95% CI: 1.37-3.04, p<0.0004), advanced T stage (HR=3.70, 95% CI: 1.76-7.80, p<0.0001), positive nodal status (HR=2.56, 95% CI: 1.71-3.84, p<0.0001), and the presence of distant metastases (HR=5.12, 95% CI: 2.63-9.96, p<0.0001) were associated with significantly worse OS (Figure 2D-I). In contrast, the expression levels of RFC1, POLE, and RPA1 were not significantly associated with DFS (Figure 3A-C), whereas advanced T stage (HR=4.22, 95% CI: 1.67-10.66, p<0.0001), positive nodal status (HR=2.31, 95% CI: 1.50-3.55, p<0.0001), and distant metastases (HR=3.37, 95% CI: 1.53-7.44, p<0.0001) were associated with significantly worse DFS (Figure 3D-I).
Overall survival in the TCGA colorectal cancer cohort according to molecular and clinicopathological variables. Kaplan-Meier curves for overall survival in the TCGA colorectal cancer cohort stratified according to RFC1, RPA1, and POLE expression levels and clinicopathological characteristics. (A) RFC1 expression; (B) RPA1 expression; (C) POLE expression; (D) sex; (E) age; (F) tumor location; (G) T stage; (H) N stage; and (I) metastatic status. Statistically significant associations (p<0.05) are shown in bold.
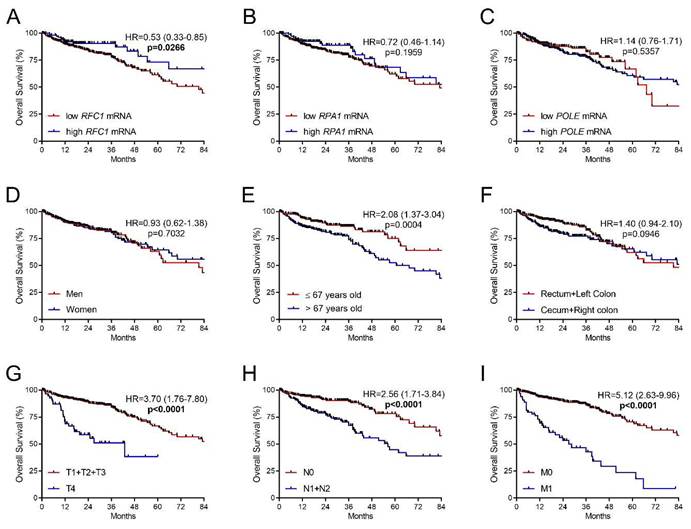
Disease-free survival in the TCGA colorectal cancer cohort according to molecular and clinicopathological variables. Kaplan-Meier curves for disease-free survival in the TCGA colorectal cancer cohort stratified according to RFC1, RPA1, and POLE expression levels and clinicopathological characteristics. (A) RFC1 expression; (B) RPA1 expression; (C) POLE expression; (D) sex; (E) age; (F) tumor location; (G) T stage; (H) N stage; and (I) metastatic status. Statistically significant associations (p<0.05) are shown in bold.
In multivariate analysis, RFC1 expression did not retain independent prognostic significance for OS, whereas older age (>67 years; HR=2.51, 95% CI: 1.63-3.85, p<0.0001), advanced T stage (HR=2.25, 95% CI: 1.30-3.88, p=0.0038), positive nodal status (HR=1.68, 95% CI: 1.03-2.74, p=0.0385), and the presence of distant metastases (HR=4.05, 95% CI: 2.40-6.84, p<0.0001) remained independently associated with worse OS (Table 2). Similarly, in multivariate analysis for DFS, advanced T stage (HR=3.07, 95% CI: 1.79-5.25, p<0.0001), positive nodal status (HR=1.72, 95% CI: 1.08-2.74, p=0.0217), and distant metastases (HR=2.14, 95% CI: 1.22-3.78, p=0.0084) remained independently associated with worse DFS, whereas age was not a significant predictor (Table 2).
Multivariate Cox analysis of survival in the TCGA colorectal cancer cohort.
| Parameter Overall survival | Multivariate Cox regression | |
|---|---|---|
| HR (95% CI) | p-value | |
| RFC1 mRNA (high vs low) | 0.75 (0.42-1.34) | 0.3251 |
| Age (>67 years vs ≤67 years) | 2.51 (1.63-3.85) | <0.0001 |
| Tumor location (Rectum + left colon vs right colon + cecum) | 1.39 (0.91-2.12) | 0.1327 |
| T status (T4 vs T1-3) | 2.25 (1.30-3.88) | 0.0038 |
| N status (N1-2 vs N0) | 1.68 (1.03-2.74) | 0.0385 |
| M status (M1 vs M0) | 4.05 (2.40-6.84) | <0.0001 |
| Disease-free survival | ||
| Age (>67 years vs ≤67 years) | 0.92 (0.60-1.41) | 0.7034 |
| T status (T4 vs T1-3) | 3.07 (1.79-5.25) | <0.0001 |
| N status (N1-2 vs N0) | 1.72 (1.08-2.74) | 0.0217 |
| M status (M1 vs M0) | 2.14 (1.22-3.78) | 0.0084 |
Variables with p<0.1 in univariate analysis were included in the multivariate model. The table summarizes the impact of clinicopathological factors and RFC1 mRNA expression on overall survival (OS; n=494) and clinicopathological factors on disease-free survival (DFS; n=432). In the OS model, older age (>67 years), advanced T stage, positive nodal status, and distant metastases remained independent predictors of worse survival, whereas RFC1 mRNA expression was not independently associated with OS after adjustment. In the DFS model, advanced T stage, positive nodal status, and distant metastases remained independently associated with poorer DFS, while age did not reach statistical significance. Hazard ratios (HR), 95% confidence intervals (95% CI), and corresponding p-values are presented. Statistically significant associations (p<0.05) are shown in bold.
3.3 Tumor immune microenvironment analysis in relation to RPA1, RFC1, and POLE expression
To characterize the tumor immune microenvironment associated with RPA1, RFC1, and POLE expression in CRC, we performed complementary analyses based on TCGA-derived immune deconvolution approaches. Immune cell composition differences were assessed in the combined TCGA COAD/READ cohort by stratifying tumors according to gene expression levels. In parallel, the TIMER3 platform (CIBERSORT-ABS-based immune deconvolution framework) was used to evaluate correlations between gene expression and immune checkpoint molecules as well as functional immune signatures, analyzed separately in TCGA-COAD and TCGA-READ cohorts.
3.3.1 Immune cell composition according to gene expression levels
To characterize whether variation in gene expression was associated with changes in the tumor immune microenvironment, we compared immune cell fractions between high and low expression groups of RPA1, RFC1, and POLE in the TCGA cohort (combined COAD and READ).
Tumors with high RPA1 expression were characterized by higher proportions of naïve B cells, CD8+ T cells, and resting memory CD4+ T cells, as well as macrophage subsets (M0, M1, and M2), whereas the fraction of eosinophils was lower in the RPA1-high subgroup (Supplementary Figure 1).
A similar but less pronounced pattern was observed for RFC1, where high expression was associated with increased proportions of naïve B cells, CD8+ T cells, resting memory CD4+ T cells, and macrophages (M0 and M1), along with reduced fractions of plasma cells and eosinophils (Supplementary Figure 2).
In contrast, POLE expression demonstrated a distinct profile, with no enrichment of major immune cell populations and instead showing reduced proportions of plasma cells, resting dendritic cells, eosinophils, and neutrophils in the POLE-high subgroup (Supplementary Figure 3).
Notably, the magnitude of these differences was consistently small across all genes, indicating subtle but reproducible shifts in immune cell composition rather than pronounced alterations of the tumor immune microenvironment.
3.3.2 Immune checkpoint gene associations
To further explore the immunological context, correlation analysis between RFC1, RPA1, and POLE expression and key immune checkpoint molecules revealed distinct patterns within CRC.
RPA1 expression demonstrated the strongest and most consistent positive correlations with multiple immune checkpoints, including PDCD1 (encoding PD-1), CD274 (encoding PD-L1), CTLA4, LAG3, TIGIT, HAVCR2 (encoding TIM-3), and VSIR (encoding VISTA), particularly in COAD (all ρ>0.250, p<0.05). RFC1 expression showed more selective positive associations, including CD274, CTLA4, and TIGIT (all ρ>0.200, p<0.05), while a negative correlation was observed with VSIR in READ (ρ=-0.213, p<0.05). In contrast, POLE expression exhibited weaker and less consistent correlations with immune checkpoint genes, with modest positive associations observed in READ for CD274, CTLA4, and LAG3 (all ρ>0.200, p<0.05) (Supplementary Table 1). These findings indicate that RPA1 expression is more consistently associated with immune-related features than RFC1 or POLE, although the magnitude of these correlations was modest.
3.3.3 Functional immune signature analysis
Correlation analysis between RPA1, RFC1, and POLE expression and functional immune markers revealed gene-specific patterns.
In COAD, RPA1 expression showed modest positive correlations with cytotoxic and interferon-related markers, including PRF1 and CXCL9 (encoding perforin and C-X-C motif chemokine ligand 9, respectively; both ρ>0.300, p<0.05), with an additional moderate association with IFNG (encoding interferon gamma; ρ=0.229, p<0.05). RFC1 also demonstrated positive correlations with functional markers, particularly CXCL9 (ρ=0.233, p<0.05), although these associations were generally weaker than those observed for RPA1. In contrast, POLE exhibited weaker and less consistent correlations, with rho values below 0.150 for all functional markers analyzed.
In READ, none of the analyzed genes showed statistically significant correlations with functional immune markers, suggesting that these associations are less pronounced in distal colorectal tumors (Supplementary Table 2).
3.4 Clinicopathological and Prognostic Associations of RFC1 and RPA1 protein expression in colorectal cancer
3.4.1 Differential protein immunoreactivity of RFC1 and RPA1 in colorectal cancer
To provide independent protein-level validation of the transcriptomic findings from the TCGA cohort, IHC analysis was performed to evaluate protein immunoexpression of RFC1 and RPA1 in matched CRC tissues and non-cancerous mucosa from our patient cohort (n = 78) (Figure 4A). Notably, the direction of protein-level expression changes observed for RFC1 and RPA1 did not fully mirror the transcriptomic patterns identified in the TCGA cohort.
Differential immunoreactivity of RFC1 and RPA1 in colorectal cancer versus non-cancerous mucosa. (A) Representative immunohistochemical images of RFC1 and RPA1 protein immunoexpression in matched tumor and non-cancerous colon tissues (n=78). RFC1 showed predominantly cytoplasmic staining and decreased immunoreactivity in tumor samples, whereas RPA1 exhibited nuclear localization with increased immunoexpression in colorectal cancer samples. Main images were acquired at 200× magnification, with corresponding insets shown at 50× magnification. Scale bars represent 20 μm in the main images and 100 μm in the corresponding insets. (B) Comparison of immunoreactive score (IRS) for RFC1 and RPA1 in colorectal cancer cells and matched non-cancerous tissues. Boxplots show median IRS values with interquartile ranges (IQR); whiskers indicate ±1.5× IQR. Each dot represents a single observation.
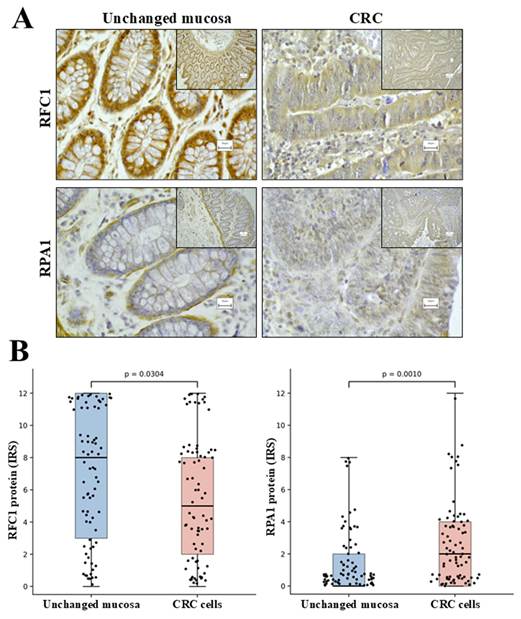
RFC1 exhibited cytoplasmic localization and decreased immunoreactivity in tumor tissues relative to matched non-cancerous colon, with a median IRS of 5 (Q1-Q3: 2-8) in cancer versus 8 (Q1-Q3: 3-12) in morphologically non-cancerous tissue (p=0.0304) (Figure 4B). Descriptive comparison of matched tumor-normal pairs showed decreased RFC1 immunoreactivity in half of cases (50.0%), while increased and stable immunoexpression was observed in 23.7% and 26.3% of cases, respectively.
In contrast, RPA1 demonstrated predominantly nuclear staining and showed increased immunoreactivity in tumor samples compared with corresponding non-cancerous tissue, with a median IRS of 2 (Q1-Q3: 0-4) in cancer versus 0 (Q1-Q3: 0-2) in epithelium of non-cancerous mucosa (p=0.0010) (Figure 4B). Descriptive comparison of matched tumor-normal pairs showed increased RPA1 immunoreactivity in 55.3% of cases, decreased immunoreactivity in 18.4%, and unchanged immunoreactivity in 26.3%. Notably, absent RPA1 immunoexpression (IRS=0) was observed in nearly one-third of tumor samples (30.3%).
IHC revealed POLE nuclear immunoreactivity in non-cancerous cellular compartments, including intratumoral and peritumoral stromal cells, cells of the lamina propria and muscularis mucosa, as well as endothelial cells.
In contrast, no specific nuclear POLE immunoreactivity was detectable in CRC cells or in the epithelial compartment of non-cancerous mucosa of large intestine under the conditions used for IHC assessment. Given the lack of detectable tumor-cell immunoreactivity, POLE was not included in further protein-level analyses.
3.4.2 Associations with clinicopathological features and preoperative blood parameters
No significant associations were observed between RFC1 or RPA1 immunoexpression and clinicopathological characteristics in the analyzed cohort (Table 3).
Clinicopathological features by RFC1 and RPA1 immunoreactivity in institutional colorectal cancer cohort
| Parameter | Number of cases | RFC1 low | RFC1 high | p-value | RPA1 low | RPA1 high | p-value |
|---|---|---|---|---|---|---|---|
| Sex | |||||||
| Men | 48 | 42 (87.5%) | 6 (12.5%) | 0.5203 | 33 (68.8%) | 15 (31.3%) | 0.7980 |
| Women | 30 | 24 (80.0%) | 6 (20.0%) | 22 (73.3%) | 8 (26.7%) | ||
| Age | |||||||
| ≤ 67 years old | 39 | 31 (79.5%) | 8 (20.5%) | 0.5203 | 28 (71.8%) | 11 (28.2%) | 1.0000 |
| > 67 years old | 39 | 35 (89.7%) | 4 (10.3%) | 27 (69.2%) | 12 (30.8%) | ||
| Localization | |||||||
| Left+Rectum | 49 | 40 (81.6%) | 9 (18.4%) | 0.5185 | 37 (75.5%) | 12 (24.5%) | 0.3041 |
| Right | 29 | 26 (89.7%) | 3 (10.3%) | 18 (62.1%) | 11 (37.9%) | ||
| Grade | |||||||
| G2 | 71 | 60 (84.5%) | 11 (15.5%) | 1.0000 | 53 (74.6%) | 18 (25.4%) | 0.2111 |
| G3 | 7 | 6 (85.7%) | 1 (14.3%) | 2 (28.6%) | 5 (71.4%) | ||
| T status | |||||||
| T1+T2+T3 | 63 | 53 (84.1%) | 10 (15.9%) | 1.0000 | 48 (76.2%) | 15 (23.8%) | 0.3195 |
| T4 | 15 | 13 (86.7%) | 2 (13.3%) | 7 (46.7%) | 8 (53.3%) | ||
| N status | |||||||
| N0 | 43 | 37 (86.0%) | 6 (14.0%) | 0.7591 | 31 (72.1%) | 12 (27.9%) | 0.8054 |
| N1+N2 | 35 | 29 (82.9%) | 6 (17.1%) | 24 (68.6%) | 11 (31.4%) | ||
| M status at diagnosis | |||||||
| Negative | 68 | 56 (82.4%) | 12 (17.6%) | 0.3458 | 49 (72.1%) | 19 (27.9%) | 0.4696 |
| Positive | 10 | 10 (100.0%) | 0 (0.0%) | 6 (60.0%) | 4 (40.0%) |
Baseline demographic and clinicopathological characteristics of colorectal cancer patients treated at our institution (n=78) stratified by RFC1 and RPA1 immunoreactivity status. Variables included sex, age, tumor localization, histological grade, and TNM stage. No statistically significant associations were observed between RFC1 or RPA1 expression and clinicopathological variables in this cohort.
However, analysis of preoperative blood-derived parameters revealed limited but significant associations (Supplementary Table 3). Higher RPA1 immunoexpression was correlated with increased platelet count (ρ=0.253, p=0.0373) and systemic immune-inflammation index (SII; ρ=0.262, p=0.0322).
3.4.3 Survival Analysis According to RFC1 and RPA1 Expression
In univariate analysis, clinicopathological variables such as tumor stage, T stage, N status, and the presence of metastases at diagnosis were significantly associated with OS. Higher T stage (T4; HR=2.43, 95% CI: 1.28-8.61, p=0.0137), lymph node involvement (HR=2.60, 95% CI: 1.32-5.12, p=0.0044), and metastatic disease (HR=5.72, 95% CI: 1.50-21.86, p<0.0001) were all associated with worse prognosis (Figure 5F-H). Among the analyzed biomarkers, RFC1 immunoexpression was significantly associated with OS (HR=0.26, 95% CI: 0.11-0.60, p=0.0452), with higher RFC1 expression indicating better survival, whereas RPA1 immunoexpression showed no significant association (Figure 5A-B).
Overall survival in the study colorectal cancer cohort according to molecular and clinicopathological variables. Kaplan-Meier curves for overall survival in the institutional colorectal cancer cohort stratified according to RFC1 and RPA1 immunoexpression levels and clinicopathological characteristics. (A) RFC1 immunoexpression; (B) RPA1 immunoexpression; (C) sex; (D) age; (E) tumor location; (F) T stage; (G) N stage; and (H) metastatic status. Statistically significant associations (p<0.05) are shown in bold.
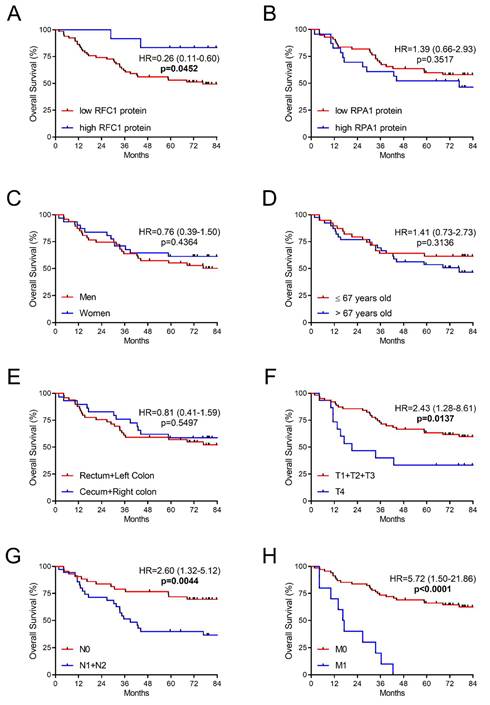
In multivariate analysis, the presence of distant metastases (HR=3.97, 95% CI: 1.72-9.14, p=0.0012) and lymph node involvement (HR=2.13, 95% CI: 1.02-4.44, p=0.0443) were independent predictors of overall survival. Although RFC1 immunoexpression was associated with OS in univariate analysis, it did not retain independent prognostic significance in the multivariate model (HR=0.28, 95% CI: 0.07-1.21, p=0.0879) (Table 4).
Multivariate Cox analysis of overall survival in the validation colorectal cancer cohort.
| Parameter | Multivariate Cox regression | |
|---|---|---|
| HR (95% CI) | p-value | |
| RFC1 protein immunoexpression in CRC cells (high vs low) | 0.28 (0.07-1.21) | 0.0879 |
| T status (T4 vs T1-3) | 1.85 (0.86-4.00) | 0.1159 |
| N status (N1-2 vs N0) | 2.13 (1.02-4.44) | 0.0443 |
| M status (M1 vs M0) | 3.97 (1.72-9.14) | 0.0012 |
Variables with p<0.1 in univariate analysis were included in the multivariate Cox regression model. The table summarizes the impact of clinicopathological variables and RFC1 immunoexpression on overall survival in the institutional colorectal cancer cohort (n=78), including 35 deaths during follow-up. Distant metastases and lymph node involvement remained independent predictors of worse overall survival, whereas RFC1 immunoexpression did not retain independent prognostic significance after adjustment for clinicopathological factors. Hazard ratios (HR), 95% confidence intervals (95% CI), and corresponding p-values are presented. Statistically significant associations (p<0.05) are shown in bold.
Discussion
We performed a multi-level analysis integrating transcriptomic, protein-level, and immune microenvironment data, revealing distinct, gene-specific roles of RFC1, RPA1, and POLE in CRC. RFC1 expression showed the most consistent links to clinical outcome, whereas RPA1 was primarily associated with immune-related features, suggesting distinct roles of these replication-associated proteins in CRC biology.
Expression patterns differed between transcriptomic and protein levels. While RFC1 showed no significant differences at the mRNA level, its decreased protein expression in tumor tissues and association with OS suggest a role in tumor progression. In contrast, RPA1 displayed discordant patterns, with reduced mRNA levels in the TCGA dataset but increased protein immunoreactivity in tumor cells in our cohort.
RFC1 emerged as the most clinically relevant of the three genes, showing associations with OS at both transcriptomic and protein levels. However, these associations were not retained in multivariate analysis, suggesting that RFC1 expression is not an independent prognostic factor after adjustment for established clinicopathological factors. Nevertheless, the consistent trend toward poorer outcomes in patients with lower RFC1 expression suggests a potential role in disease progression, although its prognostic value may be influenced by other clinical and pathological factors. Higher RFC1 mRNA expression was observed in KRAS wild-type tumors, which may indicate an association with less aggressive molecular subtypes, providing additional context for its link with improved survival. Reduced RFC1 protein immunoreactivity in tumor tissues further supports its involvement in CRC biology, potentially reflecting alterations in DNA replication or repair processes. This observation is consistent with previous evidence suggesting that dysregulation of RFC family members may contribute to CRC progression through disruption of DNA replication fidelity and DNA repair pathways, supporting a potential tumor-suppressive role of RFC1 in colorectal carcinogenesis [24]. Notably, miR-26a-5p and miR-636 have recently been proposed as upstream regulators of RFC1, with their increased expression linked to RFC1 downregulation and unfavorable prognosis in CRC [25]. Beyond clinical associations, RFC1 expression showed limited but detectable links to the tumor immune microenvironment. In the combined COAD/READ TCGA cohort, RFC1 expression was associated with modest differences in immune cell composition, particularly involving macrophages M0, naïve B cells, and resting memory CD4+ T cells. RFC1 also demonstrated selective correlations with immune checkpoint molecules, including CD274, CTLA4, and TIGIT, and an inverse association with VSIR in rectal tumors. Additionally, a modest correlation with CXCL9 suggests a potential link to T-cell recruitment [26], although overall these immune associations were less pronounced than those observed for RPA1.
In contrast, RPA1 was not associated with patient survival, suggesting a less direct link to clinical outcome in CRC. Instead, RPA1 expression demonstrated consistent associations with features of the tumor immune microenvironment. Higher RPA1 expression was observed in MSI-high tumors, as well as in left-sided and rectal cancers. Notably, the association with MSI-high status aligns with the increased mutational burden and enhanced immunogenicity characteristic of this subgroup [27]. Given the central role of RPA1 in DNA replication and repair [28], its enrichment in MSI-high tumors may be related to the increased DNA damage burden and genomic instability associated with mismatch repair deficiency [27]. Experimental studies have further demonstrated a role for RPA1 in replication fork protection and genome stability maintenance, supporting its potential importance in CRC biology beyond conventional DNA repair processes [29]. In the combined TCGA cohort, RPA1 expression was associated with increased infiltration of selected immune cell populations, particularly adaptive immune cells (naïve B cells, resting memory CD4+ T cells, and CD8+ T cells) and macrophage subsets (M1 and M2). However, these associations were modest but consistent, indicating a subtle but coordinated immune-enriched phenotype. In contrast, eosinophil infiltration was reduced in RPA1-high tumors. RPA1 expression was also associated with elevated expression of key immune checkpoint molecules, particularly LAG3 and HAVCR2 (encoding TIM-3). Interestingly, a recent bioinformatic study in hepatocellular carcinoma linked the RPA1-ETAA1 axis to immune checkpoint regulation and remodeling of the tumor immune microenvironment [30]. Given the emerging clinical relevance of these pathways, including the recent introduction of anti-LAG3 therapies and ongoing clinical development of TIM-3-targeting agents, these findings may have potential implications for immunotherapeutic strategies [31, 32]. Associations of RPA1 expression with cytotoxic and interferon-related markers were modest but may reflect its association with an immune-enriched tumor microenvironment. Consistently, higher RPA1 immunoexpression in our cohort was accompanied by modest increases in systemic inflammatory markers, including platelet count and SII.
Integrating these findings, RPA1—and to a lesser extent RFC1—was associated with an immune-infiltrated tumor microenvironment, although with distinct patterns. RPA1 was linked to adaptive immune infiltration, macrophage presence, immune checkpoint expression, and cytotoxic signaling, consistent with a subtly immune-enriched phenotype. In contrast, RFC1 showed more selective associations involving a limited set of immune cell populations and a narrower range of immune checkpoint interactions, suggesting a more restricted role in tumor-immune dynamics. These differences highlight functional divergence despite shared roles in DNA replication and repair.
POLE demonstrated a distinct profile compared to RFC1 and RPA1. Although transcriptomic analyses indicated increased POLE expression in CRC and modest associations with selected features, no specific nuclear POLE immunoreactivity was detectable in CRC cells in our cohort under the conditions used for IHC assessment, precluding further protein-level analyses. The absence of detectable tumor-cell staining should therefore not be interpreted as evidence of a biological absence of POLE protein, as technical factors such as assay sensitivity or epitope accessibility cannot be completely excluded. Consistent with prior findings by Siraj et al., who observed positive POLE IHC staining in a proportion of Middle Eastern CRC cases and reported that low POLE protein expression was associated with adverse clinicopathological features but not with exonuclease domain mutations [33], our results suggest that expression-based assessment may not fully capture the biologically relevant role of POLE in CRC. Rather, the functional consequences of POLE alterations are likely to depend predominantly on pathogenic mutations within the exonuclease domain, which impair proofreading activity and can result in an ultramutated phenotype, rather than on the level of POLE expression itself [34].
An important strength of this study is the integration of transcriptomic, immunological, and protein-level data, enabling cross-validation and a more comprehensive understanding of gene function in CRC. At the same time, the observed discrepancies between transcriptomic and protein-level findings emphasize the complexity of gene regulation in CRC and support the need for multi-level biomarker assessment. Such discordance is well documented in cancer biology, where mRNA abundance often shows only moderate correlation with protein levels due to post-transcriptional regulation, differences in translational efficiency, and variable protein stability and degradation [35, 36]. In addition, bulk RNA sequencing reflects gene expression across heterogeneous cellular populations within the tumor tissue, whereas IHC may provide a more spatially restricted assessment of protein expression, particularly when staining is evaluated in tumor cells. Differences in cellular composition, including the relative contribution of tumor, stromal, and immune cells, may therefore contribute to apparent discrepancies between transcriptomic and protein-level findings. These factors may be particularly relevant to the discordant RPA1 findings observed in the present study, although the specific biological basis of this discrepancy cannot be established from the available data. These considerations further highlight the importance of functional studies, including in vitro and in vivo models, to determine how alterations in RFC1, RPA1, and POLE expression influence tumor cell behavior, DNA replication and repair processes, and interactions with the tumor microenvironment. Such investigations may help clarify the biological mechanisms underlying the associations identified in the present study.
This study has several limitations. Immune infiltration analyses were derived from TCGA transcriptomic data using computational deconvolution methods, which depend on algorithmic assumptions and provide indirect measurements. In addition, identified immune associations are correlative and do not allow conclusions regarding causality between gene expression and tumor-immune interactions. Differences between mRNA and protein expression further reflect post-transcriptional regulation and methodological differences between bulk RNA sequencing and IHC. In particular, the lack of detectable POLE immunoreactivity in tumor cells prevented protein-level validation of the transcriptomic findings; because no orthogonal protein-level validation was performed, technical factors affecting antibody sensitivity or epitope accessibility cannot be completely excluded. Therefore, the absence of detectable tumor-cell POLE staining should not be interpreted as evidence of a biological absence of POLE protein. Finally, the relatively small, single-center validation cohort may limit generalizability of the findings.
Taken together, these findings suggest that replication-associated genes contribute to CRC biology through distinct mechanisms, with RFC1 primarily linked to clinical outcome, RPA1 to immune microenvironment modulation, and POLE to mutation-driven processes that may not be fully captured by expression-based analyses.
Abbreviations
CI: confidence interval
COAD: colon adenocarcinoma
CRC: colorectal cancer
CTLA4: cytotoxic T-lymphocyte associated protein 4
CXCL9: C-X-C motif chemokine ligand 9
DFS: disease-free survival
HAVCR2: hepatitis A virus cellular receptor 2
HR: hazard ratio
ICI: immune checkpoint inhibitor
IFNG: interferon gamma
IHC: immunohistochemistry
IRS: immunoreactive score
LAG3: lymphocyte activating 3
MSI: microsatellite instability
OS: overall survival
PD-1: programmed cell death protein 1
PD-L1: programmed death-ligand 1
PDCD1: programmed cell death 1
POLD1: DNA polymerase delta catalytic subunit 1
POLE: DNA polymerase epsilon catalytic subunit
PRF1: perforin 1
READ: rectal adenocarcinoma
RFC: replication factor C
RFC1: replication factor C subunit 1
ROC: receiver operating characteristic
RNA-seq: RNA sequencing
RPA: replication protein A
RPA1: replication protein A1
RSEM: RNA-Seq by expectation maximization
SII: systemic immune-inflammation index
TCGA: The Cancer Genome Atlas
TIGIT: T cell immunoreceptor with Ig and ITIM domains
TIM-3: T-cell immunoglobulin and mucin-domain containing-3
TIMEDB: Tumor Immune Microenvironment Database
TIMER3: Tumor Immune Estimation Resource, version 3
TMB: tumor mutational burden
TNM: tumor-node-metastasis classification system
VSIR: V-set immunoregulatory receptor
Supplementary Material
Supplementary figures and tables.

Acknowledgements
The authors would like to thank Anna Koprowicz-Wielguszewska, M.Sc., for her valuable technical assistance.
Funding
This study was supported by a statutory grant of the School of Medicine, Collegium Medicum, The University of Warmia and Mazury in Olsztyn, Poland.
Ethics approval and consent to participate
The study was conducted in accordance with the ethical standards and approved by the Bioethics Committee of the University of Warmia and Mazury in Olsztyn, Poland (approval no. 4/2010 and 21/2017). Written informed consent was obtained from all patients prior to inclusion in the study.
Availability of data and materials
The datasets used and/or analyzed during the current study, including the immunohistochemical scoring data and clinicopathological annotations, are available from the corresponding author on reasonable request, subject to applicable ethical and institutional restrictions.
AI Statement
ChatGPT (OpenAI) was used during the preparation of this manuscript solely for language editing, including grammar, clarity, and stylistic improvement. All artificial intelligence-assisted changes were reviewed and approved by the authors, who remain fully responsible for the content, accuracy, and conclusions of the manuscript. No artificial intelligence-generated scientific content or analyses were incorporated.
Author contributions
MG designed and supervised the study, assessed immunohistochemical reactions, performed statistical analysis, and drafted the manuscript. BEK performed statistical analyses and contributed to manuscript revision. JK performed immunohistochemical staining and contributed to manuscript revision. HM evaluated immunohistochemical staining intensities and contributed to data interpretation. JG supervised the study and critically revised the manuscript. MG and JG confirm the authenticity of all raw data. All authors contributed to writing the manuscript. All authors read and approved the final manuscript.
Competing Interests
The authors have declared that no competing interest exists.
References
1. Bray F, Laversanne M, Sung H, Ferlay J, Siegel RL, Soerjomataram I. et al. Global cancer statistics 2022: GLOBOCAN estimates of incidence and mortality worldwide for 36 cancers in 185 countries. CA A Cancer J Clinicians. 2024;74:229-63 https://doi.org/10.3322/caac.21834
2. Ashouri K, Wong A, Mittal P, Torres-Gonzalez L, Lo JH, Soni S. et al. Exploring Predictive and Prognostic Biomarkers in Colorectal Cancer: A Comprehensive Review. Cancers. 2024;16:2796 https://doi.org/10.3390/cancers16162796
3. Huo Z, Liu G, Li J. Recent research progress and clinical status of immunotherapy for colorectal cancer. Journal of Advanced Research. 2026;82:729-50 https://doi.org/10.1016/j.jare.2025.06.089
4. Gaillard H, García-Muse T, Aguilera A. Replication stress and cancer. Nat Rev Cancer. 2015;15:276-89 https://doi.org/10.1038/nrc3916
5. Burgers PMJ, Kunkel TA. Eukaryotic DNA Replication Fork. Annu Rev Biochem. 2017;86:417-38 https://doi.org/10.1146/annurev-biochem-061516-044709
6. The CORGI Consortium, The WGS500 Consortium, Palles C, Cazier J-B, Howarth KM, Domingo E. et al. Germline mutations affecting the proofreading domains of POLE and POLD1 predispose to colorectal adenomas and carcinomas. Nat Genet. 2013;45:136-44 https://doi.org/10.1038/ng.2503
7. Fanale D, Corsini LR, Piraino P, Pedone E, Brando C, Bazan Russo TD. et al. POLE-mutated endometrial cancer: new perspectives on the horizon? Front Oncol. 2025;15:1633260 https://doi.org/10.3389/fonc.2025.1633260
8. Gola M, Stefaniak P, Godlewski J, Jereczek-Fossa B, Starzyńska A. Prospects of POLD1 in Human Cancers: A Review. Cancers. 2023;15:1905 https://doi.org/10.3390/cancers15061905
9. Xu T, Zhang X, Wang Z, Shen L, Wang X, Li J. The clinical landscape of POLE-mutant colorectal cancer: a retrospective analysis of real-world outcome. BMC Med. 2026;24:83 https://doi.org/10.1186/s12916-025-04611-z
10. Wang F, Zhao Q, Wang Y-N, Jin Y, He M-M, Liu Z-X. et al. Evaluation of POLE and POLD1 Mutations as Biomarkers for Immunotherapy Outcomes Across Multiple Cancer Types. JAMA Oncol. 2019;5:1504 https://doi.org/10.1001/jamaoncol.2019.2963
11. Wu X, Tang H, Xu W-H, Tang H, Wei S, Anwaier A. et al. Protumorigenic Role of Elevated Levels of DNA Polymerase Epsilon Predicts an Immune-Suppressive Microenvironment in Clear Cell Renal Cell Carcinoma. Front Genet. 2021;12:751977 https://doi.org/10.3389/fgene.2021.751977
12. Temko D, Van Gool IC, Rayner E, Glaire M, Makino S, Brown M. et al. Somatic POLE exonuclease domain mutations are early events in sporadic endometrial and colorectal carcinogenesis, determining driver mutational landscape, clonal neoantigen burden and immune response. The Journal of Pathology. 2018;245:283-96 https://doi.org/10.1002/path.5081
13. Domingo E, Freeman-Mills L, Rayner E, Glaire M, Briggs S, Vermeulen L. et al. Somatic POLE proofreading domain mutation, immune response, and prognosis in colorectal cancer: a retrospective, pooled biomarker study. The Lancet Gastroenterology & Hepatology. 2016;1:207-16 https://doi.org/10.1016/S2468-1253(16)30014-0
14. Tang H, Hu X, Xu F, Lin K, Xu W, Huang H. et al. Increased DNA Polymerase Epsilon Catalytic Subunit Expression Predicts Tumor Progression and Modulates Tumor Microenvironment of Hepatocellular Carcinoma. J Cancer. 2022;13:2740-50 https://doi.org/10.7150/jca.64765
15. Gola M, Kieżun J, Kraziński BE, Majewska H, Sejda A, Godlewski J. RPA1, RFC1, and POLE Expression in Clear Cell Renal Cell Carcinoma: Immune and Clinical Relevance. Anticancer Res. 2025;45:5267-86 https://doi.org/10.21873/anticanres.17867
16. The Cancer Genome Atlas Research Network, Weinstein JN, Collisson EA, Mills GB, Shaw KRM, Ozenberger BA. et al. The Cancer Genome Atlas Pan-Cancer analysis project. Nat Genet. 2013;45:1113-20 https://doi.org/10.1038/ng.2764
17. Cerami E, Gao J, Dogrusoz U, Gross BE, Sumer SO, Aksoy BA. et al. The cBio Cancer Genomics Portal: An Open Platform for Exploring Multidimensional Cancer Genomics Data. Cancer Discovery. 2012;2:401-4 https://doi.org/10.1158/2159-8290.CD-12-0095
18. Goldman MJ, Craft B, Hastie M, Repečka K, McDade F, Kamath A. et al. Visualizing and interpreting cancer genomics data via the Xena platform. Nat Biotechnol. 2020;38:675-8 https://doi.org/10.1038/s41587-020-0546-8
19. Cortes-Ciriano I, Lee S, Park W-Y, Kim T-M, Park PJ. A molecular portrait of microsatellite instability across multiple cancers. Nat Commun. 2017;8:15180 https://doi.org/10.1038/ncomms15180
20. Cui H, Zhao G, Lu Y, Zuo S, Duan D, Luo X. et al. TIMER3: an enhanced resource for tumor immune analysis. Nucleic Acids Research. 2025;53:W534-41 https://doi.org/10.1093/nar/gkaf388
21. Wang X, Chen L, Liu W, Zhang Y, Liu D, Zhou C. et al. TIMEDB: tumor immune micro-environment cell composition database with automatic analysis and interactive visualization. Nucleic Acids Research. 2023;51:D1417-24 https://doi.org/10.1093/nar/gkac1006
22. Kiezun J, Godlewski J, Krazinski BE, Kozielec Z, Kmiec Z. Galanin Receptors (GalR1, GalR2, and GalR3) Expression in Colorectal Cancer Tissue and Correlations to the Overall Survival and Poor Prognosis of CRC Patients. IJMS. 2022;23:3735 https://doi.org/10.3390/ijms23073735
23. Remmele W, Stegner HE. [Recommendation for uniform definition of an immunoreactive score (IRS) for immunohistochemical estrogen receptor detection (ER-ICA) in breast cancer tissue]. Pathologe. 1987;8:138-40
24. Luo D, Li B, Jiang X. Multiple roles of replication factor C family in pan-cancer (Review). Oncol Rep. 2025;54:1-16 https://doi.org/10.3892/or.2025.8998
25. Misbah M, Kumar M, Najmi AK, Akhtar M. Identification of expression profiles and prognostic value of RFCs in colorectal cancer. Sci Rep. 2024;14:6607 https://doi.org/10.1038/s41598-024-56361-2
26. Tokunaga R, Zhang W, Naseem M, Puccini A, Berger MD, Soni S. et al. CXCL9, CXCL10, CXCL11/CXCR3 axis for immune activation - A target for novel cancer therapy. Cancer Treatment Reviews. 2018;63:40-7 https://doi.org/10.1016/j.ctrv.2017.11.007
27. Bai J, Chen H, Bai X. Relationship between microsatellite status and immune microenvironment of colorectal cancer and its application to diagnosis and treatment. Clinical Laboratory Analysis. 2021;35:e23810 https://doi.org/10.1002/jcla.23810
28. Maréchal A, Zou L. RPA-coated single-stranded DNA as a platform for post-translational modifications in the DNA damage response. Cell Res. 2015;25:9-23 https://doi.org/10.1038/cr.2014.147
29. Wang G, Li Y, Wang P, Liang H, Cui M, Zhu M. et al. PTEN regulates RPA1 and protects DNA replication forks. Cell Res. 2015;25:1189-204 https://doi.org/10.1038/cr.2015.115
30. Qin G, Chen Z, Tian W, Chen H, Zhang Y, Wei W. Exploring RPA1-ETAA1 axis via high-throughput data analysis: implications for PD-L1 nuclear translocation and tumor-immune dynamics in liver cancer. Front Immunol. 2024;15:1492531 https://doi.org/10.3389/fimmu.2024.1492531
31. Sauer N, Janicka N, Szlasa W, Skinderowicz B, Kołodzińska K, Dwernicka W. et al. TIM-3 as a promising target for cancer immunotherapy in a wide range of tumors. Cancer Immunol Immunother. 2023;72:3405-25 https://doi.org/10.1007/s00262-023-03516-1
32. Tawbi HA, Schadendorf D, Lipson EJ, Ascierto PA, Matamala L, Castillo Gutiérrez E. et al. Relatlimab and Nivolumab versus Nivolumab in Untreated Advanced Melanoma. N Engl J Med. 2022;386:24-34 https://doi.org/10.1056/NEJMoa2109970
33. Siraj AK, Bu R, Iqbal K, Parvathareddy SK, Masoodi T, Siraj N. et al. POLE and POLD1 germline exonuclease domain pathogenic variants, a rare event in colorectal cancer from the Middle East. Molec Gen & Gen Med. 2020;8:e1368 https://doi.org/10.1002/mgg3.1368
34. Gola M, Kraziński BE, Kieżun J, Starzyńska A, Sakowicz-Burkiewicz M, Jereczek-Fossa BA, Godlewski J. DNA polymerase epsilon catalytic subunit (POLE) in cancer: Implications for tumor biology and therapeutic strategies - A comprehensive review. Crit Rev Oncol Hematol. 2026;225:105464 https://doi.org/10.1016/j.critrevonc.2026.105464
35. Kowalczyk AE, Godlewski J, Krazinski BE, Kiewisz J, Sliwinska-Jewsiewicka A, Kwiatkowski P. et al. Divergent expression patterns of SATB1 mRNA and SATB1 protein in colorectal cancer and normal tissues. Tumor Biol. 2015;36:4441-52 https://doi.org/10.1007/s13277-015-3084-0
36. Upadhya SR, Ryan CJ. Experimental reproducibility limits the correlation between mRNA and protein abundances in tumor proteomic profiles. Cell Reports Methods. 2022;2:100288 https://doi.org/10.1016/j.crmeth.2022.100288
Author contact
Corresponding author: Michał Gola, quanchibossnadeu.