Impact Factor ISSN: 1837-9664




J Cancer 2026; 17(11):1952-1964. doi:10.7150/jca.142445 This issue Cite
Research Paper
Integrative Locus-Resolved Genomics Uncovers Distinct Genetic Links Between Leukocyte Telomere Length and Colon Cancer Susceptibility
Aocheng Ji1,2†, Wenbin Xu1,2†, Yonghui Wu3, Yiyi Jin3, Wen Lin3, Longxin Xiong4  , Chunyan Zeng1
1. Department of Gastroenterology, Jiangxi Province Hospital of Integrated Chinese and Western Medicine, Nanchang, Jiangxi, 330003, China.
2. Department of Clinical Medicine, Jiangxi University of Chinese Medicine, Nanchang, Jiangxi, 330004, China.
3. Department of Gastroenterology, Jiangxi Provincial Key Laboratory of Digestive Diseases, Jiangxi Clinical Research Center for Gastroenterology, Digestive Disease Hospital, The First Affiliated Hospital, Jiangxi Medical College, Nanchang University, Nanchang, Jiangxi, China.
4. Department of General Surgery, Central Hospital of Nanchang City, Nanchang, Jiangxi, China.
†These authors contributed equally.
Received 2026-8-12; Accepted 2026-9-26; Published 2026-10-25
Abstract
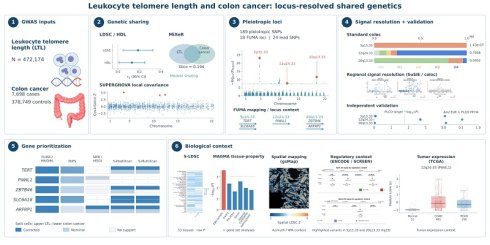
Background: Leukocyte telomere length (LTL) is a heritable marker of telomere-maintenance biology and has been implicated in cancer susceptibility. Whether LTL and colon cancer share inherited genetic architecture remains unclear.
Methods: We integrated GWAS summary statistics for LTL and colon cancer using a cross-trait post-GWAS framework. Genome-wide and local genetic sharing were assessed using LDSC, HDL, MiXeR and SUPERGNOVA, while pleiotropic loci were identified with PLACO/FUMA. Locus-level signal architecture was characterized using coloc and SuSiE, with ancestry-matched LD sensitivity analyses and locus-specific evaluation in external datasets. Candidate genes were prioritized using MAGMA, SMR/HEIDI, TWAS and PoPS. S-LDSC tissue enrichment, exploratory gsMap spatial mapping with dependence diagnostics and comparisons across three additional CRC sections, ENCODE/SCREEN regulatory annotation and TCGA-COAD/READ expression analyses were used to place the genetic findings in biological context.
Results: LTL and colon cancer showed modest genome-wide sharing (LDSC rg = 0.187, SE = 0.071, P = 0.0086; HDL rg = 0.130, SE = 0.062, P = 0.036), while SUPERGNOVA identified three FDR-significant local covariance regions. PLACO identified 189 pleiotropic SNPs, grouped by FUMA into 18 loci and 24 lead SNPs. Signal-resolution analyses distinguished three architectures: 5p15.33 was a reproducible pleiotropic locus with distinct trait-specific signals; 12q24.33 provided the strongest moderate-to-high evidence for a shared single-signal architecture (PP.H4 = 0.757); and 20q13.33 was a pleiotropic discovery locus with limited shared-signal support. Independent validation was strongest at 12q24.33. TERT, PIWIL1 and ZBTB46 were prioritized as locus-centric candidates, with SLC6A18 and ARFRP1 providing additional corrected transcriptome-linked support. Exploratory spatial analyses showed broad but non-uniform patterns, with reproducible tumor and intestinal-epithelial enrichment across three additional CRC sections. cCRE annotation highlighted regulatory overlap at 5p15.33 and 20q13.33, while TCGA-COAD/READ analyses provided complementary tumor-expression context.
Conclusions: LTL and colon cancer share modest polygenic architecture that resolves into heterogeneous locus-specific signals. Signal resolution, gene prioritization and spatial context highlight 12q24.33 and the lead candidates TERT, PIWIL1 and ZBTB46 for locus-specific genetic and functional follow-up.
Keywords: leukocyte telomere length, colon cancer, telomere maintenance, cancer genetics, genetic pleiotropy, post-GWAS analysis
Introduction
Telomeres are repetitive nucleoprotein structures that protect chromosome ends from degradation, end-to-end fusion and inappropriate DNA damage responses [1]. Progressive telomere shortening during cell division contributes to cellular senescence, apoptosis and chromosomal instability, thereby influencing the proliferative lifespan of somatic cells [2]. Leukocyte telomere length (LTL) serves as a highly heritable systemic biomarker of inherited telomere-maintenance capacity [3]. In the colonic epithelium, a tissue characterized by high turnover and rapid self-renewal, the regulation of telomere length exerts a dual influence on oncogenesis [4,5]. Insufficient telomere maintenance may precipitate genomic instability, whereas over-maintenance can paradoxically facilitate the clonal expansion of cells harboring oncogenic mutations [5]. This balance provides a plausible but non-linear link between inherited telomere biology and colon cancer susceptibility [4,5,6]. This relationship provides a genetic context for examining how telomere-maintenance biology may contribute to colon cancer susceptibility.
Previous genetic studies, including Mendelian randomization (MR), have implicated telomere length in cancer susceptibility, but MR is primarily designed to evaluate the directional effect of a genetically proxied exposure on disease [7]. Genetic epidemiology offers complementary frameworks for dissecting shared aetiology, including cross-trait approaches that map genetic correlation and pleiotropic sharing. Recent work in intestinal genetic epidemiology has therefore emphasized triangulation across complementary study designs, together with careful consideration of pleiotropy, ancestry and other methodological assumptions [8]. These considerations are particularly relevant to cross-trait analyses, in which pleiotropy is not merely a potential source of bias but a feature to be mapped and resolved. Against this background, we asked where the inherited architectures of LTL and colon cancer overlap and whether pleiotropic regions reflect a shared association signal or distinct trait-specific signals [9,10]. Therefore, we integrated genome-wide and local genetic sharing, locus-level pleiotropy and signal-resolution analyses, complemented by independent validation and functional genomic context [9,10].
To characterize this shared architecture, we implemented a hierarchical cross-trait framework. LDSC, HDL and MiXeR quantified genome-wide genetic sharing; SUPERGNOVA identified regions of local genetic covariance; PLACO/FUMA mapped pleiotropic loci; and coloc with SuSiE-based sensitivity analyses resolved shared single-signal support from distinct association components. Gene prioritization then integrated FUMA/MAGMA mapping and gene-based evidence, PoPS ranking, and transcriptome-linked analyses with multiple-testing correction, while tissue and spatial analyses, regulatory annotation, and tumor-expression analyses provided biological context.
Methods
Data sources and quality control
LTL summary statistics were obtained from the IEU OpenGWAS entry ieu-b-4879, corresponding to the UK Biobank LTL GWAS of 472,174 individuals [3,11]. Colon cancer summary statistics were obtained from FinnGen release 12 endpoint C3_COLON_EXALLC, comprising 7,698 cases and 378,749 controls [12]. FinnGen coordinates were converted from hg38 to hg19 before downstream analyses. After coordinate and allele harmonization, we removed duplicate or unresolved variants, applied a minor allele frequency (MAF) threshold of MAF > 0.01, and excluded the extended MHC region on chromosome 6 (25-35 Mb, hg19) (Table S1).
Genome-wide and local genetic sharing
Genome-wide genetic sharing between LTL and colon cancer was first quantified using linkage disequilibrium score regression (LDSC) v1.0.1, which estimated cross-trait genetic correlation from HapMap3-restricted summary statistics with European LD-score resources [13,14]. High-definition likelihood (HDL) method v1.4.1 provided an independent likelihood-based genetic-correlation estimate using the UK Biobank imputed LD reference [15].
To evaluate polygenic sharing beyond genetic correlation, bivariate causal mixture model framework (MiXeR) v2.2.1 was applied using 1000 Genomes European reference resources [16,17]. Univariate models estimated trait-specific polygenic components, followed by bivariate modeling of shared and trait-specific components, modeled genetic correlation and Dice overlap. Binary-trait effective sample size was used for colon cancer. MiXeR estimates were summarized across five replicate runs, and the replicate-mean estimates were used.
SUPERGNOVA was used to estimate pairwise local genetic covariance between LTL and colon cancer across 2,328 approximately independent European LD blocks [18]. This framework partitions the genome into LD-defined regions and evaluates whether genetic sharing between the two traits is concentrated within specific genomic segments. Regional significance was assessed using FDR and Bonferroni correction across the 2,328 tested regions, with the Bonferroni threshold defined as 0.05/2,328.
Pleiotropic locus mapping and FUMA annotation
Pleiotropic variants were identified using PLACO under the composite-null hypothesis framework [19], with genome-wide pleiotropic significance defined as PPLACO < 5 × 10⁻⁸. PLACO was applied to harmonized LTL and colon cancer summary statistics after excluding variants with extreme association statistics.
Genome-wide significant PLACO variants were annotated with Functional Mapping and Annotation (FUMA) SNP2GENE v1.8.2, with Multi-marker Analysis of GenoMic Annotation (MAGMA) applied for gene-based analysis [20,21]. Annotation was performed against the 1000 Genomes Phase 3 EUR reference panel [17], using the PLACO P value as the association P-value column. FUMA SNP2GENE parameters included a lead-SNP threshold of P = 5 × 10⁻⁸, a maximum input-SNP threshold of P = 0.05, an LD r² clumping threshold of 0.6 for independent significant SNPs and 0.1 for lead SNPs and a 250-kb locus-merging distance.
Fine-mapping, signal-level colocalization and independent validation
Targeted colocalization across PLACO-defined pleiotropic loci examined whether LTL and colon cancer associations were compatible with shared or distinct regional signals. Standard coloc v5.1.0 estimated posterior probabilities for no association (PP.H0), LTL only (PP.H1), colon cancer only (PP.H2), both traits through distinct variants (PP.H3), or both traits through one shared signal under the single-signal model (PP.H4) [22]. The same prior probabilities were used across loci (p1 = 1 × 10⁻⁴, p2 = 1 × 10⁻⁴ and p12 = 1 × 10⁻⁵). PP.H4 > 0.8 was prespecified as strong evidence, whereas 0.5 ≤ PP.H4 < 0.8 was considered moderate-to-high support. For 12q24.33, a conservative variant-set sensitivity analysis was additionally performed within the same FUMA-defined core region by restricting the analysis to the 121 variants retained in the 1000 Genomes Phase 3 EUR intersection.
For PLACO-defined loci showing evidence of potential allelic heterogeneity under the standard single-signal coloc model, SuSiE-RSS [23,24] was used to resolve potential allelic heterogeneity and test whether individual fine-mapped components showed signal-level colocalization. Analyses used 250-kb-padded regions with LD matrices from the 1000 Genomes Phase 3 European reference panel [17], with L = 3 and L = 10 configurations evaluated in signal-resolution and sensitivity analyses. 95% credible sets were generated with max_iter = 2,000, and component-level colocalization between LTL and colon cancer was assessed with coloc.susie v5.1.0 across all pairwise SuSiE signal combinations. The same PP.H4 interpretation used for standard coloc was applied at the component level. To assess the robustness of these signal-level findings to LD reference choice and model specification, additional sensitivity analyses at 5p15.33 and 20q13.33 used the larger ancestry-matched Pan-UK Biobank LD resource, alternative SuSiE component specifications (including L = 10), and study-specific in-sample fine-mapping, as available by locus.
Independent validation focused on the three principal loci. Disease-side replication used the broader-phenotype GCST012879 colorectal-cancer GWAS and the phenotype-matched PLCO colon-cancer data (1,611 cases and 65,142 controls), with Bonferroni significance defined as P < 0.01667 for the three prespecified index variants. For independent cross-trait validation, All of Us European LTL was paired with PLCO colon cancer. Within the prespecified 5p15.33, 12q24.33 and 20q13.33 regions, PLACO was reapplied and both the prespecified index-variant PPLACO and the minimum PPLACO within each predefined region were reported, distinguishing index-variant replication from broader locus-level pleiotropic support. Standard coloc was repeated using the same prior probabilities as in the discovery analysis. Standard coloc used FUMA-defined core regions for AoU-European LTL × PLCO and regions extended by 250 kb on each side for GCST012879 and PLCO.
Expression-linked and transcriptome-linked analyses
Summary-based Mendelian randomization (SMR) with the HEIDI test was used to integrate GWAS and cis-eQTL summary statistics and identify expression-linked associations with each trait, with the HEIDI test used to assess heterogeneity [25]. SMR associations were adjusted for multiple testing within trait using the Benjamini-Hochberg procedure, while HEIDI P > 0.05 was interpreted as the absence of detected heterogeneity. Detailed testing counts and correction thresholds are provided in the Supplementary material. Complementary transcriptome-wide analyses used S-PrediXcan and S-MultiXcan with GTEx v8 prediction models [26,27,28], assessing tissue-specific and cross-tissue predicted-expression associations, respectively. The tissue panel comprised Colon Sigmoid, Colon Transverse, Small Intestine Terminal Ileum, Whole Blood and EBV-transformed lymphocytes. FUSION TWAS with GTEx Whole Blood weights [28, 29] provided an additional blood-expression sensitivity analysis. For each method, multiple-testing-adjusted results were distinguished from nominal associations.
Gene prioritization was organized across four complementary evidence domains: (i) locus mapping and gene-based association, using FUMA and MAGMA, respectively; (ii) PoPS [30] prioritization; (iii) transcriptome-linked evidence from SMR/HEIDI, S-PrediXcan, S-MultiXcan and FUSION after method-specific multiple-testing correction; and (iv) biological context from tissue, regulatory, tumor expression and spatial analyses. PoPS was applied genome-wide using PLACO-derived MAGMA gene statistics and the FUMA-compatible feature set, yielding continuous prioritization scores for 20,260 genes. Scores were interpreted by within-locus rank rather than as significance measures, with no numerical cross-domain score. Gene prioritization followed a hierarchical rule. Within each fixed focal locus, the highest PoPS-scoring protein-coding gene supported by FUMA mapping and Bonferroni-significant MAGMA association (P < 2.71 × 10⁻⁶) was retained as the locus-centric candidate. Corrected transcriptome-linked evidence was evaluated separately, and additional candidates were retained if they showed either corrected transcriptome-linked support for both traits or corrected SMR support after Benjamini-Hochberg adjustment with HEIDI P > 0.05. Biological-context analyses did not contribute to statistical prioritization.
Spatial genetic mapping and regulatory annotation
Tissue context was evaluated using S-LDSC [13, 31] for tissue-specific heritability enrichment and MAGMA tissue-property and gene-set analyses [21]. FDR < 0.05 defined significance where multiple-testing correction was applied. To examine the spatial context of cross-trait association, PLACO P values were converted into signed Z scores using the sign of the PLACO test statistic. These derived statistics were then used as input to gsMap [32] for exploratory spatial mapping in a 10x Genomics Visium HD human colon-cancer section. One-sided bin-level P values were adjusted using the Benjamini-Hochberg method. Neighboring-bin Pearson and Spearman correlations and Moran's I quantified spatial dependence. Region-level inference used Cauchy aggregation across source-defined graph-based clusters, with robustness assessed using an independently generated expression-based Leiden clustering. Azimuth-labelled segmented cells mapped to Visium HD bins were used to annotate the source-defined clusters and summarize candidate-gene expression by cell class.
Spatial reproducibility was assessed in three additional CRC Visium HD tumor sections from GSE280315 (P1CRC/GSM8594567, P2CRC/GSM8594568 and P5CRC/GSM8594569), retaining source-defined 8-µm bins and annotations. Tumor and intestinal-epithelial enrichment results were evaluated within each section and across sections by Cauchy aggregation. Human Protein Atlas single-cell colon data were used as an external qualitative normal-colon reference [33]. Candidate-gene module scores were calculated as the mean log-transformed expression across constituent genes.
Highlighted variants were annotated against ENCODE/SCREEN candidate cis-regulatory elements (cCREs) in GRCh37/hg19 coordinates, recording direct overlaps and the nearest cCREs [34]. TCGA-COAD/READ RNA-seq data were used only as an external tumor-expression context [35]. Normalized gene expression and candidate-module scores were compared between tumor and normal tissues using two-sided Wilcoxon rank-sum tests with Benjamini-Hochberg FDR correction, with a COAD-only analysis used as a sensitivity analysis. Because some patients contributed multiple specimens, these sample-level comparisons were interpreted descriptively.
Results
Genome-wide and local genetic sharing
LDSC analysis demonstrated a modest positive genetic correlation between LTL and colon cancer (rg = 0.187, P = 0.0086). HDL yielded a directionally consistent estimate (rg=0.130, P= 0.0356) (Fig. 1A; Table S2). MiXeR further supported limited but detectable polygenic overlap (Fig. 1B; Table S3), with a modeled cross-trait rg of 0.204 and a Dice coefficient of 0.194.
Genome-wide and regional genetic sharing between leukocyte telomere length and colon cancer. (A) Cross-trait genetic correlation estimates from LDSC and HDL. Points denote genetic-correlation estimates, horizontal bars denote 95% confidence intervals estimated from the reported standard errors, and the vertical dashed line indicates the null value. (B) MiXeR-modeled polygenic overlap between leukocyte telomere length (LTL) and colon cancer. The teal region denotes LTL-specific polygenic components, the blue region denotes colon cancer-specific components, and the gray overlapping region denotes shared components. Numbers within the diagram are rounded MiXeR-estimated variant counts. ρβ denotes the effect-size correlation within the shared polygenic component; modeled genome-wide rg = 0.204 and Dice = 0.194 describe genetic correlation and polygenic overlap, respectively. Overlap in MiXeR represents modeled polygenic sharing rather than variant-level colocalization. (C) SUPERGNOVA local genetic covariance across European LD-defined genomic regions. Red denotes regions significant after both Bonferroni and FDR correction, orange denotes FDR-significant regions, blue denotes a nominal prior-overlap region that did not pass FDR correction, and gray denotes other tested regions. LTL, leukocyte telomere length; LDSC, linkage disequilibrium score regression; HDL, high-definition likelihood; LD, linkage disequilibrium; FDR, false discovery rate.
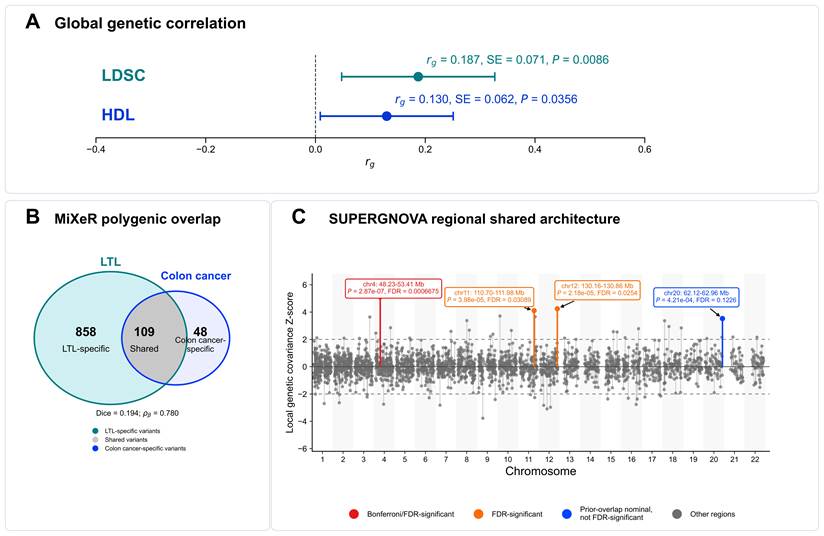
SUPERGNOVA tested 2,328 LD-defined genomic regions and identified three FDR-significant regions with positive local genetic covariance (Fig. 1C; Table S4). The strongest region was chr4:48,227,642-53,412,129 (FDR = 6.68 × 10⁻⁴). Two additional regions were FDR-significant at chr12:130,158,997-130,859,973 (FDR = 0.0254), overlapping the 12q24.33 PLACO/FUMA locus, and chr11:110,702,636-111,981,853 (FDR = 0.0309). The 20q13.33 region showed nominal positive local covariance but did not pass FDR correction (P = 4.21 × 10⁻⁴, FDR = 0.1226).
Cross-trait pleiotropic loci
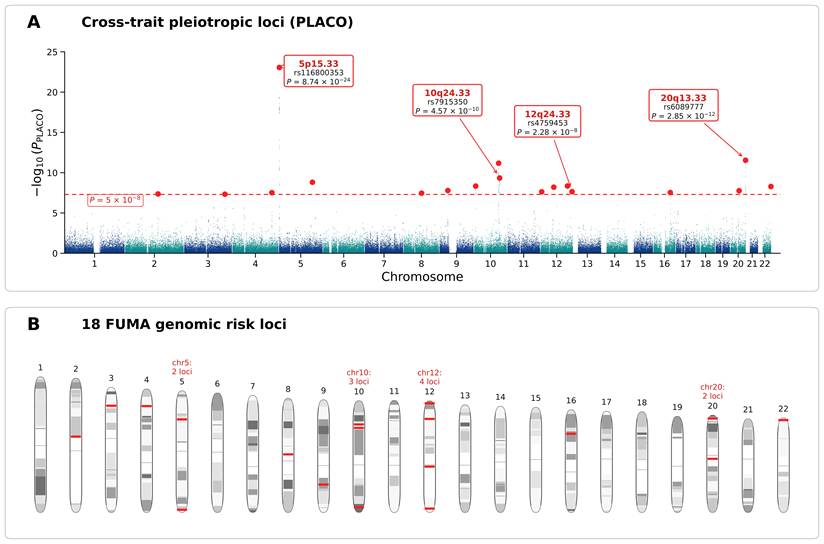
We next mapped cross-trait pleiotropic loci using PLACO. In total, 189 pleiotropic SNPs reached genome-wide significance (PPLACO < 5 × 10⁻⁸), and FUMA grouped these variants into 18 genomic risk loci and 24 lead SNPs (Fig. 2; Table S5). These results localized cross-trait pleiotropic signals to discrete genomic regions. The strongest PLACO signal mapped to 5p15.33, led by rs116800353(PPLACO=8.74×10⁻²⁴). This telomere-related region contains TERT. A second prominent signal mapped to 20q13.33 at rs6089777(PPLACO=2.85×10⁻¹²), near RTEL1 and other regional genes linked to telomere maintenance and immune regulation.
Genome-wide pleiotropic loci shared by leukocyte telomere length and colon cancer. (A) Manhattan plot of PLACO association statistics across autosomes. The y-axis shows -log10(PPLACO), and the dashed horizontal line indicates the genome-wide pleiotropic significance threshold of PPLACO = 5 × 10⁻⁸. Labeled loci highlight representative regions prioritized for downstream interpretation. Alternating chromosome colors are used to distinguish adjacent chromosomes. (B) Chromosomal summary of FUMA-defined genomic risk loci derived from PLACO-significant variants. Red marks summarize the chromosome-level distribution of these loci. PLACO, pleiotropic analysis under composite null hypothesis; FUMA, functional mapping and annotation.
Locus-resolved signal architecture and independent validation
Standard single-signal colocalization across the 18 PLACO/FUMA loci revealed marked locus-level heterogeneity (Fig. 3A; Table S6). The strongest shared-signal support occurred at 12q24.33, where rs4759453 yielded PP.H4 = 0.7566 and PP.H3 = 0.0637, representing moderate-to-high support for a shared single-signal architecture. A conservative variant-set sensitivity analysis yielded similar support (PP.H4 = 0.7276), whereas the remaining loci showed lower single-signal support.
Locus-resolved signal architecture and independent validation of prioritized LTL-colon cancer loci. (A) Standard coloc posterior probabilities across the 18 PLACO/FUMA loci. Loci are ordered by PP.H4; stacked bars show PP.H0-PP.H4, representing no association, LTL-only association, colon-cancer-only association, association with both traits through distinct signals, and a shared association signal, respectively. 12q24.33 showed the highest PP.H4 (0.7566), whereas 20q13.33 and 5p15.33 had PP.H4 values of 0.0402 and 1.43 × 10⁻⁷, respectively. (B) Regional association and signal-resolution profiles for 5p15.33, 20q13.33, 12q24.33 and 10q24.33. Points show association strength; colours indicate LD (r²) with the index SNP, and lower tracks show LTL and colon-cancer signal positions. 5p15.33 and 20q13.33 show distinct association patterns, 12q24.33 the strongest shared-signal pattern, and 10q24.33 weaker standard-coloc support. (C) Disease-side replication of the three principal loci in independent colon-cancer datasets. Points show target-variant associations in GCST012879 and PLCO; rs4759453 at 12q24.33 replicated in PLCO (P = 0.002053). (D) Independent cross-trait pleiotropic evidence for the three principal loci, showing the target PPLACO and minimum regional PPLACO. (E) Independent colocalization using AoU-European LTL and PLCO colon-cancer data. Stacked bars show PP.H0-PP.H4; 12q24.33 had the highest external PP.H4 (0.5352). Panels A-B summarize locus discovery and signal resolution, whereas panels C-E show complementary external validation. Detailed results are provided in Tables S6, S7, and S19. LTL, leukocyte telomere length; PLACO, pleiotropic analysis under composite null hypothesis; FUMA, Functional Mapping and Annotation; LD, linkage disequilibrium; PLCO, Prostate, Lung, Colorectal and Ovarian Cancer Screening Trial.
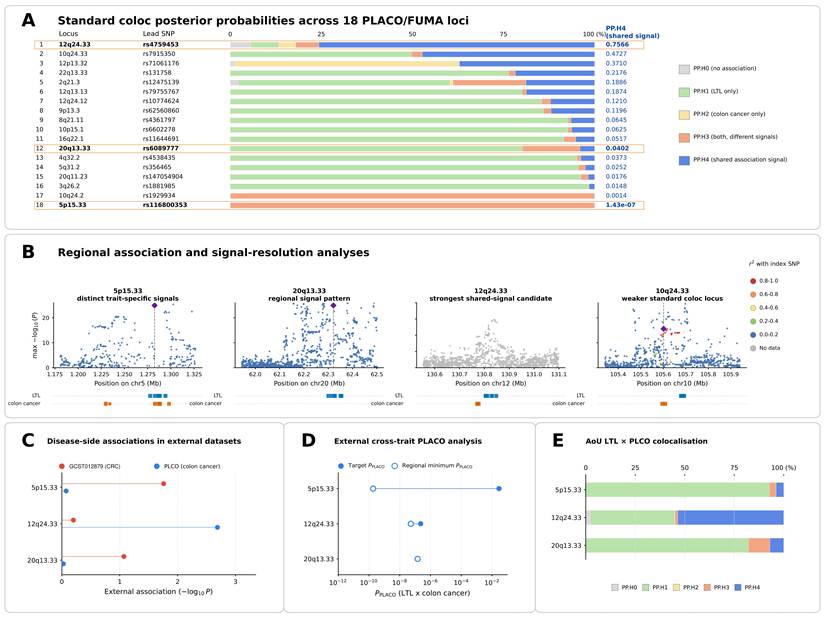
The telomere-related 5p15.33 and 20q13.33 loci showed a contrasting architecture. Despite 5p15.33 representing the strongest pleiotropic locus identified by PLACO, standard coloc strongly favored distinct signals (PP.H3 = 0.999999; PP.H4 = 1.43 × 10⁻⁷). At 20q13.33, shared single-signal support was likewise limited (PP.H4 = 0.0402). LD-reference and fine-mapping sensitivity analyses did not support robust shared components at either locus. Thus, 12q24.33 remained the strongest shared single-signal candidate, whereas 5p15.33 favored distinct regional signals and 20q13.33 showed limited shared-signal support (Fig. 3A, B; Table 1; Tables S6-7).
Locus-resolved quantitative evidence for the three principal LTL-colon-cancer loci. Columns summarize local genetic covariance, cross-trait pleiotropic association, standard colocalization, signal-resolution analyses, disease-side replication, independent pleiotropic replication and independent colocalization. SUPERGNOVA ρ denotes local genetic covariance. Standard coloc PP.H3 and PP.H4 represent association with both traits through distinct signals and a shared association signal, respectively; PP.H4 > 0.80 was prespecified as strong standard-coloc evidence. Signal-resolution results summarize the principal sensitivity result for each locus. Independent P_PLACO values are shown for the prespecified target variant and the minimum regional value. NT denotes not tested because the prespecified target variant did not pass the Z² quality-control criterion; CS denotes credible set. Detailed results are provided in Tables S6, S7, and S19.
| Locus | Lead SNP | SUPERGNOVA ρ; FDR | PPLACO | Standard coloc H3 / H4 | Signal-resolution | GCST / PLCO target P | Independent PPLACO target / regional min | Independent PP.H4 | Key genes |
|---|---|---|---|---|---|---|---|---|---|
| 12q24.33 | rs4759453 | 3.97×10⁻⁴; 0.0254 | 2.28×10⁻⁸ | 0.0637 / 0.7566 | Sensitivity H4=0.7276 | 0.6315 / 0.002053 | 2.30×10⁻⁷ / 5.23×10⁻⁸ | 0.535 | PIWIL1 |
| 5p15.33 | rs116800353 | -6.17×10⁻⁴; 0.999 | 8.74×10⁻²⁴ | 0.999999 / 1.43×10⁻⁷ | Max in-sample PP.H4 = 1.23×10⁻⁶ | 0.01743 / 0.8435 | 2.86×10⁻² / 1.86×10⁻¹⁰ | 0.039 | TERT; SLC6A18 |
| 20q13.33 | rs6089777 | 1.54×10⁻³; 0.1226 | 2.85×10⁻¹² | 0.1580 / 0.0402 | Non-overlapping CS | 0.08492 / 0.9421 | NT / 1.45×10⁻⁷ | 0.070 | ZBTB46; ARFRP1 |
External analyses further separated disease-side association, locus-level pleiotropy and shared-signal support (Fig. 3C-E; Table S19). At 12q24.33, the prespecified rs4759453 disease-side association replicated in phenotype-matched PLCO colon-cancer data (P = 0.002053; Bonferroni threshold = 0.01667). External AoU-European LTL × PLCO analyses further provided additional evidence consistent with pleiotropy at the prespecified target(PPLACO = 2.30 × 10⁻⁷; regional minimum PPLACO= 5.23 × 10⁻⁸) together with moderate-to-high shared-signal support (PP.H4 = 0.5352).
At 5p15.33, independent analysis showed strong regional pleiotropic evidence (minimum PPLACO = 1.86 × 10⁻¹⁰), while colocalization remained low (PP.H4 = 0.0386), providing little support for a shared association signal. At 20q13.33, external support was weaker (regional minimum PPLACO = 1.45 × 10⁻⁷; PP.H4 = 0.0697). Additional cross-ancestry analyses are reported in Table S19.
Integrated gene prioritization
Candidate-gene evidence was evaluated across four complementary domains: (i) locus mapping and gene-based association; (ii) PoPS prioritization; (iii) transcriptome-linked evidence surviving method-specific multiple-testing correction; and (iv) biological context, with statistical prioritization separated from supporting contextual evidence (Table 2; Tables S8-11). Corrected statistical evidence was given greater interpretive weight than nominal transcriptome-linked evidence. Within each fixed focal locus, the highest PoPS-scoring protein-coding gene among FUMA/MAGMA-supported genes was retained as the locus-centric candidate. Accordingly, TERT, PIWIL1 and ZBTB46 were the locus-centric candidates at 5p15.33, 12q24.33 and 20q13.33, respectively. TERT had a PoPS score of 2.327 and Bonferroni-significant MAGMA evidence (P = 6.69 × 10⁻⁹); PIWIL1 had a PoPS score of 1.299 and Bonferroni-significant MAGMA evidence (P = 1.47 × 10⁻⁶); and ZBTB46 had a PoPS score of 0.633 and Bonferroni-significant MAGMA evidence (P = 9.35 × 10⁻¹¹). SLC6A18 and ARFRP1 were additionally retained on the basis of corrected transcriptome-linked evidence, with support in both traits for SLC6A18 and LTL-specific support, including SMR, for ARFRP1. After multiple-testing correction, no colon-cancer SMR association remained significant, whereas ARFRP1 retained corrected LTL-side support (P = 1.52 × 10⁻¹¹; BH q = 5.93 × 10⁻⁹; PHEIDI = 0.127). Nominal transcriptome-linked associations were retained as supporting evidence only, and locus-level colocalization was treated as locus-level rather than gene-level evidence and was not assigned to individual genes as causal support.
Quantitative gene-prioritization evidence for the five principal candidate genes. Candidate-gene evidence was organised across locus mapping and gene-based association, PoPS prioritization, transcriptome-linked evidence after method-specific multiple-testing correction, and biological context, without constructing a numerical cross-domain score. MAGMA P values represent gene-based association statistics. PoPS scores were derived from the MAGMA statistics of the PLACO and were used for within-locus prioritization; they are prioritization metrics rather than P values. † denotes the nearest protein-coding gene to the corresponding lead variant. The transcriptome-linked column reports the most informative method-specific results for each gene. Corrected S-MultiXcan associations are shown where available; for PIWIL1, no S-PrediXcan, S-MultiXcan or FUSION prediction model was available, and the corresponding SMR BH-adjusted q values are therefore shown. For ARFRP1, the SMR result is accompanied by the corresponding HEIDI P value. TCGA values represent the tumor-minus-normal median expression difference followed by the BH-adjusted FDR; positive values indicate higher expression in tumors. Complete method-specific transcriptome-linked results, including model availability and nominal or negative findings, are provided in Tables S9-11. No numerical weighting, vote count or composite ranking across evidence domains was used.
| Gene | Locus | MAGMA gene P | PoPS score | Key transcriptome-linked results | TCGA tumor-normal expression [median difference; FDR] |
|---|---|---|---|---|---|
| TERT | 5p15.33 | 6.69×10⁻9 | 2.327 | LTL S-MultiXcan FDR = 2.31×10⁻⁵⁸ | +0.597; 3.77×10⁻¹¹ |
| SLC6A18† | 5p15.33 | 6.49×10⁻15 | 2.307 | S-MultiXcan FDR: LTL = 8.46×10⁻¹⁵; CC = 1.42×10⁻⁴ | -0.131; 1.46×10⁻⁵ |
| PIWIL1† | 12q24.33 | 1.47×10⁻⁶ | 1.299 | SMR q: LTL = 0.192; CC = 0.735; | +1.340; 1.70×10⁻¹⁷ |
| ZBTB46† | 20q13.33 | 9.35×10⁻¹¹ | 0.633 | LTL S-MultiXcan FDR = 1.63×10⁻³⁸ | -0.041; 0.846 |
| ARFRP1 | 20q13.33 | 5.66×10⁻⁸ | 0.166 | LTL S-MultiXcan FDR = 1.84×10⁻⁵⁰; SMR q = 5.93×10⁻⁹ (HEIDI P = 0.127) | +0.470; 1.87×10⁻¹⁰ |
Biological context of prioritized loci
Tissue and pathway analyses provided biological context for the prioritized loci (Table S12). In S-LDSC, LTL showed significant enrichment in spleen, whereas colon-tissue annotations did not show significant enrichment. MAGMA tissue-property analysis provided complementary immune-context support through EBV-transformed lymphocytes. MAGMA gene-set analysis identified the 5p15 amplicon signature as the only Bonferroni-significant gene set.
Spatial mapping placed the cross-trait statistics in CRC tissue context (Fig. 4A; Table S13). In the primary section, 88,817 of 147,520 bins passed BH FDR < 0.05, but neighboring-bin correlation (Pearson r = 0.784; Spearman r = 0.783) and Moran's I = 0.785 showed that these bins were spatially dependent. Region-level Cauchy aggregation identified broad but non-uniform enrichment: eight of nine source-defined regions were significant, with epithelial-rich C5 ranking first (mean Z = 4.662; Cauchy P = 2.06 × 10⁻⁹; BH q = 1.85 × 10⁻⁸). An independent Leiden analysis also ranked the corresponding epithelial-rich region first. Across three CRC Visium HD sections comprising 1,595,565 bins, tumor annotations ranked first and intestinal-epithelial annotations were significant in every section; multi-section Cauchy P values for tumor and intestinal epithelial annotations were approximately 6.00 × 10⁻¹⁵ and 5.15 × 10⁻⁷, respectively. Other tumor-microenvironment compartments were also enriched.
Spatial, regulatory and tumor-expression context of prioritized LTL-colon cancer loci. (A) Spatial mapping and replication of the cross-trait signal. Left, gsMap projection of the PLACO-derived signed-Z statistic onto the primary CRC Visium HD section; colour denotes spatial LDSC Z for bins with BH FDR < 0.05. Middle, regional enrichment across source-defined clusters; point position shows mean spatial LDSC Z, colour indicates broad cell class, and point size indicates the proportion of FDR-significant bins. Epithelial-rich C5 showed the highest regional enrichment. Right, tumor and intestinal-epithelial enrichment across three independent CRC Visium HD sections (P1CRC, P2CRC and P5CRC) and the combined Cauchy result. Tumor enrichment ranked highest across the replication sections, with reproducible intestinal-epithelial enrichment. (B) ENCODE/SCREEN regulatory annotation of highlighted variants at 5p15.33 and 20q13.33 in GRCh37/hg19 coordinates. Black diamonds denote highlighted variants; coloured boxes denote candidate cis-regulatory element classes. At 5p15.33, rs7725218 directly overlaps a distal enhancer-like cCRE, rs2736100 is 174 bp from the nearest chromatin-accessible cCRE, and rs2853672 is 90 bp from the nearest proximal enhancer-like cCRE. At 20q13.33, rs35640778 directly overlaps a distal enhancer-like cCRE. (C) TCGA-COAD/READ tumor-expression context for the 12q24.33 PIWIL1 module, the 5p15.33 module (four retained genes), the 20q13.33 module (six retained genes), and the expanded candidate module (22 retained genes). Points represent individual specimens; module scores are means of standardized gene-level expression values for normal colon (n = 51), COAD tumor (n = 481), and READ tumor (n = 166). The 12q24.33 and 20q13.33 modules showed higher expression in tumors, whereas the 5p15.33 module showed a tumor-lower pattern. Sample-level comparisons were interpreted descriptively because some patients contributed multiple specimens. CRC, colorectal cancer; gsMap, spatial mapping of cells for complex traits; cCRE, candidate cis-regulatory element; dELS, distal enhancer-like signature; pELS, proximal enhancer-like signature; CA, chromatin-accessible; TCGA, The Cancer Genome Atlas; COAD, colon adenocarcinoma; READ, rectum adenocarcinoma.
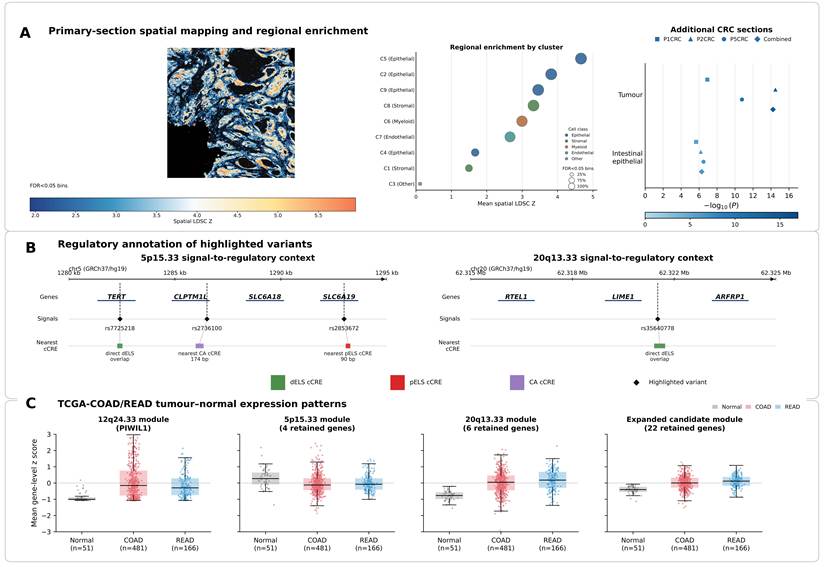
Candidate-gene expression across Azimuth cell classes, together with Human Protein Atlas single-cell colon data, provided complementary tumor and normal-colon cell-context information (Table S14). ENCODE/SCREEN annotation of highlighted variants identified a direct distal enhancer-like cCRE overlap for rs7725218 at 5p15.33, whereas rs2736100 and rs2853672 were nearest to chromatin-accessible and proximal enhancer-like cCREs, respectively; at 20q13.33, rs35640778 directly overlapped a distal enhancer-like cCRE (Fig. 4B; Table S15). TCGA-COAD/READ analyses showed locus-specific tumor-expression patterns: the 12q24.33 and 20q13.33 candidate modules were higher in tumors, whereas the 5p15.33 module was lower. The 20q13.33 pattern remained evident in a COAD-only sensitivity analysis (Fig. 4C; Tables S16-18).
Discussion
Using an integrative cross-trait framework, we characterized how inherited telomere-maintenance architecture, indexed by LTL genetics, overlaps with colon cancer susceptibility. We found modest genome-wide genetic sharing that was highly regional: SUPERGNOVA detected three FDR-significant local covariance regions, and PLACO prioritized 189 cross-trait SNPs across 18 genomic loci. The principal loci showed heterogeneous signal architectures: the strongest PLACO association mapped to 5p15.33, where subsequent signal-resolution analyses supported distinct association components for LTL and colon cancer; 12q24.33 showed the clearest moderate-to-high shared single-signal evidence (PP.H4 = 0.757); and 20q13.33 remained a pleiotropic locus with limited shared-signal evidence. These locus-specific differences suggest that the LTL-colon cancer relationship cannot be reduced to a single shared genetic mechanism. Multi-layer biological-context analyses further provided context involving broad but non-uniform CRC spatial enrichment, tumor-expression patterns and pathways involving telomere maintenance, DNA repair, proliferation and immune regulation.
At 5p15.33, the strongest pleiotropic association and gene-prioritization analyses placed TERT at the centre of the regional interpretation, with SLC6A18 providing important secondary support. Signal-resolution analyses nevertheless favored distinct association components, indicating that the relevance of this locus to both traits does not require a single shared causal variant. The 5p15.33 region, containing TERT and CLPTM1L, is one of the most widely recognized cross-cancer susceptibility regions [36]. Recent experimental studies have shown that VNTR6-1 and rs10069690 regulate TERT splicing and nonsense-mediated decay, altering the balance between full-length and truncated TERT transcripts [37]. This splicing-mediated regulation may fine-tune telomerase activity and cellular replicative potential, with directionally distinct effects across cancer types [37]. Evidence specific to colon cancer remains limited. A cross-cancer meta-analysis found no significant overall association between TERT rs10069690 and colorectal cancer but noted a previously reported BMI-stratified association with colon cancer risk [38]. Another European study reported that rs2736100 in TERT intron 2 was significantly associated with colorectal cancer, suggesting a potential contribution of 5p15.33 to colorectal cancer susceptibility [39]. Multiple association signals in this broader region therefore remain compatible with candidate regulatory elements affecting TERT expression and downstream pathways. In TCGA tumor data, TERT and CLPTM1L showed moderate expression in colon tumors [35], with GTEx providing complementary normal-tissue context [28], consistent with context-dependent tumor-expression regulation. Together, these observations make telomere-maintenance biology a plausible framework for interpreting 5p15.33, while allowing different regulatory components to contribute to LTL and colon-cancer susceptibility.
The 12q24.33 locus provided the clearest moderate-to-high shared single-signal evidence (PP.H4 = 0.757) and showed the strongest independent European disease-side support among the principal loci. PIWIL1 was the leading candidate within the mapped locus, supported by positional mapping, PoPS prioritization and MAGMA evidence. The broader 12q region includes genome-maintenance genes such as POLE, germline alterations of which predispose to colorectal neoplasia [40]. POLE provides broader regional genome-stability context rather than being directly nominated by the 12q24.33 signal. This broader biology is compatible with a non-canonical route through which LTL-related inherited variation could intersect with colon cancer susceptibility, potentially in the context of genome-stability or immune-regulatory processes rather than direct telomerase control. Further regulatory and expression analyses of rs4759453 and linked elements are needed to establish the effector gene and molecular consequence at this locus.
At 20q13.33, signal-resolution analyses did not establish robust support for a shared single association signal. ZBTB46 was the leading locus-centric candidate, whereas ARFRP1 showed particularly strong LTL-oriented transcriptome-linked support; RTEL1 remains biologically relevant given its established roles in telomere stability and homologous recombination [41,42]. The 20q13.33 candidate module was higher in colon tumors than in normal tissue, with RTEL1, LIME1 and ARFRP1 contributing to this pattern; the result remained in a COAD-only sensitivity analysis, indicating that it was not solely driven by READ samples. These expression findings place the region in tumor transcriptional contexts involving cell-cycle and DNA-repair processes [35,41,42]. Previous cross-cancer studies also support pleiotropic roles for the RTEL1 region, although these observations require disease-specific interpretation [43]. The partly different genes highlighted by locus-based and transcriptome-linked evidence are consistent with a pleiotropic region in which the two traits may engage different regulatory components. Across these loci, the differing evidence profiles highlight the value of integrative prioritization rather than reliance on any single annotation layer. Recent colorectal studies illustrate how such integration can be extended. Xu et al. extended transcriptomic candidate prioritization to gene perturbation and downstream transcriptional profiling, providing functional evidence for PFDN6 in CRC [44]. In colorectal neoplasia, paired polyp-normal profiling of host RNA, microRNA and the mucosal DNA/RNA virome demonstrated how coordinated molecular layers can reveal cross-domain relationships within the same biological samples [45]. Our framework shares this integrative principle, but applies it along an inherited-genetic axis: cross-trait loci were progressively evaluated through locus-to-gene mapping, gene-level association and gene prioritization informed by broader polygenic evidence, followed by multiple-testing-corrected expression-linked evidence and biological contextualization across tissue, regulatory, tumor-expression and spatial layers. This breadth strengthens candidate prioritization and biological interpretation, but, unlike perturbational or matched-sample multi-omic designs, does not by itself establish an effector gene or molecular mechanism.
S-LDSC showed LTL heritability enrichment in spleen, while MAGMA tissue-property analysis highlighted EBV-transformed lymphocytes; colon annotations were not significantly enriched. This pattern is consistent with a systemic telomere and immune component rather than a strictly colon-restricted genetic model, in line with cross-cancer polygenic analyses that have highlighted pleiotropic inflammatory and haematopoietic loci [46]. Spatial mapping showed broad but non-uniform enrichment, with the strongest region in an epithelial-rich compartment; tumor and intestinal-epithelial annotations were reproducibly enriched across three CRC sections, alongside other tumor-microenvironment compartments. Regulatory annotation further placed highlighted 5p15.33 and 20q13.33 variants within or near candidate cis-regulatory elements, while TCGA analyses showed distinct tumor-expression patterns across the 5p15.33, 12q24.33 and 20q13.33 candidate modules. Together, these analyses provide complementary tissue, spatial, regulatory and transcriptional context for the genetically prioritized loci.
Existing evidence on LTL and colorectal cancer remains mixed. Observational and meta-analytic evidence has not shown a consistent association with colorectal cancer risk [47], whereas previous Mendelian randomization analysis suggested that genetically influenced telomere length may contribute to cancer susceptibility [7]. Colorectal neoplasia arises within a broader interplay of inherited susceptibility, lifestyle and environmental exposures, microbiota and molecular states, as illustrated by complementary lifestyle- and microbiota-based adenoma models [48]. Against this multifactorial background, in line with methodological cautions regarding causal inference [49,50], the present study focuses on inherited genetic sharing rather than a directional causal effect of LTL on colon cancer; the pleiotropic and colocalized loci are therefore best viewed as candidates for mechanistic follow-up.
Limitations
This study should be interpreted in light of several limitations. First, the analyses were based on GWAS summary statistics, which limited direct evaluation of individual-level covariates, sample overlap and non-linear effects. The cross-trait framework characterized inherited genetic sharing and does not estimate a directional causal effect of LTL on colon cancer. Second, fine-mapping and colocalization analyses relied on European LD resources, making signal-level inference dependent on LD quality and ancestry matching. Because the discovery and most validation datasets were predominantly European, the transferability of the observed locus architecture to other ancestries remains uncertain. Third, candidate-gene prioritization provides statistical and contextual support but does not establish causal variants, effector genes or molecular mechanisms. Finally, spatial, regulatory and tumor-expression analyses provide biological context rather than functional validation. Further genetic and experimental studies are needed to clarify the functional relevance of the prioritized loci.
Conclusion
In summary, LTL and colon cancer share modest polygenic architecture that resolves into heterogeneous locus-specific signals. Among the principal loci, 12q24.33 showed the strongest moderate-to-high shared single-signal evidence and the clearest European disease-side support, whereas 5p15.33 favored distinct regional signals and 20q13.33 showed limited shared-signal support, with external support more limited at 20q13.33. TERT, PIWIL1 and ZBTB46 are the lead prioritized candidates, with SLC6A18 and ARFRP1 providing important secondary evidence. Spatial and other biological-context analyses further provided complementary context involving epithelial-rich tumor regions and processes related to telomere maintenance, genome stability and tumor regulation. Together, these findings provide a focused basis for locus-specific genetic and functional investigation.
Abbreviations
cCRE: candidate cis-regulatory element; COAD: colon adenocarcinoma; coloc: colocalization analysis; eQTL: expression quantitative trait locus; ENCODE: Encyclopedia of DNA Elements; FDR: false discovery rate; FUMA: Functional Mapping and Annotation; FUSION: transcriptome-wide association study framework; gsMap: spatial mapping of cells for complex traits; GTEx: Genotype-Tissue Expression; HDL: high-definition likelihood; HEIDI: heterogeneity in dependent instruments; LD: linkage disequilibrium; LDSC: linkage disequilibrium score regression; LTL: leukocyte telomere length; MAF: minor allele frequency; MAGMA: Multi-marker Analysis of GenoMic Annotation; MHC: major histocompatibility complex; MiXeR: bivariate causal mixture model framework; PLACO: pleiotropic analysis under composite null hypothesis; PoPS: Polygenic Priority Score; READ: rectum adenocarcinoma; SCREEN: Search Candidate cis-Regulatory Elements by ENCODE; S-LDSC: stratified linkage disequilibrium score regression; SMR: summary-based Mendelian randomization; S-MultiXcan: Summary-MultiXcan; SNP: single nucleotide polymorphism; SNP2GENE: SNP-to-gene mapping module in FUMA; S-PrediXcan: Summary-PrediXcan; SUPERGNOVA: local genetic covariance analysis framework; SuSiE: Sum of Single Effects; SuSiE-RSS: SuSiE regression with summary statistics; TCGA: The Cancer Genome Atlas; TWAS: transcriptome-wide association study; UKB: UK Biobank; VEP: Variant Effect Predictor.
Supplementary Material
Supplementary tables.

Acknowledgements
We thank the FinnGen study and the IEU OpenGWAS resource for providing access to publicly available GWAS summary statistics. We acknowledge the contributions of the original investigators and the participants whose efforts made these resources possible.
Funding
This study was supported by the Foundation of the Jiangxi Provincial Department of Science and Technology (Grant No. 20252BAC240418; PI: Chunyan Zeng), the Jiangxi Provincial Health Commission Science and Technology Innovation Joint Project (Grant No. 2026L1005; PI: Chunyan Zeng), and the Nanchang Scientific Technology and Health Plan Project (Grant No.2025YLWS0001, PI: Chunyan Zeng).
Contributions
AJ: Conceptualization, investigation, data curation, writing - original draft, visualization.
WX: Conceptualization, methodology, formal analysis, data curation, writing - original draft.
YJ: Investigation, data curation, validation, writing - review and editing.
WL: Investigation, data curation, validation, writing - review and editing.
YW: Investigation, validation, writing - review and editing.
LX: Supervision, interpretation of the revised analyses and findings, writing - review and editing.
CZ: Supervision, funding acquisition, writing - review and editing, project administration.
All authors contributed to the article and approved the final version of the manuscript.
Data availability
The primary GWAS summary statistics used for discovery are publicly available. LTL summary statistics were obtained from IEU OpenGWAS entry ieu-b-4879, and colon-cancer summary statistics from FinnGen Release 12 endpoint C3_COLON_EXALLC. External European evaluation used GCST012879, PLCO and AoU-only All of Us resources, while exploratory cross-ancestry transferability analyses used available BBJ, SCHS and TPMI summary-level resources, under their respective access conditions. Public reference resources included 1000 Genomes Phase 3 European and Pan-UK Biobank LD resources, GTEx v8, FUMA/MAGMA, ENCODE/SCREEN, Ensembl REST/VEP, TCGA-COAD/READ, the primary 10x Genomics Visium HD colon-cancer dataset and three independent CRC sections from GSE280315. This study did not generate new individual-level participant data.
Code availability
Analysis scripts and compact processed outputs can be made available from the corresponding authors upon reasonable request, subject to the access terms of the original GWAS and reference resources.
Competing Interests
The authors have declared that no competing interest exists.
References
1. de Lange T. Shelterin: the protein complex that shapes and safeguards human telomeres. Genes Dev. 2005;19:2100-10
2. McNally EJ, Luncsford PJ, Armanios M. Long telomeres and cancer risk: the price of cellular immortality. J Clin Invest. 2019;129:3474-81
3. Codd V, Wang Q, Allara E, Musicha C, Kaptoge S, Stoma S. et al. Polygenic basis and biomedical consequences of telomere length variation. Nat Genet. 2021;53:1425-33
4. Maciejowski J, de Lange T. Telomeres in cancer: tumour suppression and genome instability. Nat Rev Mol Cell Biol. 2017;18:175-86
5. Jafri MA, Ansari SA, Alqahtani MH, Shay JW. Roles of telomeres and telomerase in cancer, and advances in telomerase-targeted therapies. Genome Med. 2016;8:69
6. Dekker E, Tanis PJ, Vleugels JLA, Kasi PM, Wallace MB. Colorectal cancer. Lancet. 2019;394:1467-80
7. Haycock PC, Burgess S, Nounu A, Zheng J, Okoli GN, Bowden J. et al. Association between telomere length and risk of cancer and non-neoplastic diseases: a Mendelian randomization study. JAMA Oncol. 2017;3:636-51
8. Ruan X, Che T, Chen X, Sun Y, Fu T, Yuan S. et al. Mendelian randomisation analysis for intestinal disease: achievement and future. eGastroenterology. 2024;2:e100058
9. Huyghe JR, Bien SA, Harrison TA, Kang HM, Chen S, Schmit SL. et al. Discovery of common and rare genetic risk variants for colorectal cancer. Nat Genet. 2019;51:76-87
10. Fernandez-Rozadilla C, Timofeeva M, Chen Z, Law P, Thomas M, Schmit SL. et al. Deciphering colorectal cancer genetics through multi-omic analysis of 100,204 cases and 154,587 controls of European and east Asian ancestries. Nat Genet. 2023;55:89-99
11. Elsworth B, Lyon M, Alexander T, Liu Y, Matthews P, Hallett J. et al. The MRC IEU OpenGWAS data infrastructure. bioRxiv. 2020 doi:10.1101/2020.08.10.244293
12. Kurki MI, Karjalainen J, Palta P, Sipila TP, Kristiansson K, Donner KM. et al. FinnGen provides genetic insights from a well-phenotyped isolated population. Nature. 2023;613:508-18
13. Bulik-Sullivan BK, Loh PR, Finucane HK, Ripke S, Yang J, Patterson N. et al. LD Score regression distinguishes confounding from polygenicity in genome-wide association studies. Nat Genet. 2015;47:291-5
14. Bulik-Sullivan B, Finucane HK, Anttila V, Gusev A, Day FR, Loh PR. et al. An atlas of genetic correlations across human diseases and traits. Nat Genet. 2015;47:1236-41
15. Ning Z, Pawitan Y, Shen X. High-definition likelihood inference of genetic correlations across human complex traits. Nat Genet. 2020;52:859-64
16. Frei O, Holland D, Smeland OB, Shadrin AA, Fan CC, Maeland S. et al. Bivariate causal mixture model quantifies polygenic overlap between complex traits beyond genetic correlation. Nat Commun. 2019;10:2417
17. 1000 Genomes Project Consortium. et al. A global reference for human genetic variation. Nature. 2015;526:68-74
18. Zhang Y, Lu Q, Ye Y, Huang K, Liu W, Wu Y. et al. SUPERGNOVA: local genetic correlation analysis reveals heterogeneous etiologic sharing of complex traits. Genome Biol. 2021;22:262
19. Ray D, Chatterjee N. A powerful method for pleiotropic analysis under composite null hypothesis identifies novel shared loci between type 2 diabetes and prostate cancer. PLoS Genet. 2020;16:e1009218
20. Watanabe K, Taskesen E, van Bochoven A, Posthuma D. Functional mapping and annotation of genetic associations with FUMA. Nat Commun. 2017;8:1826
21. de Leeuw CA, Mooij JM, Heskes T, Posthuma D. MAGMA: generalized gene-set analysis of GWAS data. PLoS Comput Biol. 2015;11:e1004219
22. Giambartolomei C, Vukcevic D, Schadt EE, Franke L, Hingorani AD, Wallace C. et al. Bayesian test for colocalisation between pairs of genetic association studies using summary statistics. PLoS Genet. 2014;10:e1004383
23. Wang G, Sarkar A, Carbonetto P, Stephens M. A simple new approach to variable selection in regression, with application to genetic fine mapping. J R Stat Soc Series B Stat Methodol. 2020;82:1273-1300
24. Zou Y, Carbonetto P, Wang G, Stephens M. Fine-mapping from summary data with the Sum of Single Effects model. PLoS Genet. 2022;18:e1010299
25. Zhu Z, Zhang F, Hu H, Bakshi A, Robinson MR, Powell JE. et al. Integration of summary data from GWAS and eQTL studies predicts complex trait gene targets. Nat Genet. 2016;48:481-7
26. Barbeira AN, Dickinson SP, Bonazzola R, Zheng J, Wheeler HE, Torres JM. et al. Exploring the phenotypic consequences of tissue-specific gene expression variation inferred from GWAS summary statistics. Nat Commun. 2018;9:1825
27. Barbeira AN, Pividori M, Zheng J, Wheeler HE, Nicolae DL, Im HK. Integrating predicted transcriptome from multiple tissues improves association detection. PLoS Genet. 2019;15:e1007889
28. GTEx Consortium. The GTEx Consortium atlas of genetic regulatory effects across human tissues. Science. 2020;369:1318-30
29. Gusev A, Ko A, Shi H, Bhatia G, Chung W, Penninx BWJH. et al. Integrative approaches for large-scale transcriptome-wide association studies. Nat Genet. 2016;48:245-52
30. Weeks EM, Ulirsch JC, Cheng NY, Trippe BL, Fine RS, Miao J. et al. Leveraging polygenic enrichments of gene features to predict genes underlying complex traits and diseases. Nat Genet. 2023;55:1267-76
31. Finucane HK, Reshef YA, Anttila V, Slowikowski K, Gusev A, Byrnes A. et al. Heritability enrichment of specifically expressed genes identifies disease-relevant tissues and cell types. Nat Genet. 2018;50:621-9
32. Song L, Chen W, Hou J, Guo M, Yang J. Spatially resolved mapping of cells associated with human complex traits. Nature. 2025;641:932-41
33. Karlsson M, Zhang C, Méar L, Zhong W, Digre A, Katona B. et al. A single-cell type transcriptomics map of human tissues. Sci Adv. 2021;7:eabh2169
34. Moore JE, Pratt HE, Fan K, Phalke N, Fisher J, Elhajjajy SI. et al. An expanded registry of candidate cis-regulatory elements. Nature. 2026 [Epub ahead of print]. doi:10.1038/s41586-025-09909-9
35. Cancer Genome Atlas Network. Comprehensive molecular characterization of human colon and rectal cancer. Nature. 2012;487:330-7
36. Chen H, Majumdar A, Wang L, Kar SP, Brown KM, Feng H. et al. Large-scale cross-cancer fine-mapping of the 5p15.33 region reveals multiple independent signals. HGG Adv. 2021;2:100041
37. Florez-Vargas O, Ho M, Hogshead MH, Papenberg BW, Lee CH, Forsythe K. et al. Genetic regulation of TERT splicing affects cancer risk by altering cellular longevity and replicative potential. Nat Commun. 2025;16:1676
38. Zhou C, Yang Y, Shen L, Wang L, Zhang J, Wu X. Association of telomerase reverse transcriptase gene rs10069690 variant with cancer risk: an updated meta-analysis. BMC Cancer. 2024;24:1059
39. Kinnersley B, Migliorini G, Broderick P, Whiffin N, Dobbins SE, Casey G. et al. The TERT variant rs2736100 is associated with colorectal cancer risk. Br J Cancer. 2012;107:1001-8
40. Palles C, Cazier JB, Howarth KM, Domingo E, Jones AM, Broderick P. et al. Germline mutations affecting the proofreading domains of POLE and POLD1 predispose to colorectal adenomas and carcinomas. Nat Genet. 2013;45:136-44
41. Uringa EJ, Youds JL, Lisaingo K, Lansdorp PM, Boulton SJ. RTEL1: an essential helicase for telomere maintenance and the regulation of homologous recombination. Nucleic Acids Res. 2011;39:1647-55
42. Sarek G, Vannier JB, Panier S, Petrini JHJ, Boulton SJ. TRF2 recruits RTEL1 to telomeres in S phase to promote t-loop unwinding. Mol Cell. 2015;57:622-35
43. Wrensch M, Jenkins RB, Chang JS, Yeh RF, Xiao Y, Decker PA. et al. Variants in the CDKN2B and RTEL1 regions are associated with high-grade glioma susceptibility. Nat Genet. 2009;41:905-8
44. Xu F, Kong L, Sun X, Hui W, Jiang L, Han W. et al. PFDN6 contributes to colorectal cancer progression via transcriptional regulation. eGastroenterology. 2024;2:e100001
45. So SHS, Jiang W, Li Y, Hold GL, Goodrick K, Min A. et al. Mucosal DNA and RNA virome alterations and their interactions with human RNA and microRNA transcriptomes in colorectal polyps. eGastroenterology. 2025;3:e100194
46. Graff RE, Cavazos TB, Thai KK, Kachuri L, Rashkin SR, Hoffman JD. et al. Cross-cancer evaluation of polygenic risk scores for 16 cancer types in two large cohorts. Nat Commun. 2021;12:970
47. Pauleck S, Sinnott JA, Zheng YL, Gadalla SM, Viskochil R, Haaland B. et al. Association of telomere length with colorectal cancer risk and prognosis: a systematic review and meta-analysis. Cancers (Basel). 2023;15:1159
48. Zhou YL, Deng JW, Liu ZH, Ma XY, Zhu CQ, Xie YH. et al. Derivation and validation of lifestyle-based and microbiota-based models for colorectal adenoma risk evaluation and self-prediction. BMJ Open Gastroenterol. 2025;12:e001597
49. Chen L, Guillot A, Schneider CV. Attention to the misuse of Mendelian randomisation in medical research. eGastroenterology. 2025;3:e100187
50. Chen L, Rao Q, Gao M, Lv G, Tacke F. Prospects of Mendelian randomization in hepatology: a comprehensive literature review with practice guidance. Clin Mol Hepatol. 2025;31:1115-38
Author contact
Corresponding authors: Dr. Chunyan Zeng, Department of Gastroenterology, Jiangxi Province Hospital of Integrated Chinese and Western Medicine, 90 Bayi Road, Xihu, Nanchang, Jiangxi, China. Email: zengchunyan2024com. Prof. Longxin Xiong, Department of General Surgery, Central Hospital of Nanchang City, Nanchang 330008, Jiangxi Province, China. Email: 2363915097com.