Impact Factor ISSN: 1837-9664

 Global reach, higher impact
J Cancer 2015; 6(1):54-65. doi:10.7150/jca.10631 This issue Cite
Review
Pathway and Network Approaches for Identification of Cancer Signature Markers from Omics Data
Jinlian Wang1,7, Yiming Zuo1,6, Yan-gao Man2, Itzhak Avital2, Alexander Stojadinovic2,3, Meng Liu4, Xiaowei Yang4, Rency S. Varghese1, Mahlet G Tadesse5, Habtom W Ressom1 ![]()
1. Lombardi Comprehensive Cancer Center, Georgetown University, Washington, DC, USA;
2. Bon Secours Cancer Institute, Richmond VA, USA;
3. Division of Surgical Oncology, Walter Reed National Military Medical Center, Bethesda, MD, USA;
4. Department of Public Health School of Hunter College, City University of New York, NYC, USA;
5. Department of Mathematics and Statistics, Georgetown University, Washington DC, USA;
6. Department of Electrical and Computer Engineering, Virginia Polytechnic Institute and State University, Arlington, VA, USA;
7. Genetics and Genomics Science, Icahn School of Medicine at Mount Sinai, New York, NY, USA.
Received 2014-9-24; Accepted 2014-11-14; Published 2015-1-1
Abstract
The advancement of high throughput omic technologies during the past few years has made it possible to perform many complex assays in a much shorter time than the traditional approaches. The rapid accumulation and wide availability of omic data generated by these technologies offer great opportunities to unravel disease mechanisms, but also presents significant challenges to extract knowledge from such massive data and to evaluate the findings. To address these challenges, a number of pathway and network based approaches have been introduced. This review article evaluates these methods and discusses their application in cancer biomarker discovery using hepatocellular carcinoma (HCC) as an example.
Keywords: Biological pathways, system biology, high-throughput omics data, cancer biomarker.
Introduction
A better understanding of disease associated with biomarkers could potentially start a new area for uncovering the mechanism of cancer progression, development and offer better targets for drug development [1]. Studies on single gene/protein/metabolite molecular signatures offer limited insight into the complex interplay among the molecules responsible for progression of complex diseases such as cancer. Thus, there is a shift toward the identification of a panel of genes that interact directly or indirectly in the form of pathway or complex network to evaluate their association to cancer [2,3]. This is accomplished through massive data derived by high throughput omic technologies such as next generation sequencing, microarray, and mass spectrometry. Although thousands of candidate biomarkers have been discovered by these technologies, few of them have been transferred into practical application in clinical setting and new drug production. The challenges lie in (1) high false positive rate of the candidate biomarkers identified from omics data; (2) Lack of attention on the study of the context of biomarkers who are interacting each other in the form of pathway or network associated with cancer; (3) Fragmental and incomplete information based on biomarkers identified from solely omics platform; (4) Lack of effective algorithms that allow integration of diverse omics data sources to simulate the biological pathway and networks. To meet these challenges, a number of pathway and network based approaches have been introduced. This review article evaluates the advantages and limitations of these methods.
The traditional approaches that individual and a panel of cancer biomarkers are selected by analytic methods such as analysis of variance (ANOVA), Lasso, pairwise, information theory and support vector machine (SVM) do not explicitly consider interaction between genes, proteins and metabolites. Compared to traditional methods, pathway and network centric methods naturally provide a way to understand the underlying pathways and the interactions between individual signature markers and non-markers. With the large-scale generation and integration of genomic, transcriptomic, proteomic, and metabolomic data, pathway/network-based methods provide a more effective and accurate means for cancer biomarker discovery. Increasingly, pathway and network-based analyses are applied to omics data to gain more insight into the underlying biological function and processes, such as cell signaling and metabolic pathways as well as gene regulatory networks [4-6]. A number of pathway /network approaches have also been used for improving the prediction of cancer outcome, providing novel hypotheses for pathways involved tumor progression [7], and exploring cancer associated biomarkers [8]. For example, Taylor et al. [9] combined gene expression data with physical protein-protein interaction data to identify subnetwork markers for the prognosis of breast cancer and lymphoma patients. Torkamani and Schork [10] used gene co-expression network to infer cancer-initiating genes in breast, colorectal cancer, and glioblastoma. Kim et al. applied the MAPIT (Multi Analyte Pathway Inference Tool) algorithm to identify prognostic network markers to predict GBM patient survival time using multi-analyte network markers discovered by integrating gene expression profile, epigenomic profile, and protein-protein interactome [11]. Goh et al. [12] built a human disease network (HDN) by linking hereditary disease that share a disease-causing gene recorded in Mendelian Inheritance in Man (OMIM) database. Although the functional connections in the HDN remain to be further demonstrated, it inspires us to systematically study the relationships among diseases by constructing a network. More detailed descriptions of relationships between human disease and network essential for understanding of human have been recently summarized in reviews [2, 12-14].
In this review, we provide some pathway and network centric computational approaches and their applications for biomarker discovery.
Summary of pathways and networks centric approaches for cancer biomarker discovery
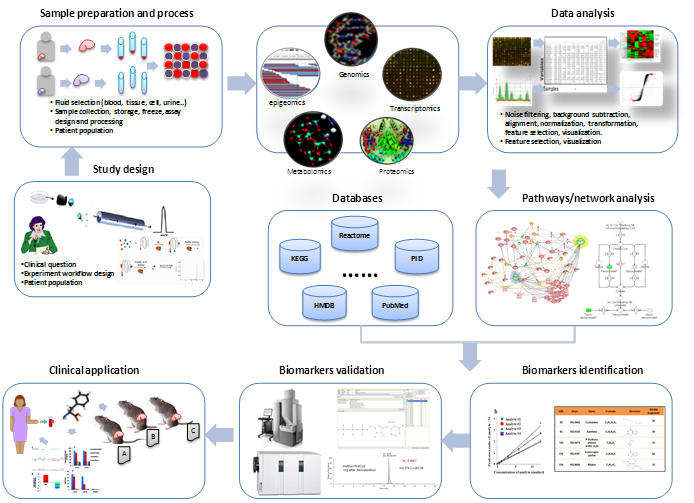
Availability of biomedical pathways and networks based on large-scale data gathering through diverse omics data sources offers new opportunities to explain the causality of relationships between biological entities and cancers [15]. As shown in Figure 1, the general steps of the biomarker discovery include the following: 1) Define precisely a well-framed, relevant clinical problem and focus the experimental design around appropriate study populations and samples; 2) Collect tissue samples or fluids from patients and suitable assays; 3) Acquire high-throughput data from the omics technologies; 4) Analyze the data using signal processing, statistical and machine learning methods to select relevant features from the data; 5) Integrate the pathway/network knowledge from databases such as KEGG, HMDB and Reatcome mapping candidate biomarkers to the corresponding pathways or networks; 6) Evaluate biomarkers to estimate their diagnostic or prognostic capability and clinical validity using alternative technologies such as Westen blot, ELSA, and RT-PCR. In computational aspect, cross-validation and independent validation are the commonly used methods to evaluate the performance of a biomarkers. P-values, sensitivity, specificity and the area under receiver operating curves (AUC) are used as quantitative indicators of the performance of the methods [16]; 7) Use the biomarkers for clinical applications after reliable pre-clinical tests and validation of the markers in a large population.
The pipeline of pathway/networks centric approach for cancer biomarker discovery. A variety of computational tools and algorithms have been proposed for biomarker discovery based on pathway and network methods. The most commonly used methods are categorized roughly into statistical [17], graph theory [18], Bayesian methods [19], text mining [20], machine learning [21-23] and integrative methods summarized in Table 1.
Statistics methods
Statistical methods test scientific theories when observations, processes or boundary conditions are subject to stochasticity. For examples, the classical t-test has been extensively used for testing differential gene expression in microarray data [35]. However, this kind of procedure relies on reasonable estimates of reproducibility or within-gene error, requiring a large number of replicated arrays. Thus, several methods for improving estimates of variability and statistical tests of differential expression have been proposed. For example, Significance Analysis of Microarrays (SAM) aimed to improve the unstable error estimation in the two-sample t-test by adding a variance stabilization factor which minimizes the variance variability across different intensity ranges [36, 37]. ANOVA model approach is widely used in multiple kinds of omic data. For example, it was used to model microarray data with the effects of array, condition, and condition-array interaction and then to fit the residuals with the effects of gene, gene-condition interaction, and gene-array interaction [38,39]. Also, it was applied to capture the effects of controlled groups, batches, condition, alias of experimental equipment, and condition-metabolite interaction separately on LC-MS data [40]. To improve the accuracy and sensitivity of analytic results, false discovery rate (FDR) [41] and its refinement, q-value, (q-value package, www.bioconductor.org) have been rapidly adopted for genomic, proteomics and metabolic data analysis including the widely-used SAM, DAVID [42] and other approaches [36]. Another statistics method for biomarker discovery is linear discriminant analysis (LDA), one of the classical statistical classification techniques based on the multivariate normal distribution assumption, is quite robust and powerful to discover biomarker or pathways between omics data for many different applications despite the distributional assumption. Compared to LDA, quadratic discriminant analysis (QDA) requires more observations to estimate each variance-covariance matrix for each class [43]. In addition, logistic regression analysis has been successfully used to evaluate biomarker performance of prostate cancer with mRNA profiling [44]. Logistic regression (LR) model based on the regression fit on probabilistic odds between comparing conditions requires no specific distribution assumption (e.g. Gaussian distribution) but is often found to be less sensitive than other approaches[42,43].
Graph theory based network and visualization
The modeling fundamentals of graph theory are often used to describe the global topology, structure or the community of a complex system. It emphasizes on entities (e.g, genes, proteins, diseases, biological process) and the relations between them. The complexity of graphical modeling can be either simple only with nodes and edges or more complex where edges have weights, and nodes and edges can be of different types. Recent publications have applied graphical modeling in computational biology to study biological networks, enhance the ability to draw causal inferences from functional MRI experiments, support the early detection of disconnection and the modeling of pathology spread in neurodegenerative disease such as Alzheimer's disease [45-49]. For example, in mammalian cells, Bleris et al. have had early success in characterizing the dynamics of key feed forward modules and motifs, helping to enable the circuit design of adaptive gene expression [50]. Using graph based approaches, Ma'ayan et al. model cellular machinery including genes, proteins and other subcellular compartments [51], in which the interactions between components are drawn as edge connections between the relevant nodes [51]. Gene expression data combined with network analysis can yield important information on how expression variation relates to differences between observed states [52]. As closely connected genes tend to be involved in similar functions, network annotation can complement clusters obtained via fold change analysis [7]. A standard systems-based approach to biomarker and drug target discovery consists of placing putative or known biomarkers in the context of a network of biological interactions, followed by different 'guilt-by-association' analyses [53].
Computational methods for biomarker discovery categorized by their application, examplary tools and URLs.
| Approaches | Technique & Application Examples | Exemplary Tools &URL |
|---|---|---|
| Statistical analysis | Hypothesis testing, random sampling. ANOVA. Detection of differentially expressed genes/proteins, genotypes, biomarker filtering/selection[24] | BRB:http://linus.nci.nih.gov/BRB-ArrayTools.html PAM: http://www-stat.stanford.edu/~tibs/PAM/ SAM: http://www-stat.stanford.edu/~tibs/SAM/ |
| Pattern recognition | Machine learning, Probabilistic, instance-based, kernel classification models. Clustering, multi-source data classification, biomarker selection and associations [25] Bayesian regression models [26], partial least squares [27], and Genetic Algorithm/KNN [28]. | Weka: http://weka.wikispaces.com/ LIBSVM: http://www.csie.ntu.edu.tw/~cjlin/libsvm/ PRTools: http://prtools.org/ R package: http://cran.r-project.org/web/views/Bayesian.html |
| Graph/network theory | Network topology analysis, network visualization and data integration, clustering. Genetic, regulatory, protein-protein, signaling network analysis, biomarker/target identification [29] | BioNet[4] :http://www.fda.gov/ScienceResearch/BioinformaticsTools/ucm285284.htm Jung: http://jung.sourceforge.net/ http://bioinfo.mc.vanderbilt.edu/dmGWAS.html [30] |
| Data visualization and imaging | Sequence and cluster visualization, interactive visualization, statistical analysis graphs. Data exploration, biomarker visualization, model explanation, in vivo/in vitro imaging of molecules and cells [29] | Cytoscape [31]: http://www.biotapestry.org/ Medusa: http://coot.embl.de/medusa/ Graphviz: http://www.graphviz.org/ Osprey:http://biodata.mshri.on.ca/osprey/servlet/Index Pajek: http://vlado.fmf.uni-lj.si/pub/networks/pajek/ 3Omics: http://3omics.cmdm.tw |
| Natural language processing and information retrieval | Ontologies, text mining, information representation standards, information retrieval and extraction. Inference of functional associations from publications, automated annotation and characterization [32,33] | iHOP: http://www.ihop-net.org/UniPub/iHOP CoPub: http://services.nbic.nl/copub/portal PolySearch: http://wishart.biology.ualberta.ca/polysearch/ index.htm Open Biomedical Annotator: http://bioportal.bioontology. org/annotator GeneSeeker: http://www.cmbi.ru.nl/GeneSeeker/ |
| Software development, Internet technologies | Data warehouses and distributed information systems, semantic Web tools, information retrieval, extraction and curation. Biomarker discovery and validation platforms, data mining tools, search and reasoning engines [34] | IPA:http://www.ingenuity.com/products/pathways_analysis.htm GO: http://www.geneontology.org/GO.tools.shtml MiMI: http://mimi.ncibi.org/MimiWeb/main-page.jsp |
The goal of visualization is to find patterns and structures that remain hidden in the raw unstructured datasets. Graph visualization is key to display directly the various relationships between entities (e.g., genes, proteins). Challenges of graph visualization lie in 1) the high false positive rate of incorporating heterogeneous multi-omic datasets; 2) Visual representation of the logical structure transformed from the raw data; 3) Graph manipulation and layout algorithm for representing the complicated relationships between biological entities. 4) Heterogeneous omic data from different level visualization needs more flexibility for layered representation. A number of commercial and free sourced graph visualization tools and platforms have been extensively developed. For example, Cytoscape [31], one of the free open source platforms providing biological network analysis and visualization with more than 172 registered plugins contributed by the community, is very versatile in network applications, such as network importing, network integrating, inference customization, literature mining, topological clustering, functional enrichment, network comparison, and programmatic access [54]. 3DScapeCS, a Cytoscape plugin providing three-dimensional, dynamic, parallel network visualization for Mass Spectrometry (MS) molecular network [55]. IPA [56], a commercial software tool for pathway analysis with omics data provides powerful graphical visualized pathways and networks overlaid by diseases, drugs and biological process etc. PathwayStudio provide abstractive graphical interface for users to analyze gene expression, protein interaction and metabolic data to analyze and explore the pathways and networks identified from data. STRING not only gives the graphical visualized protein interaction of both known and predicted but also quantifies each pair of proteins by their interaction types such as physical interaction and gene fusion etc. [57].
Bayesian methods and its derivatives
Bayesian methods allow informative priors so that prior knowledge or results of a previous model can be used to inform the current model. In cancer bioinformatics and systems biology, the primary application of Bayesian methods include Bayesian inference, Bayesian network, Naive Bayes classifier and Bayesian variable selection. Among these methods, Bayesian network is one of the most common modeling tools for pathway and network analysis [19]. Bayesian network is a form of directed statistical modeling designed to capture conditional dependencies between probabilistic events [58]. It consists of a dependency structure and local probability model also named probabilistic graph models which include Hierarchical Bayesian Networks (HBN), Probabilistic Boolean Networks (PBN), Hidden Markov Models (HMM), and Markov Logic Networks (MLN) [59-61]. The dependency structure specifies how the variables are related to each other by drawing directed edges between the variables without creating directed cycles. Each variable depends on a possibly set of other variables, termed "parents." Compared with other pathway/network centric method, Bayesian network model is capable of integrating heterogeneous data, missing value and dependent relationships between variables [62].
In a Bayesian network model, probabilities define the relationship between the current node and its predecessor or parent in a graph [63]. The power of these methods lies in their ability to facilitate the reverse engineering of multiplex networks based on molecular expression, molecular activity and/or cell behavior data, serving as a precursor to synthetic modifications of existing molecular pathways [64]. Bayesian inference is one of the very important Bayesian methods widely used in cancer biomarker discovery, signaling pathway and network inference [65,66]. It has previously been applied to gene expression data for inference of gene regulatory networks [67,68], infer both protein signaling networks [69,70] and gene regulatory networks [71]. To incorporate an explicit time element, dynamic Bayesian Inference was proposed to interrogate dynamic signaling responses within a Bayesian framework, with existing signaling biology incorporated through an informative prior distribution on networks [66]. In addition, Bayesian variable selection aims at solving the problems of “large p, small n” existing in omic data set and using prior knowledge such as pathway and protein interaction to estimate the posterior probability by Markov Chain Monte Carlo (MCMC) also widely used to infer functional interactions in biochemical pathway, model the interactions between different functional modules of a biological network [72] and pathway based cancer biomarker discovery [73,74]. For example, Yang et al. [21] used a Bayesian network to construct HCC cell networks and identify functional modules and interactions between these modules. Stochastic simulation models offer an alternative, but they are hitherto associated with a major disadvantage: their likelihood functions cannot be calculated explicitly, and thus it is difficult to couple them to well-established statistical theory such as maximum likelihood and Bayesian statistics. A number of new methods, among them Approximate Bayesian Computing and Pattern-Oriented Modeling, bypass this limitation. The difference between Bayesian and frequentist inference lies in the following: 1) Bayesian inference provides answers conditional on the observed data and not based on the distribution of estimators or test statistics over imaginary samples not observed (Rossi et al., 2005, p. 4); 2) It includes uncertainty in the probability model, yielding more realistic predictions. 3) It safeguards against overfitting by integrating over model parameters. But the quality of the prior information directly impacts the performance of the Bayesian methods. Also, they are unable to account for feed- back regulation, a hallmark of signaling networks.
Text mining
With the growth of information in literature and biomedical databases, biological and clinical scientists need efficient means of handling and extracting diagnostic methods and prognostic terms and information from scientific literature. For this purpose, text mining that comprises the discovery and extraction of knowledge from free text to generate new hypotheses particularly relevant and helpful in biomedical research [14]. Text mining complements the reading of scientific literature by individual researchers, allows rapid access to information contained in large volume of documents and increases the reproducibility of literature searches by enabling users to process all documents for a specific result. The primary application of text-mining in biomedical research roughly lies in three aspects: 1) Simple text-mining such as transforming textual information into database content and integrating with existing knowledge resources to suggest novel hypotheses; 2) Literature analysis including clustering and classification of entities or diseases; 3) Integrative biology for producing or testing hypotheses against knowledge bases.
Currently, text mining is being successfully applied to the identification of molecular causes of diseases using facts from databases and literature [75-77]. For example, text-mining has been used to suggest disease biomarkers from the scientific literature, and made on the basis of the assumption that two proteins are likely to interact with each other if they share a substantial amount of contextual information [78,79]. By defining a gene of interest, a network is constructed from all scientific publications related to the query-defined gene. The results can be browsed by navigating through the visualized network. CoPub makes uses of lexical resources for genes, proteins, Gene Ontology labels, diseases, pathways, drugs and tissues to identify and statistically to qualify the significance of a specific term for a gene or a set of genes [80]. The results return a set of annotations for their genes of interest. Besides, text mining has been widely used in industrial large scale knowledge base for query genes, proteins, metabolic compounds and drugs functional analysis. To visualize knowledge contained in the scientific literature, software tools have been developed that provide improved integration of text-mining results with other data resources. For example, IPA (Ingenuity) [56], KEGG [81], Pathway Studio [82] and HPRD [83] use text-mining to integrate gene/protein-phenotype associations linking genes and protein variants to the diseases, toxic effects and drug response to their knowledge databases.
Depending on the tasks researchers address, text-mining can achieve different objectives. This include primarily the following: 1) retrieval information from relevant documents; 2) Identification of entities such as genes, diseases, complex relationship between entities and diseases and interactions between proteins and genes [80]; 3) Deposit extracted information into database or used to support manual database curation efforts [15]; 4) Generation hypothesis [79] and test novel research questions [78]. The trend of text-mining technique is shifting from the analysis of only abstracts to the full text of papers, from the analysis of gene and protein-related information to the information about cells, tissues and whole organisms. The most prominent shift is to integrate information from the literature with data sets from other domains such as gene expression profiles [84], genome-wide association studies (GWASs), biochemistry and phenotype [84,85]. Text-mining is prone to integration with machine learning, statistical techniques. In the future, text-mining might face several major challenges such as improve literature analysis, integrate to existing knowledge base, visualization of extracted information.
Machine learning
Machine learning methods have been used for the biomarker discovery from high-throughput omics data, inferring causal relations between mutations and diseases [21] , interactions between genes and proteins [86-88] and relations between environmental features and cancer [89] as well as pathway and network modeling. There are two kinds of basic machine learning techniques, one is unsupervised machine learning such as hierarchical clustering, self-organizing mapping (SOM) etc. [90]. The other is supervised machine learning which needs known knowledge from data train a model and then apply this model to predict the output variables [3]. A number of machine learning such as SVM [14], Artificial Neural Network [91], decision tree and random forests (RFs) etc. have been widely for various applications including identification of breast cancer biomarkers [92], diagnosis biomarker of Parkinson disorders [93], subcellular locations of proteins [94,95], the prediction of protein functions on the basis of protein structures [96,97], the annotation of mutations [98,99]. For example, Han proposed a machine learning based derivative component analysis method to select implicit feature by capturing subtle data behaviors and removing system noises from a proteomic profile to overcome the reproducibility problem for biomarker discovery in proteomics [100]. Another interesting study by Hoshida et al [101] combined eight independent cohorts of gene expression profiles to reveal the subclass of HCC and their related pathways using unsupervised machine learning methods. They found that three common subclasses (S1-S3) of hepatocellular carcinoma (HCC) were significantly correlated to Wnt pathway, MYC, AKT and hepatocyte differentiation respectively. Westen blotting; knockout and immunohistochemical staining were used for experimental validation of their discovery. Another framework called knowledge-driven matrix factorization (KMF) proposed by Yang et al. was used to reconstruct phenotype-specific modular gene networks [21].
Integrative methods
Integration of data from multiple omic studies not only can help unravel the underlying molecular mechanism of carcinogenesis but also identify the signature of signaling pathway/networks characteristic for specific cancer types that can be used for diagnosis, prognosis and guidance for targeted therapy. The methods described in Sections A-E have proven useful for discovering biomarkers from high-throughput omic data, analyzing protein-protein, protein-DNA, and kinase-substrate interactions, as well as for genetic interactions among genes [102]. These efforts have yielded good results in cancer biomarker discovery, protein interaction and interaction between genotype and diseases [103]. However, current omic technologies provide only limited fragmented reality of the biological functions within cell or cancer mechanism. Separate analysis of the data generated from each of these technologies is limited to revealing only partial aberrant molecular changes, because the interaction of multiple molecules cannot be modeled by isolated analysis of genes, proteins or metabolites. Furthermore, limitations such as intrinsic high noise, incomplete data, small sample-size, bias have motivated the use of integrative omic analysis and use of prior biological knowledge and information bases, rather than as mere collections of single large-scale omic studies [14, 34, 104]. However, integration of multiple disparate data types remains a significant challenge in systems biology research. Most recently, attempts at integration of multiple high-throughput omics data have concentrated on capturing regulatory associations between genes and proteins by comparing expression patterns across multiple conditions [105-107], combining functional characterization and quantitative evidence extracted from different data sources of all levels of gene products, mRNA, proteins and metabolites, as well as their interaction [108-110]. Some previous works [81, 111-113] in integrative analysis utilize pathways in the form of connected routes through a graph-based representation of the metabolic network [114]. Other approaches focus on the functional module of protein interaction network and analyze experimental data in the context of pathways using multiple source omics data [14,115,116]. We and others have developed advanced bioinformatics tools and algorithms to facilitate the integration of diverse data types [34, 110, 117-120].
Different biological types of data, such as sequences, protein structures and families, proteomics data, ontologies, gene expression and other experimental data sets show a growing complexity produced by numerous heterogeneous application areas. The integration of heterogeneous data is therefore becoming more and more important. In order to gain insights into the complexity and dynamics of biological systems, the information stored in these data repositories needs to be linked and combined in efficient ways.
Application of biomarker discovery in HCC
Hepatocellular carcinoma (HCC) is the fifth most common malignancy and the third leading cause of cancer death in the world, with the five-year survival rate approaching 7% [33]. Treatments of HCC include surgical resection and transplantation, ablation and transarterial chemoembolization, and systemic chemotherapy. Even so, no existing systemic chemotherapy is effective for advanced HCC [121,122]. For example, Lovet et al. [123] reported that targeted therapy with sorafenib which inhibits multiple tyrosine kinase receptors (RAS/VEGFR) may prolong survival by about three months. However, due to the redundancy and compensation of the signaling network in HCC, a significant reorganization of the signaling network observed such as down regulation of tumor suppressors (p53 and CHK1 when XIAP silenced or p-RB when CDK6 silenced) and upregulation of tumor promoting proteins (ETS1 when XIAP silenced or p-CREB when CDK6 silenced) may confer the growth benefit for cancer cells [124]. This example suggests providing pathways and network information may improve the efficacy of systemic chemotherapy of HCC. Chang et al [125] partitioned the complex oncogenic signaling networks into basic units, or functional modules, of signaling activity (e.g., a protein phosphorylating another protein to activate its kinase activity) and demonstrated that gene expression signatures based on these modules can predict the effectiveness of pathway-specific therapeutics [125]. Except for surgical resection/transplantation of early stage HCC, the survival time is not significantly prolonged by any of these treatments. Added to pathway and network centric method making use of omics data with systematic chemotherapy will benefit the development of newer therapeutic targets for HCC treatment.
In recent years, computational methods for models take more and more important roles in the HCC investigations [114,126,127]. Some computer systems have also been developed. For example, Shannon et al. [128] developed a java based tool Gaggle by integrating diverse databases (e.g., KEGG, BioCyc, String) and software (e.g., Cytoscape, R ) to simultaneously explore the experimental data (e.g., mRNA and protein abundance, protein-protein and protein-DNA interactions), functional associations, metabolic pathways (KEGG) and Pubmed abstracts. Recently, Zheng et al [129] identified the molecular events underlying the development of HCV induced HCC by integrating gene expression profile and protein interaction data. To get the subnetworks, they refined the network by removing a network component if the number of nodes is smaller than five. They found four subnetworks called normal-cirrhosis, cirrhosis-dysplasia, dysplasia-early and early-advanced HCC networks. From each of the sub networks they identified functional modules and hub genes. By comparing the pathways in each sub networks, they observed changes of pathways and network activities. Their findings were validated by literature. Even though the types of omics data they used only include gene expression and protein interactions, they provide a way to study the changes of network activities by analysis of omic data. Zhang et al. used systematical method including partial least squares, literature mining technique and with GeneGO Meta-Core to discover the biomarkers of HCC with gene expression as well as protein data. Based on these marker genes, they constructed down regulated and up regulated networks. In the former, they identified 10 up regulated hub genes (MAPK1, SP1, HDAC1, YY1, ABL1, PTK2, SMAD2, NCOA3; CDC25A and NCOA2). They identified 7 hub genes (FOS, ESR1, JUNB, EGFR, SOCS3; FOLH1 and IGF1) in the latter. Partial least squares were employed to construct a classifier with these biomarkers. They used five-fold cross-validation and two independent datasets to evaluate the performance of the classifier. Furthermore, they used experimental immunohistochemistry and western blot measurements to verify the marker genes predicted by the classifier. Their results show that the network-based approach facilitates biomarker identification and improves classification accuracy [130]. Hollywod et al [131] identified driver genes which are potent diagnosis markers and mechanism study of HCC using t-statistic map (TM) and transcriptome correlation map (TCM) approaches with integration of DNA copy number measured by genomics CGH array and gene expression. They found 50 driver genes with significant prognostic relevance to HCC key signaling pathways such as mTOR, AMPK, and EGFR. siRNA-mediated knockdown experiments was used to evaluate the functional significance of the 50 driver genes [131].
Even though collection of diverse omics data to analyze the relationships between HCC phenotype and biological entities within the cell has been proved powerful enough, such integration is still fragmentary, incomplete and inadequate to reflect the whole picture of the cancer information and development. The amount of omics data from genomics, proteomics, metabolomics and interactomics is increasing. In pace with the explosion of omics data, a number of open-access databases, containing comprehensive gene, protein interaction, biological pathway and network information, are being developed to provide biologists with valuable tools for analyzing the data from complex biological systems. These include IntAct, BioGRID, MINT, KEGG, PID, STRING and REACTOME etc. all of which provide very useful qualitative mappings of functional associations between key components in canonical pathways [14]. Table 2 summarizes primary data source and URLs specific to HCC.
Data sources and URLs for HCC databases.
| Data sources | URLs |
|---|---|
| EHCO[132] | http://ehco.iis.sinica.edu.tw/ |
| Onco.HCC[133] | http://oncodb.hcc.ibms.sinica.edu.tw/index.htm |
| HCVpro[134] | http://cbrc.kaust.edu.sa/hcvpro/ |
| HCVdb[135] | http://euhcvdb.ibcp.fr/euHCVdb/ |
| Hepatitis Virus Database (HVDB) [136] | http://s2as02.genes.nig.ac.jp |
| Los Alamos National Laboratory in the United States[137] | http://hcv.lanl.gov |
| LiverAtlas[138] | http://liveratlas.hupo.org.cn |
| dbHCCvar[139] | http://GenetMed.fudan.edu.cn/dbHCCvar |
Limitations of omics based biomarker discovery
With wide applications of omics technique, more accurate and ubiquitous biomarkers have been identified, but only few have been brought to clinical setting and many have proved to be irreproducible [140]. One of the concerns is that biomarkers identified suffer from low diagnostic specificity and sensitivity which leads to current cancer biomarkers have not yet made a major impact in reducing cancer burden. For instance, serum alpha-fetoprotein (AFP) is the most widely used biomarkers for detecting and monitoring of HCC, but the false negative rate with AFP levels may be high as 40% for patients with early stage of HCC, for advances patients, the AFP levels remain small in 15%-30% of patients [141].
One of the important limitations is possible artifacts in conducing biological experiments such as instrument variability. Others include bias in sample collection and sample handling which lead to cohort differences. For example, Sreekumar et al. [142] reported sarcosine as a prostate cancer biomarker through metabolomics analysis. However, subsequent validation study done by Jentzmik et al. [143] concluded that the levels of sarcosine measured by GC-MS could not differentiate malignant from nonmalignant tissue. Collestelli et al. reported no statistically significant difference between prostate cancer and healthy controls in the sarcosine to creatinine ratios and that the levels of sarcosine were about 11.7% higher in the healthy controls [144]. Another important limitation relates to lack of computational methods that can extract knowledge from omic data involving substantial amount of noise, high dimensionality, missing values, etc.
Although the use of pathway and network-based approaches and the integration of prior biological knowledge with omic data are promising in addressing some of the computational challenges, they too have some limitations as outlined below:
- mRNA levels and DNA alterations may not accurately reflect the corresponding protein levels and fail to reveal changes in posttranscriptional protein modulation (e.g., phosphorylation, acetylation, methylation, ubiquitination, etc.) or protein degradation rates. Correlation of mRNA with its associated protein expression can be relatively low. The signaling network constructed using these approaches does not reflect the dynamic signal flow in a spatial relationship. Also, the genomic changes (mRNA level, SNP, CNV, methylation) ultimately affect protein expression, activation and inactivation, which, in turn, controls cellular behavior.
- Current proteomic technologies provide only limited coverage of the proteome and more sensitive technologies are needed to identify and quantitate low abundant proteins [145,146].
- Interpretation of pathway mapping results from the fact that pathway annotations currently take little consideration of tissue specificities of genes or proteins in the pathway. This limits the tissue and/or isoform specificity in pathway annotations. Thus, specific steps of a pathway may not be actually active in tissues/cells from which the omics data may be generated. In some cases, this may occur because protein isoforms or splice variants have been annotated as a protein class or a canonical protein sequence, respectively, in the pathway while they may be expressed differentially in different tissues/cells.
- Because biological pathways are inherently complex and dynamic, pathway annotations in different pathway databases vary significantly in pathway models and in a number of other aspects, e.g., specific protein forms, dynamic complex formation, subcellular locations, and pathway cross talks.
Current computational methods thus need to provide a solution to these issues including revealing patterns within the data, modeling heterogeneity, profiling of disease classes and subclasses, producing a predictive of patients' classification, etc.. Biomarker discovery is now changing research away from identification of individual biomarkers to searching for perturbed pathways and network activities.
Conclusion
Early detection of cancer improves survival and enhances quality of life. An ideal marker would be one that can be measured easily and reliably using an assay with high sensitivity and specificity and undergo rigorous validation before they are introduced into routine clinical care. Currently, the treatment of most cancers is based on the tissue types and clinical stages. This approach is often ineffective due to the heterogeneity of the tumors. Pathway and network based method have taken more important role in analysis of high-throughput data. Pathway and network based methods provide a global and systematical way to explore the relationships between biomarkers and their interacting partners. Thus, future work is likely to focus on using pathway and network based methods for biomarker discovery.
It is our expectation that methods discussed above will become a component in a shared infrastructure of biomedical resources that can be used by researchers to identify and to retrieve the most relevant work, to formulate hypothesis, to find supporting and contradicting evidence for hypotheses, to integrate research results into a framework of whole biological systems and to support the translation of research results across domains and into clinical applications.
Acknowledgements
This study was supported by NIH Grant R01CA143420 awarded to HWR.
Competing Interests
The authors have declared that no competing interest exists.
References
1. Li Y, Agarwal P. A pathway-based view of human diseases and disease relationships. PLoS One. 2009;4(2):e4346
2. Aitman TJ, Boone C, Churchill GA, Hengartner MO, Mackay TF, Stemple DL. The future of model organisms in human disease research. Nat Rev Genet. 2011;12(8):575-82
3. Baranzini SE. The genetics of autoimmune diseases: a networked perspective. Curr Opin Immunol. 2009;21(6):596-605
4. Ding Y, Chen M, Liu Z, Ding D, Ye Y, Zhang M, Kelly R, Guo L, Su Z, Harris SC, Qian F, Ge W, Fang H, Xu X, Tong W. atBioNet--an integrated network analysis tool for genomics and biomarker discovery. BMC Genomics. 2012;13:325
5. Feng M, Gao W, Wang R, Chen W, Man YG, Figg WD, Wang XW, Dimitrov DS, Ho M. Therapeutically targeting glypican-3 via a conformation-specific single-domain antibody in hepatocellular carcinoma. Proc Natl Acad Sci U S A. 2013;110(12):E1083-91
6. Murray RS. Myth of the chronic fatigue syndrome. West J Med. 1991;155(1):68
7. Chuang HY, Lee E, Liu YT, Lee D, Ideker T. Network-based classification of breast cancer metastasis. Mol Syst Biol. 2007;3:140
8. Dalerba P, Dylla SJ, Park IK, Liu R, Wang X, Cho RW, Hoey T, Gurney A, Huang EH, Simeone DM, Shelton AA, Parmiani G, Castelli C, Clarke MF. Phenotypic characterization of human colorectal cancer stem cells. Proc Natl Acad Sci U S A. 2007;104(24):10158-63
9. Taylor IW, Linding R, Warde-Farley D, Liu Y, Pesquita C, Faria D, Bull S, Pawson T, Morris Q, Wrana JL. Dynamic modularity in protein interaction networks predicts breast cancer outcome. Nat Biotechnol. 2009;27(2):199-204
10. Torkamani A, Schork NJ. Identification of rare cancer driver mutations by network reconstruction. Genome Res. 2009;19(9):1570-8
11. Kim J, Gao L, Tan K. Multi-analyte network markers for tumor prognosis. PLoS One. 2012;7(12):e52973
12. Goh KI, Cusick ME, Valle D, Childs B, Vidal M, Barabasi AL. The human disease network. Proc Natl Acad Sci U S A. 2007;104(21):8685-90
13. Loscalzo J, Barabasi AL. Systems biology and the future of medicine. Wiley Interdiscip Rev Syst Biol Med. 2011;3(6):619-27
14. Wang J, Zhang Y, Marian C, Ressom HW. Identification of aberrant pathways and network activities from high-throughput data. Brief Bioinform. 2012;13(4):406-19
15. Dowell KG, McAndrews-Hill MS, Hill DP, Drabkin HJ, Blake JA. Integrating text mining into the MGI biocuration workflow. Database (Oxford). 2009;2009:bap019
16. Ghosh D, Poisson LM. "Omics" data and levels of evidence for biomarker discovery. Genomics. 2009;93(1):13-6
17. Kuan PF, Wang S, Zhou X, Chu H. A statistical framework for Illumina DNA methylation arrays. Bioinformatics. 2010;26(22):2849-55
18. Vinayagam A, Stelzl U, Foulle R, Plassmann S, Zenkner M, Timm J, Assmus HE, Andrade-Navarro MA, Wanker EE. A directed protein interaction network for investigating intracellular signal transduction. Sci Signal. 2011;4(189):rs8
19. Gevaert O, Van Vooren S, De Moor B. A framework for elucidating regulatory networks based on prior information and expression data. Ann N Y Acad Sci. 2007;1115:240-8
20. Kirouac DC, Saez-Rodriguez J, Swantek J, Burke JM, Lauffenburger DA, Sorger PK. Creating and analyzing pathway and protein interaction compendia for modelling signal transduction networks. BMC Syst Biol. 2012;6:29
21. Yamashita T, Ji J, Budhu A, Forgues M, Yang W, Wang HY, Jia H, Ye Q, Qin LX, Wauthier E, Reid LM, Minato H, Honda M, Kaneko S, Tang ZY, Wang XW. EpCAM-positive hepatocellular carcinoma cells are tumor-initiating cells with stem/progenitor cell features. Gastroenterology. 2009;136(3):1012-24
22. Mitsos A, Melas IN, Morris MK, Saez-Rodriguez J, Lauffenburger DA, Alexopoulos LG. Non Linear Programming (NLP) formulation for quantitative modeling of protein signal transduction pathways. PLoS One. 2012;7(11):e50085
23. Vineetha S, Chandra Shekara Bhat C, Idicula SM. MicroRNA-mRNA interaction network using TSK-type recurrent neural fuzzy network. Gene. 2013;515(2):385-90
24. Ji J, Ling J, Jiang H, Wen Q, Whitin JC, Tian L, Cohen HJ, Ling XB. Cloud-based solution to identify statistically significant MS peaks differentiating sample categories. BMC Res Notes. 2013;6:109
25. Patino WD, Mian OY, Kang JG, Matoba S, Bartlett LD, Holbrook B, Trout HH 3rd, Kozloff L, Hwang PM. Circulating transcriptome reveals markers of atherosclerosis. Proc Natl Acad Sci U S A. 2005;102(9):3423-8
26. West M, Blanchette C, Dressman H, Huang E, Ishida S, Spang R, Zuzan H, Olson JA Jr, Marks JR, Nevins JR. Predicting the clinical status of human breast cancer by using gene expression profiles. Proc Natl Acad Sci U S A. 2001;98(20):11462-7
27. Nguyen DV, Rocke DM. Partial least squares proportional hazard regression for application to DNA microarray survival data. Bioinformatics. 2002;18(12):1625-32
28. Li L, Darden TA, Weinberg CR, Levine AJ, Pedersen LG. Gene assessment and sample classification for gene expression data using a genetic algorithm/k-nearest neighbor method. Comb Chem High Throughput Screen. 2001;4(8):727-39
29. Deschamps AM, Spinale FG. Pathways of matrix metalloproteinase induction in heart failure: bioactive molecules and transcriptional regulation. Cardiovasc Res. 2006;69(3):666-76
30. Jia P, Zheng S, Long J, Zheng W, Zhao Z. dmGWAS: dense module searching for genome-wide association studies in protein-protein interaction networks. Bioinformatics. 2011;27(1):95-102
31. Shannon P, Markiel A, Ozier O, Baliga NS, Wang JT, Ramage D, Amin N, Schwikowski B, Ideker T. Cytoscape: a software environment for integrated models of biomolecular interaction networks. Genome Res. 2003;13(11):2498-504
32. Al-Shahrour F, Minguez P, Tarraga J, Montaner D, Alloza E, Vaquerizas JM, Conde L, Blaschke C, Vera J, Dopazo J. BABELOMICS: a systems biology perspective in the functional annotation of genome-scale experiments. Nucleic Acids Res. 2006;34(Web Server issue):W472-6
33. Miwa M, Ohta T, Rak R, Rowley A, Kell DB, Pyysalo S, Ananiadou S. A method for integrating and ranking the evidence for biochemical pathways by mining reactions from text. Bioinformatics. 2013;29(13):i44-i52
34. Waters KM, Liu T, Quesenberry RD, Willse AR, Bandyopadhyay S, Kathmann LE, Weber TJ, Smith RD, Wiley HS, Thrall BD. Network analysis of epidermal growth factor signaling using integrated genomic, proteomic and phosphorylation data. PLoS One. 2012;7(3):e34515
35. Jain N, Thatte J, Braciale T, Ley K, O'Connell M, Lee JK. Local-pooled-error test for identifying differentially expressed genes with a small number of replicated microarrays. Bioinformatics. 2003;19(15):1945-51
36. Tusher VG, Tibshirani R, Chu G. Significance analysis of microarrays applied to the ionizing radiation response. Proc Natl Acad Sci U S A. 2001;98(9):5116-21
37. Nacheva EP, Grace CD, Brazma D, Gancheva K, Howard-Reeves J, Rai L, Gale RE, Linch DC, Hills RK, Russell N, Burnett AK, Kottaridis PD. Does BCR/ABL1 positive acute myeloid leukaemia exist? Br J Haematol. 2013;161(4):541-50
38. Wolfinger RD, Gibson G, Wolfinger ED, Bennett L, Hamadeh H, Bushel P, Afshari C, Paules RS. Assessing gene significance from cDNA microarray expression data via mixed models. J Comput Biol. 2001;8(6):625-37
39. Darvin K, Randolph A, Ovalles S, Halade D, Breeding L, Richardson A, Espinoza SE. Plasma Protein Biomarkers of the Geriatric Syndrome of Frailty. J Gerontol A Biol Sci Med Sci.
40. Kerr MK, Churchill GA. Bootstrapping cluster analysis: assessing the reliability of conclusions from microarray experiments. Proc Natl Acad Sci U S A. 2001;98(16):8961-5
41. Storey JD, Tibshirani R. Statistical significance for genomewide studies. Proc Natl Acad Sci U S A. 2003;100(16):9440-5
42. Huang da W, Sherman BT, Lempicki RA. Systematic and integrative analysis of large gene lists using DAVID bioinformatics resources. Nat Protoc. 2009;4(1):44-57
43. Soukup M, Lee JK. Developing optimal prediction models for cancer classification using gene expression data. J Bioinform Comput Biol. 2004;1(4):681-94
44. Huang Y, Pepe MS, Feng Z. Logistic Regression Analysis with Standardized Markers. Ann Appl Stat. 2013 7 (3)
45. Fattovich G, Stroffolini T, Zagni I, Donato F. Hepatocellular carcinoma in cirrhosis: incidence and risk factors. Gastroenterology. 2004;127(5 Suppl 1):S35-50
46. Junrong T, Huancheng Z, Feng H, Yi G, Xiaoqin Y, Zhengmao L, Hong Z, Jianying Z, Yin W, Yuanhang H, Jianlin Z, Longhua S, Guolin H. Proteomic identification of CIB1 as a potential diagnostic factor in hepatocellular carcinoma. J Biosci. 2011;36(4):659-68
47. Mehan MR, Ostroff R, Wilcox SK, Steele F, Schneider D, Jarvis TC, Baird GS, Gold L, Janjic N. Highly multiplexed proteomic platform for biomarker discovery, diagnostics, and therapeutics. Adv Exp Med Biol. 2013;734:283-300
48. Di Deco J, Gonzalez AM, Diaz J, Mato V, Garcia-Frank D, Alvarez-Linera J, Frank A, Hernandez-Tamames JA. Machine learning and social network analysis applied to Alzheimer's disease biomarkers. Curr Top Med Chem. 2013;13(5):652-62
49. Minati L, Varotto G, D'Incerti L, Panzica F, Chan D. From brain topography to brain topology: relevance of graph theory to functional neuroscience. Neuroreport. 2013;24(10):536-43
50. Bleris L, Xie Z, Glass D, Adadey A, Sontag E, Benenson Y. Synthetic incoherent feedforward circuits show adaptation to the amount of their genetic template. Mol Syst Biol;7:519.
51. Ma'ayan A, Blitzer RD, Iyengar R. Toward predictive models of mammalian cells. Annu Rev Biophys Biomol Struct. 2005;34:319-49
52. Sivachenko AY, Yuryev A, Daraselia N, Mazo I. Molecular networks in microarray analysis. J Bioinform Comput Biol. 2007;5(2B):429-56
53. Wang H, Zheng H, Azuaje F. Ontology- and graph-based similarity assessment in biological networks. Bioinformatics. 2010;26(20):2643-4
54. Saito R, Smoot ME, Ono K, Ruscheinski J, Wang PL, Lotia S, Pico AR, Bader GD, Ideker T. A travel guide to Cytoscape plugins. Nat Methods. 2012;9(11):1069-76
55. Wang Q, Tang B, Song L, Ren B, Liang Q, Xie F, Zhuo Y, Liu X, Zhang L. 3DScapeCS: application of three dimensional, parallel, dynamic network visualization in Cytoscape. BMC Bioinformatics. 2013;14(1):322
56. Ganter B, Zidek N, Hewitt PR, Muller D, Vladimirova A. Pathway analysis tools and toxicogenomics reference databases for risk assessment. Pharmacogenomics. 2008;9(1):35-54
57. Franceschini A, Szklarczyk D, Frankild S, Kuhn M, Simonovic M, Roth A, Lin J, Minguez P, Bork P, von Mering C, Jensen LJ. STRING v9.1: protein-protein interaction networks, with increased coverage and integration. Nucleic Acids Res. 2013;41(Database issue):D808-15
58. Pe'er D. Bayesian network analysis of signaling networks: a primer. Sci STKE 2005. 2005(281):pl4
59. Larjo A, Shmulevich I, Lahdesmaki H. Structure learning for Bayesian networks as models of biological networks. Methods Mol Biol. 2013;939:35-45
60. Han B, Chen XW, Talebizadeh Z, Xu H. Genetic studies of complex human diseases: characterizing SNP-disease associations using Bayesian networks. BMC Syst Biol. 2013;6(Suppl 3):S14
61. Mehri M. A comparison of neural network models, fuzzy logic, and multiple linear regression for prediction of hatchability. Poult Sci. 2013;92(4):1138-42
62. Jinlian Wang HWR. Bayesian Network for Omics Data Integration. Washington DC: GENISP. 2012:110-3
63. Alterovitz G, Liu J, Afkhami E, Ramoni MF. Bayesian methods for proteomics. Proteomics. 2007;7(16):2843-55
64. Barnes CP, Silk D, Sheng X, Stumpf MP. Bayesian design of synthetic biological systems. Proc Natl Acad Sci U S A. 2011;108(37):15190-5
65. Terfve C, Saez-Rodriguez J. Modeling signaling networks using high-throughput phospho-proteomics. Adv Exp Med Biol. 2012;736:19-57
66. Hill SM, Lu Y, Molina J, Heiser LM, Spellman PT, Speed TP, Gray JW, Mills GB, Mukherjee S. Bayesian inference of signaling network topology in a cancer cell line. Bioinformatics. 2012;28(21):2804-10
67. Husmeier D. Sensitivity and specificity of inferring genetic regulatory interactions from microarray experiments with dynamic Bayesian networks. Bioinformatics. 2003;19(17):2271-82
68. Rau A, Jaffrezic F, Foulley JL, Doerge RW. An empirical Bayesian method for estimating biological networks from temporal microarray data. Stat Appl Genet Mol Biol. 2010;9:Article 9
69. Mukherjee S, Speed TP. Network inference using informative priors. Proc Natl Acad Sci U S A. 2008;105(38):14313-8
70. Ciaccio MF, Wagner JP, Chuu CP, Lauffenburger DA, Jones RB. Systems analysis of EGF receptor signaling dynamics with microwestern arrays. Nat Methods. 2010;7(2):148-55
71. Friedman N, Linial M, Nachman I, Pe'er D. Using Bayesian networks to analyze expression data. J Comput Biol. 2000;7(3-4):601-20
72. Santra T, Kolch W, Kholodenko BN. Integrating Bayesian variable selection with Modular Response Analysis to infer biochemical network topology. BMC Syst Biol. 2013;7:57
73. Santra T, Kolch W, Kholodenko BN. Integrating Bayesian variable selection with Modular Response Analysis to infer biochemical network topology. BMC Syst Biol. 2010;7:57
74. Hill SM, Neve RM, Bayani N, Kuo WL, Ziyad S, Spellman PT, Gray JW, Mukherjee S. Integrating biological knowledge into variable selection: an empirical Bayes approach with an application in cancer biology. BMC Bioinformatics. 2010;13:94
75. Perez-Iratxeta C, Wjst M, Bork P, Andrade MA. G2D: a tool for mining genes associated with disease. BMC Genet. 2005;6:45
76. Perez-Iratxeta C, Bork P, Andrade MA. Association of genes to genetically inherited diseases using data mining. Nat Genet. 2002;31(3):316-9
77. Blagosklonny MV, Pardee AB. Conceptual biology: unearthing the gems. Nature. 2002;416(6879):373
78. van Haagen HH, t Hoen PA, Botelho Bovo A, de Morree A, van Mulligen EM, Chichester C, Kors JA, den Dunnen JT, van Ommen GJ, van der Maarel SM, Kern VM, Mons B, Schuemie MJ. Novel protein-protein interactions inferred from literature context. PLoS One. 2009;4(11):e7894
79. Elkin PL, Tuttle MS, Trusko BE, Brown SH. BioProspecting: novel marker discovery obtained by mining the bibleome. BMC Bioinformatics. 2009;10(Suppl 2):S9
80. Frijters R, Heupers B, van Beek P, Bouwhuis M, van Schaik R, de Vlieg J, Polman J, Alkema W. CoPub: a literature-based keyword enrichment tool for microarray data analysis. Nucleic Acids Res. 2008;36(Web Server issue):W406-10
81. Schwartz JM, Gaugain C, Nacher JC, de Daruvar A, Kanehisa M. Observing metabolic functions at the genome scale. Genome Biol. 2007;8(6):R123
82. Nikitin A, Egorov S, Daraselia N, Mazo I. Pathway studio--the analysis and navigation of molecular networks. Bioinformatics. 2003;19(16):2155-7
83. Keshava Prasad TS, Goel R, Kandasamy K, Keerthikumar S, Kumar S, Mathivanan S, Telikicherla D, Raju R, Shafreen B, Venugopal A, Balakrishnan L, Marimuthu A, Banerjee S, Somanathan DS, Sebastian A, Rani S, Ray S, Harrys Kishore CJ, Kanth S, Ahmed M, Kashyap MK, Mohmood R, Ramachandra YL, Krishna V, Rahiman BA, Mohan S, Ranganathan P, Ramabadran S, Chaerkady R, Pandey A. Human Protein Reference Database--2009 update. Nucleic Acids Res. 2009;37(Database issue):D767-72
84. Wang J YH, Tadesse MG, Ressom HW. A Bayesian network model for omics data integration. Proceedings of the 2012 IEEE International Workshop on Genomic Signal Processing and Statistics (GENSIPS). Washington DC. 2012
85. Cohen KB, Johnson HL, Verspoor K, Roeder C, Hunter LE. The structural and content aspects of abstracts versus bodies of full text journal articles are different. BMC Bioinformatics. 2010;11:492
86. Lev I, Volpe M, Goor L, Levinton N, Emuna L, Ben-Aroya S. Reverse PCA, a Systematic Approach for Identifying Genes Important for the Physical Interaction between Protein Pairs. PLoS Genet. 2013;9(10):e1003838
87. Li T, Zhu S, Shuai L, Xu Y, Yin S, Bian Y, Wang Y, Zuo B, Wang W, Zhao S, Zhang L, Zhang J, Gao GF, Allain JP, Li C. Infection of common marmosets with hepatitis C virus/GB virus-B chimeras. Hepatology. 2013
88. White NM, Newsted DW, Masui O, Romaschin AD, Siu KW, Yousef GM. Identification and validation of dysregulated metabolic pathways in metastatic renal cell carcinoma. Tumour Biol. 2013
89. Tang H, Wei P, Duell EJ, Risch HA, Olson SH, Bueno-de-Mesquita HB, Gallinger S, Holly EA, Petersen GM, Bracci PM, McWilliams RR, Jenab M, Riboli E, Tjonneland A, Boutron-Ruault MC, Kaaks R, Trichopoulos D, Panico S, Sund M, Peeters PH, Khaw KT, Amos CI, Li D. Genes-environment interactions in obesity- and diabetes-associated pancreatic cancer: A GWAS data analysis. Cancer Epidemiol Biomarkers Prev. 2013
90. Koo CL, Liew MJ, Mohamad MS, Mohamed Salleh AH. A Review for Detecting Gene-Gene Interactions Using Machine Learning Methods in Genetic Epidemiology. Biomed Res Int. 2013;2013:432375
91. Yang ZR. Neural networks. Methods Mol Biol. 2010;609:197-222
92. Zhang F, Kaufman HL, Deng Y, Drabier R. Recursive SVM biomarker selection for early detection of breast cancer in peripheral blood. BMC Med Genomics. 2013;6(Suppl 1):S4
93. Mattison HA, Stewart T, Zhang J. Applying bioinformatics to proteomics: is machine learning the answer to biomarker discovery for PD and MSA? Mov Disord. 2012;27(13):1595-7
94. Andreyev AY, Shen Z, Guan Z, Ryan A, Fahy E, Subramaniam S, Raetz CR, Briggs S, Dennis EA. Application of proteomic marker ensembles to subcellular organelle identification. Mol Cell Proteomics. 2010;9(2):388-402
95. Chattopadhyay S, Bagchi P, Dutta D, Mukherjee A, Kobayashi N, Chawlasarkar M. Computational identification of post-translational modification sites and functional families reveal possible moonlighting role of rotaviral proteins. Bioinformation. 2010;4(10):448-51
96. Crooks GE, Wolfe J, Brenner SE. Measurements of protein sequence-structure correlations. Proteins. 2004;57(4):804-10
97. Wang J, Yu Y, Zhao Y, Zhang D, Li J. Evaluation and integration of existing methods for computational prediction of allergens. BMC Bioinformatics. 2013;14(Suppl 4):S1
98. Werfel J, Krause S, Bischof AG, Mannix RJ, Tobin H, Bar-Yam Y, Bellin RM, Ingber DE. How changes in extracellular matrix mechanics and gene expression variability might combine to drive cancer progression. PLoS One. 2013;8(10):e76122
99. Wong SH, Sung JJ, Chan FK, To KF, Ng SS, Wang XJ, Yu J, Wu WK. Genome-wide association and sequencing studies on colorectal cancer. Semin Cancer Biol. 2013
100. Han H. A novel profile biomarker diagnosis for mass spectral proteomics. Pac Symp Biocomput. 2014;19:340-51
101. Hoshida Y, Nijman SM, Kobayashi M, Chan JA, Brunet JP, Chiang DY, Villanueva A, Newell P, Ikeda K, Hashimoto M, Watanabe G, Gabriel S, Friedman SL, Kumada H, Llovet JM, Golub TR. Integrative transcriptome analysis reveals common molecular subclasses of human hepatocellular carcinoma. Cancer Res. 2009;69(18):7385-92
102. Ideker T, Krogan NJ. Differential network biology. Mol Syst Biol. 2012;8:565
103. Park SJ, Lee SY, Cho J, Kim TY, Lee JW, Park JH, Han MJ. Global physiological understanding and metabolic engineering of microorganisms based on omics studies. Appl Microbiol Biotechnol. 2005;68(5):567-79
104. Oishi N, Kumar MR, Roessler S, Ji J, Forgues M, Budhu A, Zhao X, Andersen JB, Ye QH, Jia HL, Qin LX, Yamashita T, Woo HG, Kim YJ, Kaneko S, Tang ZY, Thorgeirsson SS, Wang XW. Transcriptomic profiling reveals hepatic stem-like gene signatures and interplay of miR-200c and epithelial-mesenchymal transition in intrahepatic cholangiocarcinoma. Hepatology. 2012;56(5):1792-803
105. Faith JJ, Hayete B, Thaden JT, Mogno I, Wierzbowski J, Cottarel G, Kasif S, Collins JJ, Gardner TS. Large-scale mapping and validation of Escherichia coli transcriptional regulation from a compendium of expression profiles. PLoS Biol. 2007;5(1):e8
106. McDermott JE, Diamond DL, Corley C, Rasmussen AL, Katze MG, Waters KM. Topological analysis of protein co-abundance networks identifies novel host targets important for HCV infection and pathogenesis. BMC Syst Biol. 2012;6:28
107. McDermott JE, Taylor RC, Yoon H, Heffron F. Bottlenecks and hubs in inferred networks are important for virulence in Salmonella typhimurium. J Comput Biol. 2009;16(2):169-80
108. Chen MH, Yang WL, Lin KT, Liu CH, Liu YW, Huang KW, Chang PM, Lai JM, Hsu CN, Chao KM, Kao CY, Huang CY. Gene expression-based chemical genomics identifies potential therapeutic drugs in hepatocellular carcinoma. PLoS One. 2011;6(11):e27186
109. Coban Z, Barton MC. Integrative genomics: liver regeneration and hepatocellular carcinoma. J Cell Biochem. 2013;113(7):2179-84
110. Mitchell HD, Eisfeld AJ, Sims AC, McDermott JE, Matzke MM, Webb-Robertson BJ, Tilton SC, Tchitchek N, Josset L, Li C, Ellis AL, Chang JH, Heegel RA, Luna ML, Schepmoes AA, Shukla AK, Metz TO, Neumann G, Benecke AG, Smith RD, Baric RS, Kawaoka Y, Katze MG, Waters KM. A network integration approach to predict conserved regulators related to pathogenicity of influenza and SARS-CoV respiratory viruses. PLoS One. 2013;8(7):e69374
111. Wang J, Chen L, Tian X, Gao L, Niu X, Shi M, Zhang W. Global Metabolomic and Network analysis of Escherichia coli Responses to Exogenous Biofuels. J Proteome Res. 2013
112. Notebaart RA, Teusink B, Siezen RJ, Papp B. Co-regulation of metabolic genes is better explained by flux coupling than by network distance. PLoS Comput Biol. 2008;4(1):e26
113. Shlomi T, Cabili MN, Herrgard MJ, Palsson BO, Ruppin E. Network-based prediction of human tissue-specific metabolism. Nat Biotechnol. 2008;26(9):1003-10
114. Blum T, Kohlbacher O. MetaRoute: fast search for relevant metabolic routes for interactive network navigation and visualization. Bioinformatics. 2008;24(18):2108-9
115. Blazier AS, Papin JA. Integration of expression data in genome-scale metabolic network reconstructions. Front Physiol. 2012;3:299
116. Federici G, Gao X, Slawek J, Arodz T, Shitaye A, Wulfkuhle JD, De Maria R, Liotta LA, Petricoin EF 3rd. Systems analysis of the NCI-60 cancer cell lines by alignment of protein pathway activation modules with "-OMIC" data fields and therapeutic response signatures. Mol Cancer Res. 2013;11(6):676-85
117. Cui J, Liu J, Li Y, Shi T. Integrative identification of Arabidopsis mitochondrial proteome and its function exploitation through protein interaction network. PLoS One. 2011;6(1):e16022
118. Hallock P, Thomas MA. Integrating the Alzheimer's disease proteome and transcriptome: a comprehensive network model of a complex disease. Omics. 2012;16(1-2):37-49
119. Waters KM, Pounds JG, Thrall BD. Data merging for integrated microarray and proteomic analysis. Brief Funct Genomic Proteomic. 2006;5(4):261-72
120. Zhou B, Wang J, Ressom HW. MetaboSearch: tool for mass-based metabolite identification using multiple databases. PLoS One. 2012;7(6):e40096
121. Llovet JM, Di Bisceglie AM, Bruix J, Kramer BS, Lencioni R, Zhu AX, Sherman M, Schwartz M, Lotze M, Talwalkar J, Gores GJ. Design and endpoints of clinical trials in hepatocellular carcinoma. J Natl Cancer Inst. 2008;100(10):698-711
122. Llovet JM, Bruix J. Novel advancements in the management of hepatocellular carcinoma in 2008. J Hepatol. 2008;48(Suppl 1):S20-37
123. Llovet JM, Ricci S, Mazzaferro V, Hilgard P, Gane E, Blanc JF, de Oliveira AC, Santoro A, Raoul JL, Forner A, Schwartz M, Porta C, Zeuzem S, Bolondi L, Greten TF, Galle PR, Seitz JF, Borbath I, Haussinger D, Giannaris T, Shan M, Moscovici M, Voliotis D, Bruix J. Sorafenib in advanced hepatocellular carcinoma. N Engl J Med. 2008;359(4):378-90
124. Zhang DY, Ye F, Gao L, Liu X, Zhao X, Che Y, Wang H, Wang L, Wu J, Song D, Liu W, Xu H, Jiang B, Zhang W, Wang J, Lee P. Proteomics, pathway array and signaling network-based medicine in cancer. Cell Div. 2009;4:20
125. Chang JT, Carvalho C, Mori S, Bild AH, Gatza ML, Wang Q, Lucas JE, Potti A, Febbo PG, West M, Nevins JR. A genomic strategy to elucidate modules of oncogenic pathway signaling networks. Mol Cell. 2009;34(1):104-14
126. He X, Wei Q, Sun M, Fu X, Fan S, Li Y. LS-CAP: an algorithm for identifying cytogenetic aberrations in hepatocellular carcinoma using microarray data. Front Biosci. 2006;11:1311-22
127. Poon TC, Wong N, Lai PB, Rattray M, Johnson PJ, Sung JJ. A tumor progression model for hepatocellular carcinoma: bioinformatic analysis of genomic data. Gastroenterology. 2006;131(4):1262-70
128. Ramos H, Shannon P, Brusniak MY, Kusebauch U, Moritz RL, Aebersold R. The Protein Information and Property Explorer 2: gaggle-like exploration of biological proteomic data within one webpage. Proteomics. 2012;11(1):154-8
129. Yin S, Li J, Hu C, Chen X, Yao M, Yan M, Jiang G, Ge C, Xie H, Wan D, Yang S, Zheng S, Gu J. CD133 positive hepatocellular carcinoma cells possess high capacity for tumorigenicity. Int J Cancer. 2007;120(7):1444-50
130. Zhang Y, Wang S, Li D, Zhnag J, Gu D, Zhu Y, He F. A systems biology-based classifier for hepatocellular carcinoma diagnosis. PLoS One. 2011;6(7):e22426
131. Hollywood K, Brison DR, Goodacre R. Metabolomics: current technologies and future trends. Proteomics. 2006;6(17):4716-23
132. Hsu CN, Lai JM, Liu CH, Tseng HH, Lin CY, Lin KT, Yeh HH, Sung TY, Hsu WL, Su LJ, Lee SA, Chen CH, Lee GC, Lee DT, Shiue YL, Yeh CW, Chang CH, Kao CY, Huang CY. Detection of the inferred interaction network in hepatocellular carcinoma from EHCO (Encyclopedia of Hepatocellular Carcinoma genes Online). BMC Bioinformatics. 2007;8:66
133. Su WH, Chao CC, Yeh SH, Chen DS, Chen PJ, Jou YS. OncoDB.HCC: an integrated oncogenomic database of hepatocellular carcinoma revealed aberrant cancer target genes and loci. Nucleic Acids Res. 2007;35(Database issue):D727-31
134. Kwofie SK, Schaefer U, Sundararajan VS, Bajic VB, Christoffels A. HCVpro: hepatitis C virus protein interaction database. Infect Genet Evol. 2011;11(8):1971-7
135. Combet C, Bettler E, Terreux R, Garnier N, Deleage G. The euHCVdb suite of in silico tools for investigating the structural impact of mutations in hepatitis C virus proteins. Infect Disord Drug Targets. 2009;9(3):272-8
136. Shin IT, Tanaka Y, Tateno Y, Mizokami M. Development and public release of a comprehensive hepatitis virus database. Hepatol Res. 2008;38(3):234-43
137. Kuiken C, Yusim K, Boykin L, Richardson R. The Los Alamos hepatitis C sequence database. Bioinformatics. 2005;21(3):379-84
138. Zhang Y, Yang C, Wang S, Chen T, Li M, Wang X, Li D, Wang K, Ma J, Wu S, Zhang X, Zhu Y, Wu J, He F. LiverAtlas: a unique integrated knowledge database for systems-level research of liver and hepatic disease. Liver Int. 2013
139. Yu XJ, Fang F, Tang CL, Yao L, Yu L, Yu L. dbHCCvar: a comprehensive database of human genetic variations in hepatocellular carcinoma. Hum Mutat. 2011;32(12):E2308-16
140. Ransohoff DF. Proteomics research to discover markers: what can we learn from Netflix? Clin Chem. 2011;56(2):172-6
141. Singhal A, Jayaraman M, Dhanasekaran DN, Kohli V. Molecular and serum markers in hepatocellular carcinoma: predictive tools for prognosis and recurrence. Crit Rev Oncol Hematol. 2011;82(2):116-40
142. Sreekumar A, Poisson LM, Rajendiran TM, Khan AP, Cao Q, Yu J, Laxman B, Mehra R, Lonigro RJ, Li Y, Nyati MK, Ahsan A, Kalyana-Sundaram S, Han B, Cao X, Byun J, Omenn GS, Ghosh D, Pennathur S, Alexander DC, Berger A, Shuster JR, Wei JT, Varambally S, Beecher C, Chinnaiyan AM. Metabolomic profiles delineate potential role for sarcosine in prostate cancer progression. Nature. 2009;457(7231):910-4
143. Jentzmik F, Stephan C, Lein M, Miller K, Kamlage B, Bethan B, Kristiansen G, Jung K. Sarcosine in prostate cancer tissue is not a differential metabolite for prostate cancer aggressiveness and biochemical progression. J Urol. 2011;185(2):706-11
144. Sreekumar A, Poisson LM, Rajendiran TM, Khan AP, Cao Q, Yu J, Laxman B, Mehra R, Lonigro RJ, Li Y, Nyati MK, Ahsan A, Kalyana-Sundaram S, Han B, Cao X, Byun J, Omenn GS, Ghoshd D, Pennathur S, Alexander DC, Berger A, Shuster JR, Wei JT, Varambally S, Beecher C, Chinnaiyan AM. Re: Florian Jentzmik, Carsten Stephan, Kurt Miller, et al. Sarcosine in urine after digital rectal examination fails as a marker in prostate cancer detection and identification of aggressive tumours. Eur Urol. 2010;58:12-8
145. Beger RD, Sun J, Schnackenberg LK. Metabolomics approaches for discovering biomarkers of drug-induced hepatotoxicity and nephrotoxicity. Toxicol Appl Pharmacol. 2010;243(2):154-66
146. Sanefuji K, Taketomi A, Iguchi T, Sugimachi K, Ikegami T, Yamashita Y, Gion T, Soejima Y, Shirabe K, Maehara Y. Significance of DNA polymerase delta catalytic subunit p125 induced by mutant p53 in the invasive potential of human hepatocellular carcinoma. Oncology. 2010;79(3-4):229-37
Author contact
![]() Corresponding author: Habtom W Ressom, PhD. Professor, Department of Oncology Lombardi Comprehensive Cancer Center, Georgetown University Medical Center, Room 175 Building D, 4000 Reservoir Road, NW, Washington, DC 20057. Email: hwredu Telephone: (202) 687-2283 Telefax: (202) 687-0227.
Corresponding author: Habtom W Ressom, PhD. Professor, Department of Oncology Lombardi Comprehensive Cancer Center, Georgetown University Medical Center, Room 175 Building D, 4000 Reservoir Road, NW, Washington, DC 20057. Email: hwredu Telephone: (202) 687-2283 Telefax: (202) 687-0227.