Impact Factor ISSN: 1837-9664

 Global reach, higher impact
J Cancer 2012; 3:292-302. doi:10.7150/jca.4502 This volume Cite
Research Paper
Trends of Incidence and Survival of Gastrointestinal Neuroendocrine Tumors in the United States: A Seer Analysis
Vassiliki L. Tsikitis1 ![]() , Betsy C. Wertheim2, Marlon A. Guerrero3
, Betsy C. Wertheim2, Marlon A. Guerrero3
1. Department of Surgery, Oregon Health & Science University, Portland, Oregon, USA;
2. Arizona Cancer Center, University of Arizona, Tucson, Arizona, USA;
3. Department of Surgery, University of Arizona, Tucson, Arizona, USA.
Received 2012-4-20; Accepted 2012-6-11; Published 2012-7-1
Abstract
OBJECTIVES: To examine trends in detection and survival of hollow viscus gastrointestinal neuroendocrine tumors (NETs) across time and geographic regions of the U.S.
METHODS: We used the Surveillance, Epidemiology and End Results (SEER) database to investigate 19,669 individuals with newly diagnosed gastrointestinal NETs. Trends in incidence were tested using Poisson regression. Cox proportional hazards regression was used to examine survival.
RESULTS: Incidence increased over time for NETs of all gastrointestinal sites (all P < 0.001), except appendix. Rates have risen faster for NETs of the small intestine and rectum than stomach and colon. Rectal NETs were detected at a faster pace among blacks than whites (P < 0.001) and slower in the East than other regions (P < 0.001). We observed that appendiceal and rectal NETs carry the best prognosis and survival of small intestinal and colon NETs has improved for both men and women. Colon NETs showed different temporal trends in survival according to geographic region (Pinteraction = 0.028). Improved prognosis was more consistent across the country for small intestinal NETs.
CONCLUSIONS: Incidence of gastrointestinal NETs has increased, accompanied by inconsistently improved survival for different anatomic sites among certain groups defined by race and geographic region.
Keywords: gastrointestinal neuroendocrine tumors, incidence, survival
Introduction
Carcinoid tumors of the gastrointestinal system are slow-growing, heterogeneous neuroendocrine tumors (NETs) with inconsistent clinicopathologic and biologic character [1]. The wide spectrum of symptomatology of the disease has made it impossible to equate all gastrointestinal NETs, and their treatment and prognosis are dependent on the anatomical location of the found lesion in addition to its histology and size. To obscure matters further, the 7th AJCC TNM classification has led to a parallel staging system from the established European Neuroendocrine Tumor Society (ENETS) [2].
Behavioral features such as smoking [3] and genetic factors [4] have been implicated in the etiology of these lesions; however, clear causative factors have not yet been delineated. Although there are reports on the incidence and prevalence of gastrointestinal NETs, the purpose of our study was to examine trends in detection and survival of hollow viscus NETs across time and geographic regions in the United States using the Surveillance, Epidemiology and End Results (SEER) database [5]. Our study included only primary NETs diagnosed between 1973 and 2008. To our knowledge this is the most comprehensive and up-to-date retrospective analysis of gastrointestinal NETs reported in the United States focusing on differences according to gender, race/ethnicity, age, and geographic region.
Materials and Methods
All 17 registries of the National Cancer Institute's SEER database (1973-2008), excluding Hurricane Katrina Impacted Louisiana Cases (cases diagnosed July-December 2005) were examined for gastrointestinal NETs [5]. Cases were selected based on primary site code: C160-9, stomach; C170-9, small intestine; C181 appendix; C180, C182-189, and C260, colon; and C199 and C209, rectum. The following histology codes were included in this analysis as NETs: 8240, malignant carcinoid tumor; 8241, enterochromaffin cell carcinoid; 8245, adenocarcinoid tumor; 8246, neuroendocrine carcinoma; and 8249, atypical carcinoid tumor. Non-first-tumors were excluded as well as stage 0 cases.
Racial/ethnic groups were categorized as the following: non-Hispanic white, Hispanic white, black, Native American (American Indian/Alaska Native), and Asian. Patients of “other” or unknown race were excluded from analysis, as well as those with unknown age at diagnosis or unknown historic stage (localized, regional, or distant). Localized disease is defined as NETs that have not spread outside the wall of the primary organ, regional metastasis includes NETs that have spread beyond the wall into surrounding tissue or lymph nodes, and distant metastasis includes NETs that have spread to tissue or organs away from the primary organ. Historic stage of diagnosis was used for analysis rather than other staging systems in an effort to maintain consistency across time. Thus, a total of 19,669 gastrointestinal NETs were included; we considered only hollow viscus NETs and excluded pancreatic NETs in this study, since pancreatic NETs are often staged using the same staging system for pancreatic cancer. Geographic regions were categorized according to SEER registry site: West (San Francisco-Oakland SMSA, Seattle/Puget Sound, Utah, San Jose-Monterey, Los Angeles, and California excluding SF/SJM/LA), South (Atlanta metropolitan, rural Georgia, Kentucky, and Louisiana), East (Connecticut and New Jersey), Midwest (Detroit metropolitan and Iowa), Southwest (New Mexico), and HI/AK (Hawaii and Alaska Natives). The latter two regions were excluded from region-stratified analyses due to small numbers.
Incidence rates each year between 1975 and 2008 were calculated using SEER*Stat 7.0.4 for the original 9 SEER registries, expressed per 100,000 person-years and age-adjusted to the 2000 US Standard Population (19 age groups - Census P25-1130) [6]. Separate rates were calculated by race (white and black) and geographic region. Trends in incidence rates over time were tested using Poisson regression, using year of diagnosis as a continuous variable. Multiplicative interactions with year of diagnosis were tested by including an interaction term with race or region in the model and conducting a likelihood ratio test.
Cox proportional hazards regression was used to compare disease-specific 5-year survival rates across decades, using the most recent decade (2000-2008) as the reference group. The SEER database codes patients surviving less than 1 month as having zero time of survival; we redefined this zero survival time as 0.1 months. Models were adjusted for age at diagnosis (continuous), historic stage, race/ethnicity, sex, and registry. Differences in patient characteristics according to stage at diagnosis were tested for each anatomic site separately using chi-square tests (sex, race/ethnicity, and geographic region) and one-way analysis of variance (ANOVA; age at diagnosis). Temporal trends were tested using year of diagnosis as a continuous variable. Stratified analyses were conducted for sex, race/ethnicity, and age (20-39 y, 40-59 y, 60-79 y, and 80+ y). Multiplicative interactions with year of diagnosis were tested by including an interaction term with sex, race, or age in the model and examining the P value of that term. All statistical analyses were performed using Stata 11.2 (StataCorp, College Station, TX).
Results
Demographics
Between 1975 and 2008 there were 19,669 individuals with primary hollow viscus gastrointestinal NETs identified in the SEER database who met our inclusion criteria. Of these, 1904 originated in the stomach, 7181 in the small intestine, 982 in the appendix, 2806 in the colon, and 6796 in the rectum (Table 1). The majority of individuals diagnosed with NETs were white and resided in the western part of the United States. There was no gender predilection for NETs of the small intestine or rectum, but NETs of the stomach, appendix, and colon affected women more commonly than men (chi-square test, P < 0.001, P < 0.001, and P = 0.010, respectively). Individuals diagnosed with NETs of the stomach, small intestine, or colon were older than those diagnosed with tumors of the appendix or rectum (one-way ANOVA, P < 0.001).
Characteristics of SEER gastrointestinal NET patients (n = 19,669): %.
| Stomach (n = 1904) | Small intestine (n = 7181) | Appendix (n = 982) | Colon (n = 2806) | Rectum (n = 6796) | |
|---|---|---|---|---|---|
| Sex | |||||
| Female | 58.5 | 47.8 | 59.8 | 54.8 | 49.3 |
| Male | 41.5 | 52.2 | 40.2 | 45.2 | 50.7 |
| Age (y) | |||||
| < 20 | 0.11 | 0.11 | 7.94 | 0.18 | 0.21 |
| 20-39 | 7.20 | 4.47 | 35.1 | 4.38 | 8.99 |
| 40-59 | 37.1 | 35.8 | 38.8 | 36.5 | 55.8 |
| 60-79 | 44.1 | 48.6 | 15.5 | 44.9 | 32.1 |
| 80+ | 11.5 | 11.0 | 2.65 | 14.0 | 2.87 |
| mean ± SD | 61.4 ± 14.6 | 62.8 ± 13.5 | 43.4 ± 17.4 | 63.3 ± 13.9 | 55.6 ± 12.3 |
| Year of diagnosis | |||||
| 2000s | 73.8 | 62.5 | 50.1 | 64.1 | 74.1 |
| 1990s | 19.3 | 21.5 | 18.5 | 21.9 | 19.9 |
| 1980s | 5.04 | 11.2 | 12.9 | 9.19 | 4.53 |
| 1970s | 1.84 | 4.86 | 18.4 | 4.81 | 1.44 |
| Stage | |||||
| Localized | 77.9 | 34.4 | 61.2 | 31.7 | 93.2 |
| Regional | 8.14 | 37.1 | 26.9 | 30.3 | 2.74 |
| Distant | 14.0 | 28.5 | 11.9 | 38.0 | 4.06 |
| Race/ethnicity | |||||
| Non-Hispanic white | 64.4 | 77.9 | 81.3 | 75.0 | 51.5 |
| Hispanic white | 14.8 | 5.67 | 6.11 | 6.24 | 9.64 |
| Black | 12.5 | 13.1 | 8.04 | 13.2 | 19.0 |
| Asian | 6.25 | 2.49 | 3.26 | 3.99 | 14.6 |
| Other/unknown | 2.05 | 0.91 | 1.32 | 1.64 | 5.28 |
| Region | |||||
| West | 47.8 | 45.1 | 42.0 | 46.5 | 52.2 |
| South | 14.6 | 14.2 | 12.2 | 14.0 | 12.9 |
| East | 15.7 | 15.5 | 23.3 | 14.3 | 13.1 |
| Midwest | 14.5 | 19.9 | 17.4 | 20.4 | 13.3 |
| Southwest | 4.31 | 3.50 | 2.85 | 2.85 | 2.85 |
| HI/AK | 3.10 | 1.91 | 2.24 | 1.96 | 5.61 |
Incidence
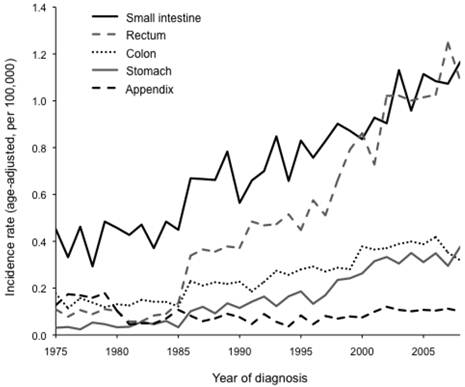
The overall incidence rate of gastrointestinal NETs has increased since 1975 and is evident for all gastrointestinal organ sites (P < 0.001), except NETs originating in the appendix (P = 0.466; Figure 1). The rise in disease detection was markedly higher for tumors of the small intestine and rectum than for tumors of the stomach and colon, but it was significant for both whites and blacks at all four organ sites (P < 0.001). We observed a significant race-by-year interaction for NETs of the rectum, such that the incidence rate increased at a higher pace among blacks than whites (P < 0.001). No other substantial race-by-year interactions were detected. Furthermore, incidence rates significantly increased across all geographic regions (P < 0.001), and some region-by-year interactions were observed. For small intestinal NETs, incidence rates increased faster in the Midwest than in the other three regions (P = 0.040). For rectal NETs, incidence rates increased more slowly in the East than in the other three regions (P < 0.001). In contrast, no significant region-by-year interactions were observed for NETs of the stomach or colon.
Incidence rates (age-adjusted, per 100,000) for neuroendocrine tumors (NETs) between 1975 and 2008 in 9 SEER registries. Incidence rates have significantly increased over time for NETs of the small intestine, rectum, colon, and stomach (all P < 0.001) but not for NETs of the appendix (P = 0.466).
We found some significant differences in stage of presentation according to site of disease. The majority of individuals with NETs of the stomach, rectum, and appendix were diagnosed with localized disease, whereas detection of small intestinal and colon NETs was more evenly distributed among the three disease stages (Table 1). All sites, except stomach, showed differential stage at diagnosis according to geographic region (Table 2). For example, the West had a disproportionately high number of distant appendiceal NETs, while the South and Midwest had more regional cases, and the East had more localized cases. Furthermore, the South had a disproportionately high number of localized small intestinal NETs, along with fewer distant rectal NETs but more distant colon NETs. In addition, the Midwest had a disproportionately high number of distant rectal NETs.
Characteristics of SEER gastrointestinal NET patients, by stage at diagnosis (n = 19,669): %.
| Site | Characteristic | Localized | Regional | Distant | P1 |
|---|---|---|---|---|---|
| Appendix | |||||
| Female | 58.9 | 61.0 | 61.5 | 0.778 | |
| Age (y) | |||||
| < 40 | 51.3 | 37.9 | 12.8 | ||
| 40-59 | 35.4 | 42.8 | 47.0 | ||
| 60-79 | 12.0 | 14.8 | 35.0 | ||
| 80+ | 1.33 | 4.55 | 5.13 | ||
| Race/ethnicity | 0.020 | ||||
| Non-Hispanic white | 83.0 | 78.0 | 79.5 | ||
| Hispanic white | 6.49 | 5.30 | 5.98 | ||
| Black | 5.99 | 13.3 | 6.84 | ||
| Asian | 3.49 | 1.89 | 5.13 | ||
| Other/unknown | 1.00 | 1.52 | 2.56 | ||
| Region | 0.001 | ||||
| West | 40.6 | 40.9 | 51.3 | ||
| South | 10.2 | 18.2 | 9.40 | ||
| East | 27.8 | 16.3 | 16.2 | ||
| Midwest | 16.5 | 19.7 | 17.1 | ||
| Southwest | 2.83 | 3.03 | 2.56 | ||
| HI/AK | 2.16 | 1.89 | 3.42 | ||
| Small intestine | |||||
| Female | 46.5 | 48.0 | 49.1 | 0.212 | |
| Age (y) | |||||
| < 40 | 5.38 | 4.06 | 4.30 | ||
| 40-59 | 34.2 | 37.3 | 35.9 | ||
| 60-79 | 48.2 | 47.2 | 51.1 | ||
| 80+ | 12.3 | 11.5 | 8.74 | ||
| Race/ethnicity | < 0.001 | ||||
| Non-Hispanic white | 70.6 | 81.7 | 81.6 | ||
| Hispanic white | 6.55 | 4.85 | 5.67 | ||
| Black | 17.6 | 11.1 | 10.2 | ||
| Asian | 3.44 | 1.95 | 2.05 | ||
| Other/unknown | 1.78 | 0.41 | 0.49 | ||
| Region | < 0.001 | ||||
| West | 43.4 | 44.0 | 48.4 | ||
| South | 16.9 | 13.6 | 11.6 | ||
| East | 15.1 | 17.3 | 13.6 | ||
| Midwest | 18.6 | 20.0 | 21.3 | ||
| Southwest | 3.84 | 3.42 | 3.18 | ||
| HI/AK | 2.14 | 1.69 | 1.91 | ||
| Rectum | |||||
| Female | 49.7 | 48.9 | 40.9 | 0.018 | |
| Age (y) | |||||
| < 40 | 9.47 | 7.53 | 3.99 | ||
| 40-59 | 56.9 | 39.8 | 42.8 | ||
| 60-79 | 31.1 | 45.7 | 45.7 | ||
| 80+ | 2.54 | 6.99 | 7.61 | ||
| Race/ethnicity | < 0.001 | ||||
| Non-Hispanic white | 51.0 | 58.6 | 57.3 | ||
| Hispanic white | 9.65 | 9.14 | 9.78 | ||
| Black | 19.0 | 16.7 | 22.8 | ||
| Asian | 14.8 | 14.5 | 8.70 | ||
| Other/unknown | 5.57 | 1.08 | 1.45 | ||
| Region | < 0.001 | ||||
| West | 52.2 | 50.5 | 54.0 | ||
| South | 13.1 | 12.9 | 7.97 | ||
| East | 13.0 | 14.0 | 14.9 | ||
| Midwest | 12.9 | 18.8 | 18.1 | ||
| Southwest | 2.84 | 1.61 | 3.99 | ||
| HI/AK | 5.90 | 2.15 | 1.09 | ||
| Stomach | |||||
| Female | 63.3 | 40.7 | 41.7 | < 0.001 | |
| Age (y) | |||||
| < 40 | 7.48 | 5.81 | 7.14 | ||
| 40-59 | 38.8 | 30.3 | 31.6 | ||
| 60-79 | 42.8 | 50.3 | 48.1 | ||
| 80+ | 11.0 | 13.6 | 13.2 | ||
| Race/ethnicity | 0.001 | ||||
| Non-Hispanic white | 65.5 | 60.0 | 60.9 | ||
| Hispanic white | 14.8 | 13.6 | 15.4 | ||
| Black | 12.3 | 11.6 | 14.3 | ||
| Asian | 5.06 | 14.2 | 8.27 | ||
| Other/unknown | 2.36 | 0.65 | 1.13 | ||
| Region | 0.167 | ||||
| West | 47.3 | 49.0 | 50.0 | ||
| South | 15.4 | 11.0 | 12.0 | ||
| East | 15.8 | 20.0 | 12.8 | ||
| Midwest | 14.1 | 12.9 | 17.7 | ||
| Southwest | 4.59 | 1.94 | 4.14 | ||
| HI/AK | 2.83 | 5.16 | 3.38 | ||
| Colon | |||||
| Female | 51.8 | 58.4 | 54.4 | 0.020 | |
| Age (y) | |||||
| < 40 | 7.19 | 3.53 | 3.19 | ||
| 40-59 | 47.3 | 32.6 | 30.7 | ||
| 60-79 | 37.3 | 43.8 | 52.1 | ||
| 80+ | 8.20 | 20.1 | 14.0 | ||
| Race/ethnicity | < 0.001 | ||||
| Non-Hispanic white | 64.0 | 77.7 | 81.9 | ||
| Hispanic white | 7.64 | 5.76 | 5.45 | ||
| Black | 17.4 | 12.7 | 10.1 | ||
| Asian | 6.74 | 3.29 | 2.25 | ||
| Other/unknown | 4.16 | 0.59 | 0.38 | ||
| Region | < 0.001 | ||||
| West | 51.1 | 40.7 | 47.3 | ||
| South | 13.0 | 14.3 | 14.5 | ||
| East | 13.2 | 16.8 | 13.3 | ||
| Midwest | 17.4 | 22.2 | 21.4 | ||
| Southwest | 2.81 | 4.23 | 1.78 | ||
| HI/AK | 2.47 | 1.76 | 1.69 |
1 P value from chi-square test (sex, race/ethnicity, and geographic region) or one-way analysis of variance (age at diagnosis).
Survival Analysis
Several factors were noted to affect disease-free survival, including tumor site. NETs of the rectum and appendix had the best prognosis, with a 95.6% and 90.3% 5-year disease-specific survival, respectively (Table 3). The 5-year survival for other gastrointestinal NETs was 86.2% for small intestine, 82.7% for stomach, and 67.4% for colon. Prognosis was also evaluated by decade of diagnosis. Although survival for individuals with NETs of the appendix appeared to have worsened since the 1970s in the crude model, there was no significant trend in survival rates over time after adjusting for age, stage, race/ethnicity, sex, and registry site (Ptrend = 0.779). A lack of survival difference over time was also noted for NETs of the rectum (Ptrend = 0.096) and stomach (Ptrend = 0.396). Notably, survival has significantly improved every decade for NETs of the small intestine (Ptrend < 0.001) and colon (Ptrend = 0.002).
Cox proportional hazards models for disease-specific 5-year survival in each decade.
| n deaths/total (%) | Crude HR (95% CI) | Adjusted1 HR (95% CI) | |
|---|---|---|---|
| Appendix | 95/982 (9.67) | ||
| 2000s | 45/492 (9.15) | 1.00 | 1.00 |
| 1990s | 35/182 (19.2) | 1.73 (1.11-2.69) | 2.09 (1.16-3.77) |
| 1980s | 11/127 (8.66) | 0.75 (0.69-1.46) | 0.80 (0.36-1.79) |
| 1970s | 4/181 (2.21) | 0.18 (0.07-0.51) | 1.08 (0.34-3.47) |
| Ptrend | 0.004 | 0.779 | |
| Small intestine | 991/7181 (13.8) | ||
| 2000s | 450/4488 (10.0) | 1.00 | 1.00 |
| 1990s | 291/1540 (18.9) | 1.47 (1.27-1.71) | 1.43 (1.20-1.71) |
| 1980s | 170/804 (21.1) | 1.80 (1.50-2.14) | 1.70 (1.38-2.09) |
| 1970s | 80/349 (21.1) | 1.97 (1.56-2.51) | 1.82 (1.40-2.36) |
| Ptrend | < 0.001 | < 0.001 | |
| Rectum | 300/6796 (4.41) | ||
| 2000s | 169/5037 (3.36) | 1.00 | 1.00 |
| 1990s | 18/1353 (5.99) | 1.45 (1.11-1.89) | 1.45 (1.07-1.97) |
| 1980s | 36/308 (11.7) | 2.99 (2.09-4.28) | 1.24 (0.82-1.88) |
| 1970s | 14/98 (14.3) | 3.73 (2.16-6.44) | 1.09 (0.59-2.03) |
| Ptrend | < 0.001 | 0.096 | |
| Stomach | 330/1904 (17.3) | ||
| 2000s | 216/1405 (15.4) | 1.00 | 1.00 |
| 1990s | 75/368 (20.4) | 1.15 (0.89-1.50) | 1.01 (0.74-1.37) |
| 1980s | 27/96 (28.1) | 1.81 (1.21-2.69) | 0.93 (0.60-1.45) |
| 1970s | 12/35 (34.3) | 2.41 (1.34-4.30) | 1.45 (0.78-2.68) |
| Ptrend | < 0.001 | 0.396 | |
| Colon | 916/2806 (32.6) | ||
| 2000s | 516/1798 (28.7) | 1.00 | 1.00 |
| 1990s | 236/615 (38.4) | 1.21 (1.04-1.41) | 1.10 (0.92-1.31) |
| 1980s | 106/258 (41.1) | 1.38 (1.12-1.70) | 1.21 (0.96-1.53) |
| 1970s | 58/135 (43.0) | 1.63 (1.24-2.14) | 1.37 (1.02-1.83) |
| Ptrend | < 0.001 | 0.002 |
1 Adjusted for age (continuous), stage (localized vs. regional vs. distant), race/ethnicity (non-Hispanic white vs. Hispanic white vs. black vs. vs. Asian vs. other/unknown), sex, and registry site.
We stratified the analysis according to gender, race/ethnicity, age, and geographic region. After stratification by gender, 5-year survival for NETs of the small intestine improved over time for both women (Ptrend < 0.001) and men (Ptrend < 0.001; Table 4). The same was true for NETs of the colon, though the trend was only marginally significant for women (Ptrend = 0.054, women; Ptrend = 0.010, men). No clear trends were observed for women or men for NETs of other organ sites.
Cox proportional hazards models for disease-specific 5-year survival in each decade, stratified by gender.
| Women HR (95% CI)1 | Men HR (95% CI)1 | Pinteraction2 | |
|---|---|---|---|
| Appendix | |||
| 2000s | 1.00 | 1.00 | |
| 1990s | 1.64 (0.74-3.60) | 3.02 (1.02-8.96) | |
| 1980s | 0.64 (0.23-1.78) | 0.97 (0.22-4.21) | |
| 1970s | 0.62 (0.12-3.22) | 1.91 (0.32-11.4) | |
| Ptrend | 0.303 | 0.356 | 0.344 |
| Small intestine | |||
| 2000s | 1.00 | 1.00 | |
| 1990s | 1.47 (1.14-1.88) | 1.42 (1.11-1.82) | |
| 1980s | 1.55 (1.15-2.10) | 1.83 (1.37-2.44) | |
| 1970s | 1.66 (1.14-2.43) | 2.11 (1.46-3.05) | |
| Ptrend | < 0.001 | < 0.001 | 0.168 |
| Rectum | |||
| 2000s | 1.00 | 1.00 | |
| 1990s | 1.57 (0.98-2.53) | 1.41 (0.93-2.14) | |
| 1980s | 0.91 (0.44-1.87) | 1.51 (0.89-2.56) | |
| 1970s | 1.36 (0.46-3.97) | 1.08 (0.50-2.33) | |
| Ptrend | 0.107 | 0.344 | 0.044 |
| Stomach | |||
| 2000s | 1.00 | 1.00 | |
| 1990s | 1.32 (0.80-2.18) | 0.95 (0.64-1.42) | |
| 1980s | 1.22 (0.60-2.46) | 0.74 (0.40-1.40) | |
| 1970s | 1.33 (0.53-3.36) | 1.43 (0.59-3.50) | |
| Ptrend | 0.369 | 0.758 | 0.336 |
| Colon | |||
| 2000s | 1.00 | 1.00 | |
| 1990s | 1.04 (0.82-1.30) | 1.18 (0.89-1.56) | |
| 1980s | 1.27 (0.94-1.71) | 1.16 (0.79-1.71) | |
| 1970s | 1.15 (0.77-1.71) | 1.78 (1.16-2.75) | |
| Ptrend | 0.054 | 0.010 | 0.910 |
1 Adjusted for age (continuous), stage (localized vs. regional vs. distant), race/ethnicity (non-Hispanic white vs. Hispanic white vs. black vs. Native American vs. Asian), and registry site.
2 P value for interaction term between sex and year of diagnosis (continuous) in Cox proportional hazards model.
Furthermore, we observed no significant year-by-race/ethnicity interactions (Table 5). However, improvement in survival for NETs of the small intestine was evident in non-Hispanic whites only (Ptrend < 0.001). In contrast, survival for NETs of the colon significantly improved for both non-Hispanic whites (Ptrend = 0.014) and blacks (Ptrend = 0.031). Similarly, although no significant year-by-age interactions were detected, improvement in survival for NETs of the small intestine was most evident in patients age 40-59 years (Ptrend = 0.003) and 60-79 years (Ptrend < 0.001; Table 6). Likewise, improvement in survival for NETs of the colon was strongest in patients age 40-59 years (Ptrend = 0.009).
Cox proportional hazards models for disease-specific 5-year survival in each decade, stratified by race/ethnicity.
| Non-Hispanic white HR (95% CI)1 | Hispanic white HR (95% CI)1 | Black HR (95% CI)1 | Asian HR (95% CI)1 | Pinteraction2 | |
|---|---|---|---|---|---|
| Small intestine | |||||
| 2000s | 1.00 | 1.00 | 1.00 | 1.00 | |
| 1990s | 1.35 (1.11-1.64) | 2.00 (1.02-3.90) | 1.41 (0.84-2.36) | 2.35 (0.64-8.59) | |
| 1980s | 1.72 (1.37-2.15) | 1.35 (0.41-4.41) | 1.36 (0.73-2.53) | 1.53 (0.38-6.24) | |
| 1970s | 1.97 (1.49-2.60) | n/a | 1.01 (0.38-2.68) | n/a | |
| Ptrend | < 0.001 | 0.467 | 0.235 | 0.423 | 0.957 |
| Rectum | |||||
| 2000s | 1.00 | 1.00 | 1.00 | 1.00 | |
| 1990s | 1.56 (1.03-2.38) | 1.29 (0.36-4.70) | 1.61 (0.85-3.07) | 0.97 (0.29-3.25) | |
| 1980s | 1.05 (0.62-1.78) | n/a | 1.70 (0.71-4.07) | 4.74 (0.87-25.8) | |
| 1970s | 1.62 (0.81-3.23) | n/a | 0.59 (0.13-2.70) | n/a | |
| Ptrend | 0.083 | 0.108 | 0.992 | 0.310 | 0.658 |
| Stomach | |||||
| 2000s | 1.00 | 1.00 | 1.00 | 1.00 | |
| 1990s | 1.24 (0.84-1.85) | 0.71 (0.29-1.75) | 0.58 (0.23-1.46) | 1.22 (0.46-3.26) | |
| 1980s | 1.03 (0.59-1.81) | n/a | 1.06 (0.31-3.62) | 0.49 (0.12-1.94) | |
| 1970s | 1.50 (0.78-2.92) | n/a | n/a | 14.2 (1.37-148.) | |
| Ptrend | 0.317 | 0.315 | 0.584 | 0.850 | 0.517 |
| Colon | |||||
| 2000s | 1.00 | 1.00 | 1.00 | 1.00 | |
| 1990s | 1.09 (0.90-1.33) | 1.66 (0.75-3.64) | 1.30 (0.72-2.33) | 0.79 (0.31-2.02) | |
| 1980s | 1.19 (0.92-1.53) | n/a | 3.20 (1.41-7.27) | 0.15 (0.03-0.81) | |
| 1970s | 1.34 (0.99-1.83) | n/a | 1.33 (0.30-5.95) | 1.15 (0.14-9.77) | |
| Ptrend | 0.014 | 0.117 | 0.031 | 0.209 | 0.240 |
Note: Appendiceal NETs were excluded from this analysis due to small numbers.
1 Adjusted for age (continuous), stage (localized vs. regional vs. distant), sex, and registry site
2 P value for interaction term between race and year of diagnosis (continuous) in Cox proportional hazards model
Cox proportional hazards models for disease-specific 5-year survival in each decade, stratified by age.
| < 40 y HR (95% CI)1 | 40-59 y HR (95% CI)1 | 60-79 y HR (95% CI)1 | 80+ y HR (95% CI)1 | Pinteraction2 | |
|---|---|---|---|---|---|
| Small intestine | |||||
| 2000s | 1.00 | 1.00 | 1.00 | 1.00 | |
| 1990s | 1.08 (0.27-4.24) | 1.36 (0.93-1.99) | 1.52 (1.21-1.92) | 1.29 (0.86-1.93) | |
| 1980s | 0.82 (0.13-4.95) | 1.42 (0.89-2.26) | 1.84 (1.41-2.41) | 1.55 (0.95-2.52) | |
| 1970s | 3.35 (0.72-15.6) | 2.16 (1.29-3.62) | 1.64 (1.15-2.35) | 1.38 (0.65-2.91) | |
| Ptrend | 0.306 | 0.003 | < 0.001 | 0.140 | 0.183 |
| Rectum | |||||
| 2000s | 1.00 | 1.00 | 1.00 | 1.00 | |
| 1990s | 0.26 (0.01-6.63) | 1.42 (0.85-2.37) | 1.56 (0.98-2.50) | 1.43 (0.35-5.86) | |
| 1980s | n/a | 1.61 (0.78-3.33) | 1.18 (0.65-2.14) | 0.78 (0.11-5.33) | |
| 1970s | n/a | 1.09 (0.24-4.91) | 1.27 (0.59-2.70) | n/a | |
| Ptrend | 0.123 | 0.173 | 0.177 | 0.718 | 0.711 |
| Stomach | |||||
| 2000s | 1.00 | 1.00 | 1.00 | 1.00 | |
| 1990s | n/a | 0.50 (0.22-1.11) | 1.30 (0.87-1.95) | 1.15 (0.51-2.60) | |
| 1980s | n/a | 0.77 (0.26-2.28) | 0.74 (0.38-1.42) | 1.57 (0.47-5.23) | |
| 1970s | n/a | 0.49 (0.12-1.97) | 1.38 (0.56-3.40) | 2.35 (0.39-14.3) | |
| Ptrend | n/a | 0.320 | 0.377 | 0.430 | 0.540 |
| Colon | |||||
| 2000s | 1.00 | 1.00 | 1.00 | 1.00 | |
| 1990s | 1.32 (0.38-4.56) | 1.22 (0.82-1.81) | 1.04 (0.82-1.31) | 1.04 (0.70-1.55) | |
| 1980s | n/a | 1.41 (0.86-2.30) | 1.08 (0.78-1.50) | 1.16 (0.70-1.92) | |
| 1970s | n/a | 1.81 (1.01-3.26) | 1.07 (0.72-1.61) | 1.33 (0.68-2.61) | |
| Ptrend | 0.796 | 0.009 | 0.195 | 0.396 | 0.786 |
Note: Appendiceal NETs were excluded from this analysis due to small numbers.
1 Adjusted for stage (localized vs. regional vs. distant), race/ethnicity (non-Hispanic white vs. Hispanic white vs. black vs. Native American vs. Asian), and registry site.
2 P value for interaction term between age (continuous) and year of diagnosis (continuous) in Cox proportional hazards model.
Region-stratified analyses were restricted to NETs of the small intestine and colon due to limited numbers of cases for other organ NETs. We observed a significant year-by-region interaction for NETs of the colon (P = 0.028), for which survival improvement across time was evident in the Midwest (Ptrend = 0.002) and South (Ptrend = 0.012), but not the West (Ptrend = 0.553) or East (Ptrend = 0.165; Table 7). In contrast, survival for NETs of the small intestine improved in all geographic regions, though the trend was not significant in the South (Ptrend = 0.060).
Cox proportional hazards models for disease-specific 5-year survival in each decade, stratified by geographic region.
| West HR (95% CI)1 | South HR (95% CI)1 | East HR (95% CI)1 | Midwest HR (95% CI)1 | Pinteraction2 | |
|---|---|---|---|---|---|
| Small intestine | |||||
| 2000s | 1.00 | 1.00 | 1.00 | 1.00 | |
| 1990s | 1.57 (1.23-2.00) | 1.64 (0.64-4.20) | 1.49 (0.81-2.72) | 1.21 (0.88-1.67) | |
| 1980s | 1.79 (1.28-2.50) | 2.41 (0.88-6.57) | 1.92 (1.02-3.62) | 1.47 (1.05 (2.07) | |
| 1970s | 1.89 (1.25-2.86) | 4.11 (1.18-14.3) | 1.57 (0.70-3.54) | 1.74 (1.14-2.67) | |
| Ptrend | < 0.001 | 0.060 | 0.041 | 0.001 | 0.865 |
| Colon | |||||
| 2000s | 1.00 | 1.00 | 1.00 | 1.00 | |
| 1990s | 0.90 (0.70-1.16) | 2.45 (1.18-5.11) | 0.97 (0.55-1.72) | 1.37 (0.97-1.93) | |
| 1980s | 0.84 (0.54-1.30) | 3.37 (1.46-7.77) | 0.84 (0.38-1.88) | 1.61 (1.10-2.36) | |
| 1970s | 0.72 (0.42-1.22) | 1.85 (0.53-6.51) | 1.70 (0.80-3.65) | 2.01 (1.23-3.29) | |
| Ptrend | 0.553 | 0.012 | 0.165 | 0.002 | 0.028 |
Note: Organ sites with insufficient numbers were excluded from analysis, as were the Southwest and HI/AK regions.
1 Adjusted for age at diagnosis (continuous), stage (localized vs. regional vs. distant), sex (female vs. male), race/ethnicity (non-Hispanic white vs. Hispanic white vs. black vs. Native American vs. Asian), and registry site.
2 P value for interaction term between age (continuous) and year of diagnosis (continuous) in Cox proportional hazards model.
Discussion
Our study based on the latest SEER data examines the incidence and survival of gastrointestinal NETs according to gender, race/ethnicity, age, geographic region, and time. To our knowledge this study is one of the largest and most up-to-date reports of primary occurrences of gastrointestinal NETs stratified over time and geographic regions. As reported in other studies, our examination reveals increased incidence of gastrointestinal NETs [7], particularly of the small intestine and colon. This increase may partially be attributed to improved detection through advancements in endoscopic and radiologic imaging techniques. The rate of increase, however, varied across regions; incidence of small intestinal NETs in the Midwest increased most rapidly compared with other regions, whereas rectal NETs in the East had the slowest increase. The differences observed among regions may be influenced by external factors, such as completeness of data acquisition, rather than a true difference in the epidemiology of the disease.
Yao et al [8] reported an increase in incidence and prevalence of NETs without significant differences by gender. However, we found that overall prevalence of stomach, appendiceal, and colon NETs was higher in women than men, a finding consistent with other reports [9]. Our study demonstrated a significant increase in the incidence of rectal NETs that was more substantial among blacks than whites, an observation in agreement with other studies [10, 11]. Although we did not investigate the cause of this racial disparity, prior published reports have demonstrated that minorities undergo less frequent screening colonoscopy than whites, but they are more likely to have sigmoidoscopies performed at appropriate intervals [12].
We found that NETs of the rectum and appendix had the best prognosis, with 95.6% and 90.3% 5-year disease-specific survival, respectively, whereas survival for the remaining gastrointestinal NETs was 86.2% for small intestine, 82.7% for stomach, and 67.4% for colon. These findings agree with other studies [13, 14] that have shown that NETs of the colon and stomach seem to have worse prognosis. What is promising is that survival rates for colon NETs seem to have significantly improved over time. Also, since surgery is the mainstay treatment for colon NETs, an increase in screening colonoscopies [15] might have led to earlier detection of those lesions and, therefore, to a speedier definite treatment. The increased number of screening colonoscopies perhaps also explains how improved survival in colon NETs is seen primarily among patients age 40-59 years, when first colonoscopies are most likely to occur. We also observed an improvement in survival of small intestinal NETs over time, whereas survival rates were more static for stomach, appendiceal, and rectal NETs. However, the improved survival for colon and small intestinal NETs was limited to non-Hispanic whites and not observed among blacks or Hispanics. One study examined the impact of racial clustering and segregation on access to cancer specialists and concluded that there is an inverse relationship between the number of specialists and the number of minorities in various geographic regions [16]. Regarding the prognostic outcomes of gastrointestinal NETs across regions, we observed a statistically significant improvement in the prognosis of small intestinal NETs except for patients in the South. This disparity is difficult to interpret and it could be secondary to multiple etiologies that were not investigated in our analyses; therefore, no conclusions can be drawn at this juncture.
This study has certain limitations inherent to all studies that rely on retrospective data. Incomplete data may have had the greatest impact on our results. For instance, the SEER database may lack information on a high number of gastrointestinal NETs that were not registered, secondary to the fact that the vast majority of these lesions are benign. This gap in data availability could affect our results and conclusions. Also, the influence of geographic region is limited since the SEER registry does not incorporate information from every state, and there is disproportionate representation of patients in the West, which could also influence our gender and racial analyses. However, the SEER database is one of the largest registries that allow comparative analysis of individual tumors. This study is also limited by differences in data input over time, specifically stage of presentation. To account for this, we attempted to standardize stage of presentation by excluding newer staging classifications. Furthermore, we excluded non-first-tumors, including multiple NET sites reported on the same individual after the initial diagnosis, in order to examine accurately the incidence of these lesions.
Conclusion
To conclude, gastrointestinal NETs are a disease entity with increased incidence rates among all anatomic sites, except for appendiceal NETs. However, disparities are seen in survival rates according to anatomic location, race/ethnicity, and geographic region. Established national guidelines of detection, staging, and treatment could perhaps provide a more-even prognostic stand among patients afflicted with the disease.
Competing Interests
The authors have declared that no competing interest exists.
References
1. Kloppel G, Perren A, Heitz PU. The gastroenteropancreatic neuroendocrine cell system and its tumors: the WHO classification. Ann N Y Acad Sci. 2004;1014:13-27
2. Kloppel G, Rindi G, Perren A, Komminoth P, Klimstra DS. The ENETS and AJCC/UICC TNM classifications of the neuroendocrine tumors of the gastrointestinal tract and the pancreas: a statement. Virchows Arch. 2010;456(6):595-597
3. Kaerlev L, Teglbjaerg PS, Sabroe S. et al. The importance of smoking and medical history for development of small bowel carcinoid tumor: a European population-based case-control study. Cancer Causes Control. 2002;13(1):27-34
4. Calender A. Molecular genetics of neuroendocrine tumors. Digestion. 2000;62(Suppl 1):3-18
5. Research Data (1973-2008), National Cancer Institute, DCCPS, Surveillance Research Program, Cancer Statistics Branch, released April 2011, based on the November 2010 submission. SEER. http://www.seer.cancer.gov
6. SEER*Stat Database: Incidence - SEER 9 Regs Research Data, Nov 2010 Sub (1973-2008) Katrina/Rita Population Adjustment - Linked To County Attributes - Total US, 1969-2009 Counties, National Cancer Institute, DCCPS, Surveillance Research Program, Cancer Statistics Branch, released April 2011, based on the November 2010 submission. SEER. http://www.seer.cancer.gov
7. Ellis L, Shale MJ, Coleman MP. Carcinoid tumors of the gastrointestinal tract: trends in incidence in England since 1971. Am J Gastroenterol. 2010;105(12):2563-2569
8. Yao JC, Hassan M, Phan A. et al. One hundred years after "carcinoid": epidemiology of and prognostic factors for neuroendocrine tumors in 35,825 cases in the United States. J Clin Oncol. 2008;26(18):3063-3072
9. Hauso O, Gustafsson BI, Kidd M. et al. Neuroendocrine tumor epidemiology: contrasting Norway and North America. Cancer. 2008;113(10):2655-2664
10. Avenel P, McKendrick A, Silapaswan S. et al. Gastrointestinal: an increasing incidence of rectal distribution. Am Surg. 2010;76(7):759-763
11. Strosberg JR, Coppola D, Klimstra DS. et al. The NANETS consensus guidelines for the diagnosis and management of poorly differentiated (high-grade) extrapulmonary neuroendocrine carcinomas. Pancreas. 2010;39(6):799-800
12. Dimou A, Syrigos KN, Saif MW. Disparities in colorectal cancer in African-Americans vs Whites: before and after diagnosis. World J Gastroenterol. 2009;15(30):3734-3743
13. Modlin IM, Lye KD, Kidd M. A 5-decade analysis of 13,715 carcinoid tumors. Cancer. 2003;97(4):934-959
14. Landry CS, Brock G, Scoggins CR, McMasters KM, Martin RC 2nd. Proposed staging system for colon carcinoid tumors based on an analysis of 2,459 patients. J Am Coll Surg. 2008;207(6):874-881
15. Edwards BK, Ward E, Kohler BA. et al. Annual report to the nation on the status of cancer, 1975-2006, featuring colorectal cancer trends and impact of interventions (risk factors, screening, and treatment) to reduce future rates. Cancer. 2010;116(3):544-573
16. Hayanga AJ, Waljee AK, Kaiser HE, Chang DC, Morris AM. Racial clustering and access to colorectal surgeons, gastroenterologists, and radiation oncologists by African Americans and Asian Americans in the United States: a county-level data analysis. Arch Surg. 2009;144(6):532-535
Author contact
![]() Corresponding author: Vassiliki L. Tsikitis, MD, 3191 SW Sam Jackson Park Rd. Portland, OR 97239. Phone: (503) 494-8820 Fax: (503) 494-8884. tsikitisedu
Corresponding author: Vassiliki L. Tsikitis, MD, 3191 SW Sam Jackson Park Rd. Portland, OR 97239. Phone: (503) 494-8820 Fax: (503) 494-8884. tsikitisedu