Impact Factor ISSN: 1837-9664

 Global reach, higher impact
J Cancer 2020; 11(14):4132-4144. doi:10.7150/jca.40621 This issue Cite
Research Paper
The Prediction of Survival in Hepatocellular Carcinoma Based on A Four Long Non-coding RNAs Expression Signature
Zongxing Yang1*, Yuhan Yang2*, Gang Zhou2, Yan Luo2, Wenjun Yang2, Youliang Zhou2, Jin Yang2 ![]()
1. The Second Department of Infectious Disease, Xixi Hospital of Hangzhou, the Affiliated Hospital of Zhejiang Chinese Medical University, Zhejiang Chinese Medical University, Hangzhou, Zhejiang 310023, P.R. China.
2. Center for Translational Medicine, the affiliated hospital of Hangzhou Normal University, Hangzhou Normal University, Hangzhou, Zhejiang 310015, P.R. China.
* These authors contributed equally to this work.
Received 2019-9-25; Accepted 2020-3-23; Published 2020-4-12
Abstract
Prognostic stratification in hepatocellular carcinoma (HCC) patients is still challenging. Long non-coding RNAs (lncRNAs) have been proven to play a crucial role in tumorigenesis and progression of cancers. The aim of this study is to develop a useful prognostic index based on lncRNA signature to identify patients at high risk of disease progression. We obtained lncRNA expression profiles from three publicly available datasets from Gene Expression Omnibus (GEO) and The Cancer Genome Atlas (TCGA). By the risk scoring method, we built an individualized four-lncRNA signature (HCCLnc-4) to predict survival of HCC patients in the discovery set (ROC curve, AUC: 0.83, 95% CI: 0.65-1.00, P < 0.05, Kaplan-Meier analysis and log-rank test, P < 0.01). Similar prognostic value of HCCLnc-4 has been further verified in two other independent sets. Stratified analysis and multivariate Cox regression analysis suggested the independence of HCCLnc-4 for prediction of HCC patient survival from traditional clinicopathological factors. Area under curve (AUC) analysis suggested that HCCLnc-4 could compete sufficiently with, or might be even better than classical pathological staging systems to predict HCC patient prognosis in the same data sets. Functional analysis and network analysis suggested the potential implication of lncRNA biomarkers. Our study developed and validated the lncRNA prognostic index of HCC patients, warranting further clinical evaluation and preventive interventions.
Keywords: Hepatocellular carcinoma, Prognosis, lncRNA, Gene expression signature.
Introduction
Hepatocellular carcinoma (HCC), as the most common type of liver cancers, ranks as the fifth most common cancer globally and is the second most common cause of death by cancer worldwide [1]. Accurately estimating HCC patients' prognosis, choosing effective treatment protocol for high-risk patients, and prolonging the survival time are greatly important in clinical practice. Previous studies suggested numerous factors related to the prognosis of HCC, including gender [2], age [3, 4], infection of HBV [5, 6], cirrhosis [7], alpha-fetoprotein (AFP) levels [8, 9], and various pathophysiological characteristics of tumor [8, 10]. However, because of highly clinically and molecularly heterogeneity of human HCC, and hence our limited understanding of the mechanisms underlying tumorigenesis and development of HCC, evaluation based on these traditional prognosis factors is not comprehensive. Moreover, given the systematic measurement biases due to the experimental batch effects, a more personalized prognostic evaluation is needed for individual patients to guide clinical treatments [11-13]. With the advance of high-resolution microarrays and sequencing technology, numerous tissue- and serum-associated HCC biomarkers as potential diagnostic, prognostic, and therapeutic targets were presented [14]. Among them, one class of newly discovered non-coding RNAs (ncRNAs), long non-coding RNAs (lncRNAs), have obtained increasing attention [15].
lncRNAs are typically defined as non-coding transcripts longer than 200 nucleotides [16]. Growing evidence indicates that lncRNAs are involved in all essential biological processes in living cells [17]. In the context of HCC, recent studies suggested that by varying mechanisms, including splicing, differential expression, epigenetic silencing, lncRNA-protein interaction, and lncRNA-miRNA interaction, HCC-related lncRNAs participate in many processes involved in HCC pathogenesis, such as cell proliferation, apoptosis, angiogenesis, and metastasis [15]. Recently, lncRNAs as molecular biomarkers for early detection, monitoring recurrence, prediction of survival, and prediction of treatment response of HCC, were reviewed by Doctor Mitsuro and colleagues [18]. Some lncRNAs, such as lncRNA MALAT1 [19], lncRNA HOTAIR [20], lncRNA CASC15, lncRNA CCAT1, lncRNA CCAT2, lncRNA LASP1-AS, lncRNA LINC00673, lncRNA LOC90784, lncRNA NEAT1, and lncRNA SBF2-AS1 might act as prognostic biomarkers to predict HCC progression or recurrence [18].
In this study, from the perspective of lncRNA expression pattern, applying three datasets of gene expression profiles from Gene Expression Omnibus (GEO) and The Cancer Genome Atlas (TCGA) for 447 HCC patients, we investigated associations between expression levels of lncRNAs and survival outcomes of HCC patients. By the risk scoring method, we established and validated an individualized four-lncRNA signature in different datasets. Functional analysis suggested the four lncRNAs and related genes might be involved in known HCC-related pathophysiologic processes.
Materials and Methods
HCC patient cohorts
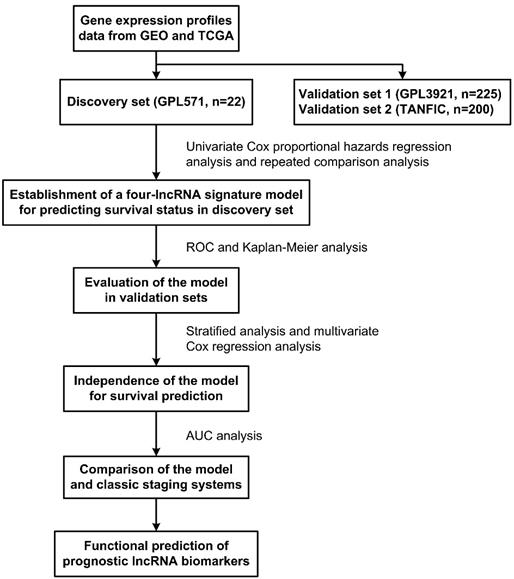
The GSE14520 (https://www.ncbi.nlm.nih.gov/geo/query/acc.cgi?acc=GSE14520) dataset contained two batches of samples. The smaller batch included 22 HCC samples, generated by Affymetrix Human Genome U133A 2.0 Array platform, were used to train a prognostic signature. The larger batch included 225 HCC samples, generated by Affymetrix HT Human Genome U133A Array, were used as the first validation dataset (test cohort-1). The second validation dataset was composed of 200 TCGA HCC samples from TANRIC database (TANRIC: An interactive open platform to explore the function of lncRNAs in cancer.), denoted as test cohort-2. All non-coding transcripts included in the three datasets were for patients treated with surgery only. In addition, the RNA and miRNA expression data, as well as the clinical data of HCC patients were obtained from TCGA (https://tcga-data.nci.nih.gov/tcga/). The flow chart of the study is described in Figure 1.
Probe re-annotation and identification of lncRNA
The probe sets ID represented on the Affymetrix microarrays were checked by NetAffx Annotation Files (HG-U133A_2 Annotations, CSV format, Release 36, 19 MB, 4/13/16; HT_HG-U133A Annotations, CSV format, Release 36, 19 MB, 4/13/16), obtained from the Affymetrix official website. BioMart in Ensembl database was applied to convert Affymetrix microarray IDs to Ensembl IDs together with the corresponding gene type. We only retained genes annotated as 'lincRNA', 'sense_intronic', 'processed_transcript', 'anti-sense', 'sense_overlapping', '3prime_overlapping_ncrna', or 'misc_RNA'. Next, for the probe sets from the Refseq database, those IDs beginning with 'NR' were retained, and transcript IDs labeled with 'NP' were deleted. We removed probe set IDs annotated as 'microRNA', 'snoRNAs', ' pseudo-genes' and other small RNAs. Finally, 842 lncRNA-specific probes corresponding to 351 lncRNAs were obtained for further analysis. When multiple probes were mapped to the same lncRNA, expression values of these probes were integrated by using the median value to represent the expression value of the single lncRNAs. All of the raw data were processed using affy and related R packages with Robust Multi-array Average approach for background normalization as per the package instruction.
Statistical analysis
The association between expression levels of lncRNAs and HCC patients' overall survival (OS) was evaluated by univariate Cox proportional hazards regression analysis (P < 0.001 as selection criteria). Then the combinations of lncRNAs related to HCC patients' OS were analyzed by repeated comparison analysis to identify the best prognostic model for predicting the OS of patients. Next, the lncRNA expression signature, termed HCCLnc-4, was established by the risk scoring method, as described by Lossos et al [21]. Then the risk score value that produced the shortest distance to the point of perfect prediction of the ROC curve, was selected as the cutoff point. By the cutoff value that was determined by the ROC curve, patients were divided into low-risk and high-risk groups. Kaplan-Meier survival analysis and log-rank test were used to compare the difference in OS time between the high-risk group and low-risk group. Given other clinicopathological factors associated with HCC patient OS time as confounding variables, stratified analysis and multivariate Cox regression analysis were performed to evaluate the independence of the lncRNA expression signature to predict the OS outcomes of HCC patients. Area under curve (AUC) analysis was used to determine the superiority of HCCLnc-4 for prediction of HCC patient OS comparing with traditional clinicopathological staging systems. SPSS version 19.0 software (SPSS Inc., Chicago, IL) and GraphPad Prism 5.0 (GraphPad Software, San Diego, CA) was used for statistical analysis and graphics, respectively. The statistical significance level was 0.05.
Functional enrichment analysis
Pearson correlation coefficients were calculated between lncRNAs and protein-coding genes (PCGs) or miRNAs. Functional enrichment analysis for the correlated PCGs was performed using DAVID Bioinformatics Tool (https://david.ncifcrf.gov/, version 6.7) [22]. The network was generated by highly correlated lncRNAs-miRNAs-mRNAs and visualized by Cytoscape 3.2 and ggalluvial package of R software [23].
Results
Patient characteristics
Three HCC patient cohorts with definitive OS information were included in this study. The patient cohort from GSE14520 (GPL571 platform) was selected as a discovery cohort. The patient cohorts from GSE14520 (GPL3921 platform) and TCGA (TANRIC) were used as independent validation cohorts to verify the robustness of the lncRNA biomarkers (hereafter referred as test cohort-1, and test cohort-2, respectively). All 447 patients used in this study were clinically and pathologically diagnosed with HCC. The mean OS time was 31.8 months (range, 1.8-63.8 months, discovery cohort), 40.4 months (range, 2-67.4 months, test cohort-1), and 24.6 months (range, 0-115.9 months, test cohort-2), respectively. All the statistical information was summarized in Table 1 and Table S1.
Diagram showing the process to build and validate the lncRNA signature risk score model to predict prognostic outcomes.
Demographics and clinical characteristics of patients in the three sets. (n=447).
| Discovery Set (n=22) | Test Cohort-1 (n=225) | Test Cohort-2 (n=200) | |
|---|---|---|---|
| Gender, n (%) | |||
| Female | 1 (4.8) | 30 (13.6) | 70 (35) |
| Male | 20 (95.2) | 191 (86.4) | 130 (65) |
| Age, n (%) | |||
| < 65 years | 16 (76.2) | 196 (88.7) | 107 (54) |
| >= 65 years | 5 (23.8) | 25 (11.3) | 91 (46) |
| Race, n (%) | |||
| American Indian, Alaska Native, and Asian | 55 (28.6) | ||
| Black or African American | 14 (7.3) | ||
| White | 123 (64.1) | ||
| HBV status1, n (%) | |||
| N | 6 (2.8) | ||
| CC | 156 (71.6) | ||
| AVR-CC | 56 (25.7) | ||
| ALT, n (%) | |||
| low (<= 50 U/L) | 12 (57.1) | 130 (58.8) | |
| high (> 50 U/L) | 9 (42.9) | 91 (41.2) | |
| AFP, n (%) | |||
| low (<= 300 ng/ml) | 10 (50) | 118 (54.1) | |
| high (> 300 ng/ml) | 10 (50) | 100 (45.9) | |
| Cirrhosis, n (%) | |||
| No | 1 (4.8) | 18 (8.1) | |
| Yes | 20 (95.2) | 203 (91.9) | |
| TNM staging, n (%) | |||
| I | 93 (41.3) | 76 (38) | |
| II | 77 (34.2) | 48 (24) | |
| III | 49 (21.8) | 57 (28.5) | |
| IV | 5 (2.5) | ||
| BCLC staging, n (%) | |||
| 0 | 20 (8.9) | ||
| A | 148 (65.8) | ||
| B | 22 (9.8) | ||
| C | 29 (12.9) | ||
| CLIP staging, n (%) | |||
| 0 | 97 (43.1) | ||
| 1 | 74 (32.9) | ||
| 2 | 35 (15.6) | ||
| 3 | 9 (4.0) | ||
| 4 | 3 (1.3) | ||
| 5 | 1 (0.4) | ||
| Main Tumor Size, n (%) | |||
| Small (<= 5 cm ) | 13 (61.9) | 140 (63.6) | |
| Large (> 5 cm) | 8 (38.1) | 80 (36.4) | |
| Vital Status, n (%) | |||
| Survival | 10 (47.6) | 136 (61.5) | 111 (55.5) |
| Death | 11 (52.4) | 85 (38.5) | 89 (44.5) |
| Overall survival time (months) | |||
| Mean | 31.8 | 40.4 | 24.6 |
| Range | 1.8-63.8 | 2-67.4 | 0-115.9 |
1 N, Normal, CC, chronic carrier, and AVR-CC, active viral replication chronic carrier. Abbreviations: HBV, hepatitis B virus; ALT, alanine aminotransferase; AFP, alpha-fetoprotein; TNM, TNM (tumor, lymph node, and metastasis) Classification of Malignant Tumors; BCLC, Barcelona Clinic Liver Cancer; CLIP, Cancer of The Liver Italian Program.
Identification of lncRNAs associated with OS of HCC patients from the discovery set
As shown in Figure 1, the discovery set was firstly analyzed to identify the potential prognostic lncRNA biomarkers, and then the validation data sets were conducted for validation. In the discovery set, univariate Cox proportional hazards regression analysis was performed for lncRNA expression data, and lncRNAs related to patient OS (P < 0.001 as selection criteria) were identified. Then the combinations of these lncRNAs related to patient OS were analyzed, and a model consisting of four lncRNAs was identified as the best prognostic model for predicting the OS of patients. All these four lncRNAs were verified in the NCBI database and classified as ncRNAs in this website. The detailed information of these four lncRNAs is shown in Table 2. Subsequently, these four lncRNAs were integrated into a predictive signature (hereafter inferred as HCCLnc-4) by risk scoring method that was described in “Materials and methods”, to predict the prognostic outcomes, as follows: HCCLnc-4 risk score = (3.6392 × expression value of ENSG00000234608) + (-2.9565 × expression value of ENSG00000242086) + (-6.9077 × expression value of ENSG00000273032) + (1.5738 × expression value of ENSG00000228463).
Association of HCCLnc-4 and patient OS in the discovery set
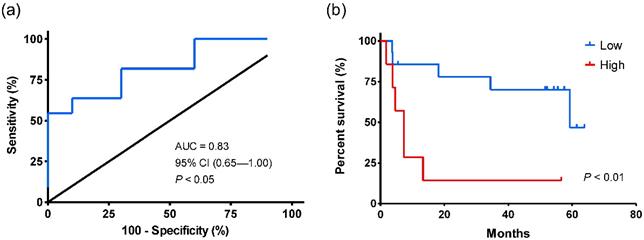
Univariate Cox regression analysis shows that the levels of HCCLnc-4 were significantly associated with patient survival (HR: 11.697, 95% CI: 2.257-60.618, P < 0.01, see in Table 3). As shown in Figure 2a, the AUC value by ROC analysis was 0.83 (95% CI: 0.65-1.00, P < 0.05), indicating HCCLnc-4 had high sensitivity and specificity to predict the prognostic survival of patients in the discovery set. And the risk score value of -8.77, which produced the shortest distance to the point of perfect prediction of the ROC curve, was selected as the cutoff point. Using the same cutoff point produced from the ROC curve, patients were divided into low-risk (n = 16) and high-risk groups (n = 6). Kaplan-Meier analysis and log-rank test were then performed. Compared with the low-risk group, patients in the high-risk group had significantly shorter OS time (log-rank test P < 0.01, see in Figure 2b).
Basic information of four lncRNAs in the four-lncRNA signature to predict the overall survival time of HCC patients.
| Ensembl ID | Probe ID | Name | Chromosome |
|---|---|---|---|
| ENSG00000234608 | 64432_at | MAPKAPK5 antisense RNA 1 [Source: HGNC Symbol;Acc:HGNC:24091] | Chr 12: 111839764 - 111842902 (-1) |
| ENSG00000242086 | 222021_x_at | long intergenic non-protein coding RNA 969 [Source: HGNC Symbol;Acc:HGNC:48729] | Chr 3: 195658062 - 1957399642 (1) |
| ENSG00000273032 | 215003_at | DiGeorge syndrome critical region gene 9 (non-protein coding) [Source: HGNC Symbol;Acc:HGNC:17227], also known as DGS-A | Chr 22: 19017834 - 19020248 (1) |
| ENSG00000228463 | 221634_at | AP006222.1 (Ribosomal Protein L23a pseudogene) | Chr 1: 257864 - 297502 (-1) |
Validation of HCCLnc-4 in additional independent test cohorts
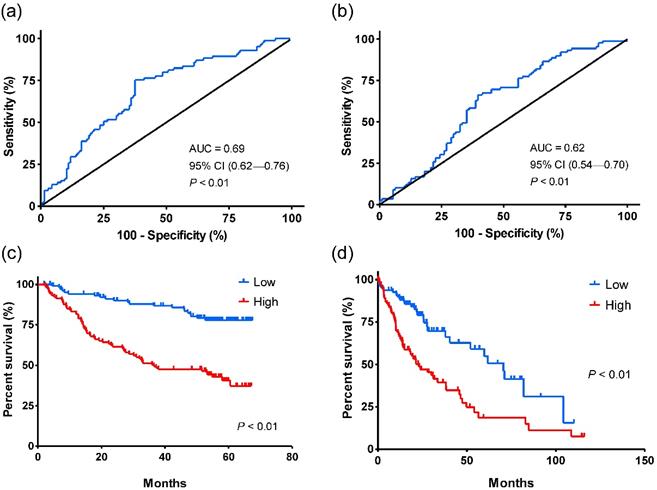
Next, the robustness of HCCLnc-4 was tested in the other two validation cohorts. Univariate Cox regression analysis shows that the levels of the HCCLnc-4 were significantly associated with patient survival both in test cohort-1 (HR: 3.711, 95% CI: 2.263-6.086, P < 0.01, see in Table 3), and in test cohort-2 (HR: 2.46, 95%CI: 1.580-3.831, P < 0.01, see in Table 3). The area under ROC curves was 0.69 (95% CI: 0.62-0.76, P < 0.01) and 0.62 (95% CI: 0.54-0.70, P < 0.01) for test cohort-1 and test cohort-2, respectively (Figure 3a and Figure 3b). In addition, Kaplan-Meier analysis and log-rank test show that compared with the low-risk group, patients in the high-risk group had significantly shorter OS time in the two validation cohorts, respectively (in both cohorts, log-rank test P < 0.01), as seen in Figure 3c and Figure 3d.
Kaplan-Meier and ROC analysis for the overall survival of patients from the discovery set (GPL571). (a) ROC curve shows the sensitivity and specificity of the four-lncRNA signature (HCCLnc-4) in prediction of the patient overall survival, AUC = 0.83 (95% CI: 0.65-1.00, P < 0.05). (b) Kaplan-Meier survival curve shows the correlation between HCCLnc-4 and the overall survival of patients. A two-sided log-rank test was performed to evaluate the survival differences between the two curves. The cutoff point was the value that produced the shortest distance to the point of perfect prediction in the ROC curve. The statistical significance level was 0.05.
ROC and Kaplan-Meier analysis for the overall survival of patients in the validation sets. The patients were divided into low-risk and high-risk groups using the cutoff points that were determined by the ROC curves. (a) ROC curve shows the sensitivity and specificity of the four-lncRNA signature (HCCLnc-4) in prediction of the overall survival of patients from test cohort-1 (GPL3921), AUC = 0.69 (95% CI: 0.62-0.76, P < 0.01). (b) ROC curve shows the sensitivity and specificity of HCCLnc-4 in the prediction of the overall survival of patients from test cohort-2 (TANRIC), AUC = 0.62 (95% CI: 0.54-0.70, P < 0.01). (c) Kaplan-Meier analysis shows the correlation between HCCLnc-4 and the overall survival of patients from test cohort-1 (GPL3921). A two-sided log-rank test was performed to evaluate the survival differences between the two curves. (d) Kaplan-Meier analysis shows the correlation between HCCLnc-4 and the overall survival of patients from test cohort-2 (TANRIC). A two-sided log-rank test was performed to evaluate the survival differences between the two curves. The statistical significance level was 0.05.
Multivariate Cox regression analysis of overall survival time in each set.
| Univariate model | Multivariate model | ||||||
|---|---|---|---|---|---|---|---|
| HR | 95% CI of HR | P-Value | HR | 95% CI of HR | P-Value | ||
| Discovery set (n=22) | |||||||
| Age (years) | < 65 | 1 (reference) | 1 (reference) | ||||
| >= 65 | 1.063 | 0.281-4.015 | > 0.05 | 0.226 | 0.038-1.341 | > 0.05 | |
| Main tumor size (cm) | small (<= 5) | 1 (reference) | 1 (reference) | ||||
| large (> 5) | 2.24 | 0.682-7.354 | > 0.05 | 8.487 | 1.093-65.897 | < 0.05 | |
| ALT (U/L) | low (<= 50) | 1 (reference) | 1 (reference) | ||||
| high (> 50) | 1.802 | 0.538-6.032 | > 0.05 | 3.358 | 0.711-15.857 | > 0.05 | |
| AFP (ng/ml) | low (<= 300) | 1 (reference) | 1 (reference) | ||||
| high (> 300) | 2.976 | 0.738-11.998 | > 0.05 | 1.441 | 0.279-7.432 | > 0.05 | |
| HCCLnc-41 | low | 1 (reference) | 1 (reference) | ||||
| high | 11.697 | 2.257-60.618 | < 0.01 | 36.227 | 3.807-344.704 | < 0.01 | |
| Test cohort-1 (n=225) | |||||||
| Age (years) | < 65 | 1 (reference) | 1 (reference) | ||||
| >= 65 | 0.542 | 0.236-1.244 | > 0.05 | 0.665 | 0.255-1.735 | > 0.05 | |
| Main tumor size (cm) | small (<= 5) | 1 (reference) | 1 (reference) | ||||
| large (> 5) | 1.924 | 1.252-2.956 | < 0.01 | 1.011 | 0.551-1.855 | > 0.05 | |
| Gender | female | 1 (reference) | 1 (reference) | ||||
| male | 1.7 | 0.82-3.521 | > 0.05 | 1.512 | 0.707-3.236 | > 0.05 | |
| TNM staging | I-II | 1 (reference) | 1 (reference) | ||||
| III-IV | 3.513 | 2.24-5.511 | < 0.01 | 1.602 | 0.725-3.541 | > 0.05 | |
| HBV status2 | N | 1 (reference) | 1 (reference) | ||||
| CC | 1.062 | 0.259-4.353 | > 0.05 | 1.075 | 0.254-4.540 | > 0.05 | |
| AVR-CC | 1.42 | 0.336-6 | > 0.05 | 1.797 | 0.406-7.948 | > 0.05 | |
| ALT (U/L) | low (<= 50) | 1 (reference) | 1 (reference) | ||||
| high (> 50) | 1.08 | 0.703-1.658 | > 0.05 | 0.805 | 0.507-1.280 | > 0.05 | |
| AFP (ng/ml) | low (<= 300) | 1 (reference) | 1 (reference) | ||||
| high (> 300) | 1.629 | 1.063-2.497 | < 0.05 | 1.139 | 0.710-1.825 | > 0.05 | |
| BCLC staging | 0-A | 1 (reference) | 1 (reference) | ||||
| B-C | 3.546 | 2.27-5.54 | < 0.01 | 1.073 | 0.524-2.197 | > 0.05 | |
| Cirrhosis | No | 1 (reference) | 1 (reference) | ||||
| Yes | 4.622 | 1.137-18.797 | < 0.05 | 4.363 | 1.054-18.064 | < 0.05 | |
| CLIP staging | 0-2 | 1 (reference) | 1 (reference) | ||||
| >2 | 3.736 | 1.974-7.071 | < 0.01 | 1.902 | 0.861-4.203 | > 0.05 | |
| HCCLnc-41 | low | 1 (reference) | 1 (reference) | ||||
| high | 3.711 | 2.263-6.086 | < 0.01 | 3.352 | 2.011-5.590 | < 0.01 | |
| Test cohort-2 (n=200) | |||||||
| Age (years) | < 65 | 1 (reference) | 1 (reference) | ||||
| >= 65 | 0.834 | 0.545-1.277 | > 0.05 | 0.834 | 0.508-1.369 | > 0.05 | |
| Gender | female | 1 (reference) | 1 (reference) | ||||
| male | 1.257 | 0.813-1.943 | > 0.05 | 0.992 | 0.586-1.678 | > 0.05 | |
| TNM staging | I-II | 1 (reference) | 1 (reference) | ||||
| III-IV | 2.172 | 1.392-3.391 | < 0.01 | 2.139 | 1.296-3.531 | < 0.01 | |
| Race | American Indian, Alaska Native, and Asian | 1 (reference) | 1 (reference) | ||||
| Black or African American | 0.848 | 0.347-2.075 | > 0.05 | 1.253 | 0.45-3.489 | > 0.05 | |
| White | 0.512 | 0.312-0.841 | < 0.01 | 0.476 | 0.267-0.848 | < 0.05 | |
| HCCLnc-41 | low | 1 (reference) | 1 (reference) | ||||
| high | 2.46 | 1.58-3.831 | < 0.01 | 2.243 | 1.356-3.711 | < 0.01 | |
1Patients were divided into low-risk and high-risk groups by the cutoff point that produced the shortest distance to the point of perfect prediction of the ROC curve. 2N, Normal, CC, chronic carrier, and AVR-CC, active viral replication chronic carrier. Abbreviations: BCLC, Barcelona Clinic Liver Cancer; CLIP, Cancer of with Liver Italian Program; HR, hazard ratio; CI, confidence interval; HCCLnc-4, four-lncRNA signature for prediction of hepatocellular carcinoma patients; ALT, alanine aminotransferase; AFP, alpha-fetoprotein; TNM, TNM (tumor, lymph node, and metastasis) Classification of Malignant Tumours; HBV, hepatitis B virus.
Independence of HCCLnc-4 for prediction of patient OS from clinicopathological factors
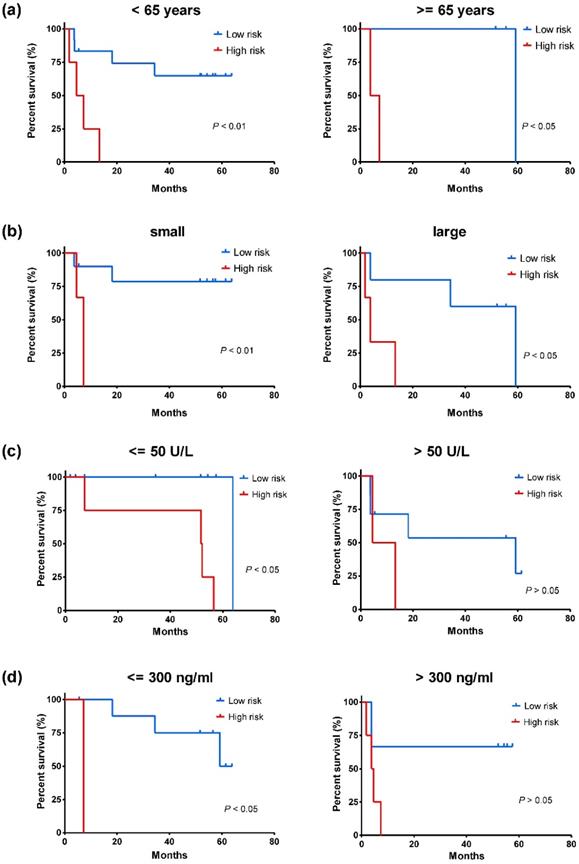
To distinguish whether HCCLnc-4 could serve as a predictor independent of other clinicopathological parameters, we conducted Kaplan-Meier analysis and log-rank test after stratification by other factors, using the same cutoff value that was determined by ROC curve of the whole group, and multivariate Cox regression analysis. For the discovery cohort, after stratification by age, Kaplan-Meier analysis and log-rank test show that the level of HCCLnc-4 has significant association with OS both in patients < 65 years old (log-rank test P < 0.01, see Figure 4a), and in patients >= 65 years old (log-rank test P < 0.05, see Figure 4a). After stratification by tumor size, Kaplan-Meier analysis and log-rank test show that the level of HCCLnc-4 has significant association with OS both in patients with small tumors (<= 5 cm) (log-rank test P < 0.01, see Figure 4b) and in patients with large tumors (> 5 cm) (log-rank test P < 0.05, see Figure 4b). After stratification by alanine aminotransferase (ALT) levels, Kaplan-Meier analysis and log-rank test show that the levels of HCCLnc-4 have a significant association with OS in patients with ALT levels <= 50 U/L (log-rank test P < 0.05, see Figure 4c), however has no significant association with OS in patients with ALT levels > 50 U/L (log-rank test P > 0.05, see Figure 4c). Similarly, after stratification by AFP levels, Kaplan-Meier analysis and log-rank test show that the levels of HCCLnc-4 have a significant association with OS in patients with AFP levels <= 300 ng/ml (log-rank test P < 0.05, see Figure 4d), however has no significant association with OS in patients with AFP levels > 300 ng/ml (log-rank test P > 0.05, see Figure 4d).
Kaplan-Meier estimates of the overall survival of patients from the discovery set (GPL571) with different ages, tumor size, ALT levels, and AFP levels. The patients were divided into low-risk and high-risk groups using the same cutoff value that was determined by ROC curve of the whole group. (a) Kaplan-Meier analysis for patients of different ages. (b) Kaplan-Meier analysis for patients with different tumor size, tumor <= 5cm, small, and tumor > 5cm, large. (c) Kaplan-Meier analysis for patients with different ALT levels. (d) Kaplan-Meier analysis for patients with different AFP levels. A two-sided log-rank test was performed to evaluate the survival differences between the two curves. The statistical significance level was 0.05.
For test cohort-1, after stratification by other clinicopathological factors, Kaplan-Meier analysis and log-rank test show that the levels of HCCLnc-4 has significant association with OS in patients < 65 years old (log-rank test P < 0.01, see Figure S1a), with small tumors (log-rank test P < 0.01, see Figure S1b), with large tumors (log-rank test P < 0.01, see Figure S1b), male (log-rank test P < 0.01, see Figure S1c), with TNM staging I-II (log-rank test P < 0.01, see Figure S1d), and with TNM staging III-IV (log-rank test P < 0.01, see Figure S1d), respectively, however has no significant association with OS in patients >= 65 years old (log-rank test P > 0.05, see Figure S1a), and female (log-rank test P > 0.05, see Figure S1c), respectively. In addition, after stratification by more clinicopathological factors, Kaplan-Meier analysis and log-rank test show that the levels of HCCLnc-4 has significant association with OS in patients with AFP levels <= 300 ng/ml (log-rank test P < 0.01, see Figure S2a), with AFP levels > 300 ng/ml (log-rank test P < 0.01, see Figure S2a), with ALT levels <= 50 U/L (log-rank test P < 0.01, see Figure S2b), with ALT levels > 50 U/L (log-rank test P < 0.01, see Figure S2b), with cirrhosis (log-rank test P < 0.01, see Figure S2c), with chronic carrier status of Hepatitis B Virus (HBV) infection (log-rank test P < 0.01, see Figure S2d), and with active viral replication chronic carrier status of HBV infection (log-rank test P < 0.01, see Figure S2d), respectively, however has no significant association with OS in patients without cirrhosis (log-rank test P > 0.05, see Figure S2c), and normal status of HBV infection (log-rank test P > 0.05, see Figure S2d), respectively. Similarly, after stratification by different Barcelona Clinic Liver Cancer (BCLC) staging, and Cancer of The Liver Italian Program (CLIP) staging, Kaplan-Meier analysis and log-rank test show that the levels of HCCLnc-4 has significant association with OS in patients with BCLC staging (0-A) (log-rank test P < 0.01, see Figure S3a), with BCLC staging (B-C) (log-rank test P < 0.05, see Figure S3a), and with CLIP staging (0-2) (log-rank test P < 0.01, see Figure S3b), respectively, however has no significant association with OS in patients with CLIP staging (> 2) (log-rank test P > 0.05, see Figure S3b).
For test cohort-2, after stratification by other clinicopathological factors, Kaplan-Meier analysis and log-rank test show that the levels of HCCLnc-4 has significant association with OS in patients < 65 years old (log-rank test P < 0.01, see Figure S4a), >= 65 years old (log-rank test P < 0.05, see Figure S4a), male (log-rank test P < 0.01, see Figure S4b), with TNM staging I-II (log-rank test P < 0.01, see Figure S4c), with TNM staging III-IV (log-rank test P < 0.05, see Figure S4c), of American Indian, Alaska Native, and Asian (log-rank test P < 0.01, see Figure S4d), and in white patients (log-rank test P < 0.05, see Figure S4d), respectively, however has no significant association with OS in female patients (log-rank test P > 0.05, see Figure S4b), and in black or African American patients (log-rank test P > 0.05, see Figure S4d).
Additionally, multivariate Cox regression analysis suggests that after adjusted by other clinicopathological factors, the levels of HCCLnc-4 was significantly related to patient survival in all the three cohorts (discovery cohort, HR: 36.227, 95% CI: 3.807-344.704, P < 0.01; test cohort-1, HR: 3.352, 95% CI: 2.011-5.590, P < 0.01, and test cohort-2, HR: 2.243, 95% CI: 1.356-3.711, P < 0.01, see Table 3). All the results above indicate that HCCLnc-4 could predict the survival of HCC patients well independent of other clinical performances.
ROC analysis of clinical and pathological parameters and the four-lncRNA signature in the three datasets.
| Discovery Set (n=22) | Test Cohort-1 (n=225) | Test Cohort-2 (n=200) | |||||||
|---|---|---|---|---|---|---|---|---|---|
| AUC | 95% CI of AUC | P-Value | AUC | 95% CI of AUC | P-Value | AUC | 95% CI of AUC | P-Value | |
| Gender (female / male) | 0.534 | 0.457-0.611 | 0.398 | 0.461 | 0.380-0.542 | 0.344 | |||
| Age (< 65 years / >= 65 years ) | 0.536 | 0.284-0.788 | 0.778 | 0.465 | 0.388-0.543 | 0.388 | 0.521 | 0.439-0.602 | 0.618 |
| Race (white / others1) | 0.673 | 0.436-0.909 | 0.181 | 0.482 | 0.402-0.563 | 0.67 | |||
| HBV status (normal / active) | 0.503 | 0.424-0.582 | 0.94 | ||||||
| ALT (<= 50 U/L / > 50 U/L) | 0.623 | 0.378-0.868 | 0.342 | 0.519 | 0.441-0.598 | 0.633 | |||
| AFP (<= 300ng/ml / > 300 ng/ml) | 0.6 | 0.346-0.854 | 0.45 | 0.568 | 0.489-0.646 | 0.093 | |||
| Cirrhosis (yes/no) | 0.547 | 0.47-0.624 | 0.239 | ||||||
| TNM staging (I-II / III-IV) | 0.618 | 0.539-0.697 | < 0.01 | 0.639 | 0.557-0.721 | < 0.01 | |||
| BCLC staging (0-A / B-C) | 0.630 | 0.551-0.708 | < 0.01 | ||||||
| CLIP staging (0-2 / > 2) | 0.550 | 0.470-0.630 | 0.211 | ||||||
| Main Tumor Size (<= 5 cm / > 5 cm) | 0.568 | 0.490-0.646 | 0.09 | ||||||
| HCCLnc-42 (low / high) | 0.773 | 0.564-0.981 | < 0.05 | 0.689 | 0.617-0.761 | < 0.01 | 0.633 | 0.556-0.711 | < 0.01 |
1Containing American Indian, Alaska Native, Asian, and black or African American. 2Patients were divided into low-risk and high-risk groups by the cutoff point that produced the shortest distance to the point of perfect prediction of the ROC curve. Abbreviations: BCLC, Barcelona Clinic Liver Cancer; CLIP, Cancer of The Liver Italian Program; HCCLnc-4, four-lncRNA signature for prediction of hepatocellular carcinoma patients; ALT, alanine aminotransferase; AFP, alpha-fetoprotein; TNM, TNM (tumor, lymph node, and metastasis) Classification of Malignant Tumours; HBV, hepatitis B virus.
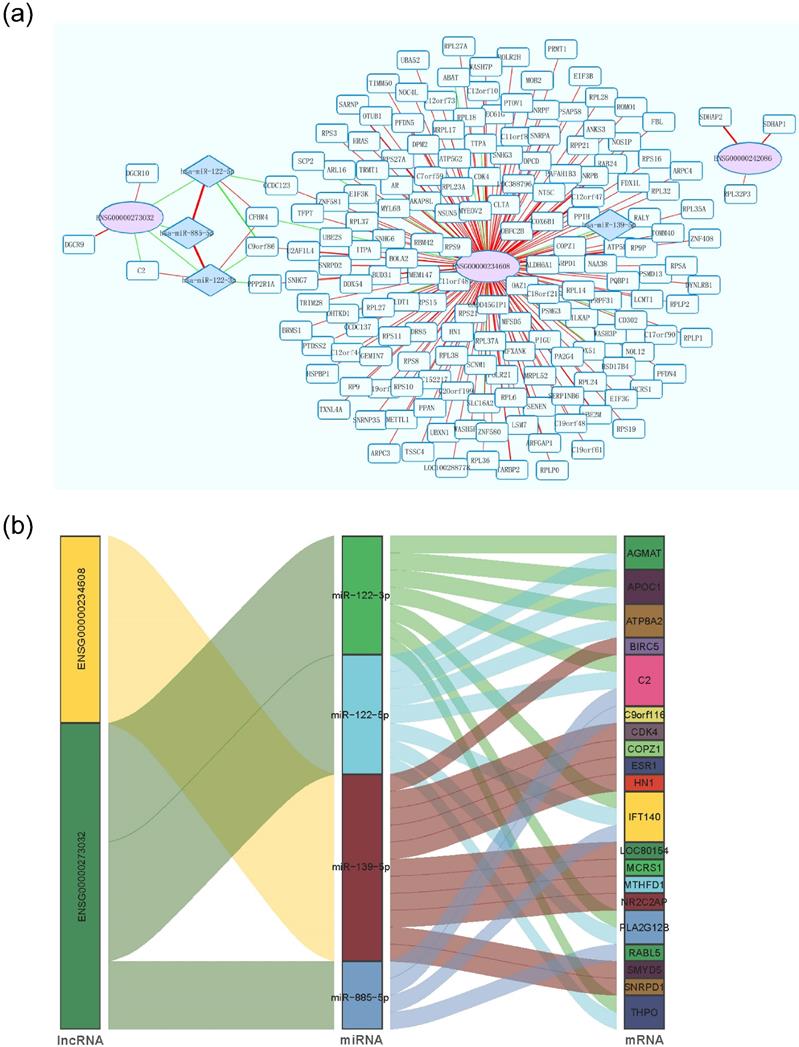
Interaction network of lncRNA, miRNA, and mRNA in HCC. (a) Each Ellipse (red) indicates lncRNA associated with the patient overall survival. Each rhombus rectangle indicates miRNA related to lncRNA. The edge color-coded green or red indicates the negative or positive correlation, respectively. The edge size is proportional to the significance of the correlation. (b) Sankey diagram for the ceRNA network in HCC. Each rectangle represents a gene, and the connection degree of each gene is visualized based on the size of the rectangle.
Comparison of HCCLnc-4 and clinicopathological factors
To determine the superiority of HCCLnc-4 for prediction of HCC patient OS, we calculated AUC that produced by different clinicopathological factors to compare them with that produced by HCCLnc-4. As can be seen in Table 4, AUC produced by HCCLnc-4 was the largest in the discovery set (AUC: 0.773, 95% CI: 0.564-0.981, P < 0.05) comparing with those produced by other clinicopathological factors. In addition, AUC produced by HCCLnc-4 was the largest in test cohort-1 (AUC: 0.689, 95% CI: 0.617-0.761, P < 0.01), comparing to those produced by TNM staging (AUC: 0.618, 95% CI: 0.539-0.697, P < 0.01) and BCLC staging (AUC: 0.630, 95% CI: 0.551-0.708, P < 0.01), and was similar to that produced by TNM staging (TNM staging I-II vs III-IV, AUC: 0.639, 95% CI: 0.557-0.721, P < 0.01) in test cohort-2 (HCCLnc-4 low vs high, AUC: 0.633, 95% CI: 0.556-0.711, P < 0.01). These data suggest that HCCLnc-4 could compete sufficiently with classical clinical and pathological staging systems to predict HCC patient OS.
Functional prediction of HCCLnc-4
To explore the function of HCCLnc-4, we identified highly positively or negatively correlated PCGs with at least one of 4 lncRNAs by calculating the Pearson correlation coefficient (P < 1E-10 as selection criteria) of paired lncRNA and PCGs expression profiles. The functional enrichment analysis of Gene Ontology (GO) and Kyoto Encyclopedia of Genes and Genomes (KEGG) pathway revealed that PCGs positively correlated with lncRNAs were involved in rRNA processing process and spliceosome pathway, while PCGs negatively correlated with lncRNAs were enriched in GO terms mostly related to metabolic process and KEGG pathways, including Complement and coagulation cascades, Metabolic pathways, and PPAR signaling pathway, etc. The HCCLnc-4 associated biological processes and pathways can be found in Table S2.
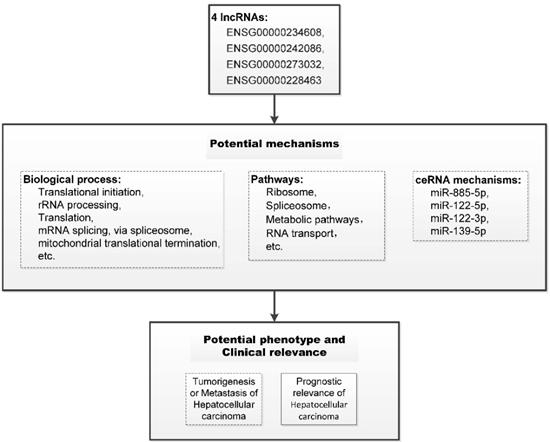
Using P < 1E-20 as selection criteria, 4 miRNAs and 176 mRNAs were identified to be significantly associated with HCCLnc-4. All these four miRNAs (miR-885-5p, miR-122-5p, miR-122-3p, and miR-139-5p) were found to be involved in liver pathology or HCC [24-26]. The network revealed that lncRNA especially ENSG00000273032 may intervene in HCC pathogenesis by competitively associated with miR-122 and miR-885, acting as competing endogenous RNAs (ceRNAs), as seen in Figure 5a and Figure 5b. And we summarized our main findings in Figure 6.
Schematic of the potential mechanism of the four lncRNAs in the prognostic model of hepatocellular carcinoma. The potential mechanisms of the four lncRNAs were summarized based on the results of the functional prediction of bioinformatics, statistical analysis of clinical relevance, and previous publications. The dotted boxes, such as biological process, pathways, ceRNA mechanisms, and the potential phenotype of oncobiology, indicate potential biological mechanisms that need to be further revealed. And the solid-line boxes, such as the associations between the four lncRNAs and prognostic relevance of hepatocellular carcinoma, indicate the evidence established in our study.
Discussion
The ability to recognize patients with high risk would aid the decision for HCC management. Several clinical prognostic indicators have been proposed to discriminate patients who stand to benefit from liver transplantation. However, they are still insufficient or not sensitive enough for predicting HCC patients at high risk for recurrence and selecting those at low risk [27, 28]. Highly sensitive and accurate molecular prognostic biomarkers are sorely needed [29].
As the newly identified class of ncRNA, lncRNAs participate in tumor proliferation, metastasis, invasion, energy regulation, and tumor-initiating cells self-renewal [30]. lncRNA based prognostic indexes have been proved to be useful to predict survival, metastasis, and recurrence of tumor patients [31-33]. And established by different methods, mRNA [34], lncRNA [35, 36], miRNA [37], or mixed molecule type signature [38] had shown the prognostic value of HCC. For instance, using six prediction machine-learning algorithms, Yuan and colleagues established a metastasis-related signature comprised of five mRNAs and one lncRNA, which presented the well prognostic value of HCC [38]. In the present study, using the risk score method and directly based upon different prognostic status, we got an HCC prognosis related four-lncRNA signature and explored the potential implication of lncRNA biomarkers by functional analysis.
Recent studies found that some of the microarray probes on the commonly used arrays are likely to map to lncRNAs [39, 40], which represents a cost-effective way to obtain lncRNA expression profiles. In the present study, by repurposing the expression profiles with OS information of HCC patients from GEO database and TCGA dataset, we obtained lncRNA expression data among the patients, and by Cox regression analysis and risk scoring method, we established a four-lncRNA signature (HCCLnc-4) for predicting HCC patient survival in the discovery cohort. ROC analysis and Kaplan-Meier analysis suggested that HCCLnc-4 was significantly correlated with the survival status of HCC patients. The prognostic value of HCCLnc-4 was further validated in the other two validation cohorts. Stratified analysis and multivariate Cox regression analysis indicated that HCCLnc-4 for HCC patient survival prediction was universal among different subgroups and independent of other prognostic factors. And compared to traditional evaluation systems, such as TNM staging, BCLC staging and CLIP staging systems, a similar or even better HCC prognostic value of HCCLnc-4 could be seen in the same data sets in our research. In addition, recently, Li et al. established a three-gene prognostic signature for patients with HCC, which contained UPB1, SOCS2, and RTN3 [34]. GSE14520 (containing two batches of samples, GPL571 and GPL3921) was also used as a validation cohort in Li et al's study, and in their study, AUC in time-dependent ROC curve was 0.645 for 1-year survival, 0.638 for 2-year survival, 0.618 for 3-year survival, 0.607 for 4-year survival, and 0.622 for 5-year survival, respectively, compared to 0.83 (GPL571, 95% CI: 0.65-1.00, P < 0.05) and 0.69 (GPL3921, 95% CI: 0.62-0.76, P < 0.01) of HCCLnc-4 in our study, indicating well or possibly higher sensitivity and specificity of HCCLnc-4 to predict the prognostic survival of HCC patients compared to the recently published mRNA-based signature in the same data sets. These results suggested that HCCLnc-4 was an individualized and robust prognostic marker to predict HCC patient survival.
Though more than ten thousand lncRNAs have been discovered in human, functional studies of these lncRNAs are still in its early stages. MAPKAPK5 antisense RNA 1 (MAPKAPK5-AS1, ENSG00000234608), one of 4 HCC prognosis-related lncRNAs, was differentially expressed between HCC tissues and adjacent non-tumor tissues and negatively associated with OS of HCC patients [41]. Similarly, the expression level of MAPKAPK5-AS1 is positively correlated with HCCLnc-4 and negatively associated with the OS of HCC patients in our study. Upregulation of MAPKAPK5-AS1 in HCC patients with vascular invasion was also observed [41]. Through network analysis, MAPKAPK5-AS1 is co-expressed with the genes involved in ribosome and spliceosome pathways, which have been partly elucidated elsewhere [42, 43]. In addition, another lncRNA, DiGeorge syndrome critical region gene 9 (DGCR9, ENSG00000273032), one of the 4 HCC prognosis-related lncRNAs in our study, is also one lncRNA of a 9-lncRNA risk score system for the prognostic prediction of patients with HBV-positive HCC [44]. In the study conducted by Dr. Sun and colleagues [44], using one RNA-sequencing dataset from TCGA and three datasets from GEO, they built a 9-lncRNA risk score system, and the expression level of DGCR9 was negatively associated with the 9-lncRNA risk score and positively correlated with OS of HBV-positive HCC patients. In our study, a similar association between the expression level of DGCR9 and HCC patient OS was also observed, though our study included patients with HBV either positive or negative. Furthermore, in the network analysis (Figure 5a and Figure 5b), we showed that DGCR9 (ENSG00000273032) might act as a ceRNA to intervene in HCC pathogenesis by competitively associated to miR-122 and miR-885, which have been found to be involved in liver diseases or liver cancer [45-47]. All these results call for further studies to conclude a causal association between these relationships, which may contribute to novel targeted therapy.
Several limitations should be noted in our study. Firstly, we obtain lncRNA expression profiles from the commonly used arrays, so not expression profiles of all lncRNAs were analyzed in our study. Secondly, our model could not include all the potential important prognostic factors, such as steatosis and nonalcoholic fatty liver disease (NAFLD), because the information of these factors was unavailable in the publicly published datasets. Thirdly, prospective studies with larger sample sizes are needed to validate the prognostic value of HCCLnc-4 in HCC patients. Fourthly, the potential biological mechanisms behind the associations between HCCLnc-4 and OS of HCC patients remains to be investigated in further studies.
In conclusion, our study suggested the potential of lncRNA signature as novel candidate biomarkers in the prognosis of HCC, or potential biological functions of lncRNAs in hepatocarcinogenesis.
Abbreviations
HCC: hepatocellular carcinoma; lncRNA: long non-coding RNA; GEO: Gene Expression Omnibus; TCGA: The Cancer Genome Atlas; AUC: area under curve; AFP: alpha-fetoprotein; ncRNA: non-coding RNA; OS: overall survival; ALT: alanine aminotransferase; HBV: Hepatitis B Virus; BCLC: Barcelona Clinic Liver Cancer; CLIP: Cancer of The Liver Italian Program; GO: Gene Ontology; KEGG: Kyoto Encyclopedia of Genes and Genomes; ceRNA: competing endogenous RNAs.
Supplementary Material
Supplementary figures and tables.
Acknowledgements
This work was supported by the National Natural Science Foundation of China to Jin Yang (Grant No. 81772520), Zhejiang Provincial Natural Science Foundation to Jin Yang (Grant No. LGF19H030004), Zhejiang medical and health technology project to Jin Yang (Grant No. 2018PY039), Zhejiang Provincial Natural Science Foundation to Zongxing Yang (Grant No. LGF19H190003), and Hangzhou Science and Technology Development Program to Zongxing Yang (Grant No. 20150733Q50).
Author contributions
J.Y. and Z.Y. conceived and designed the study. J.Y., Z.Y., Y.Y., G.Z., Y.L., W.Y., and Y.Z. analyzed data. Z.Y., Y.Y. and J.Y. wrote this manuscript. All authors reviewed and approved the final manuscript.
Competing Interests
The authors have declared that no competing interest exists.
References
1. Stewart BW, Wild CP. World Cancer Report 2014. Geneva: World Health Organization. 2014
2. Villa E, Moles A, Ferretti I, Buttafoco P, Grottola A, Del Buono M. et al. Natural history of inoperable hepatocellular carcinoma: estrogen receptors' status in the tumor is the strongest prognostic factor for survival. Hepatology (Baltimore, Md). 2000;32:233-8
3. Kao WY, Chiou YY, Hung HH, Su CW, Chou YH, Huo TI. et al. Younger hepatocellular carcinoma patients have better prognosis after percutaneous radiofrequency ablation therapy. Journal of clinical gastroenterology. 2012;46:62-70
4. Su CW, Lei HJ, Chau GY, Hung HH, Wu JC, Hsia CY. et al. The effect of age on the long-term prognosis of patients with hepatocellular carcinoma after resection surgery: a propensity score matching analysis. Archives of surgery (Chicago, Ill: 1960). 2012;147:137-44
5. Li T, Wang SK, Zhou J, Sun HC, Qiu SJ, Ye QH. et al. Positive HBcAb is associated with higher risk of early recurrence and poorer survival after curative resection of HBV-related HCC. Liver international: official journal of the International Association for the Study of the Liver. 2016;36:284-92
6. Yu SJ, Kim YJ. Hepatitis B viral load affects prognosis of hepatocellular carcinoma. World journal of gastroenterology. 2014;20:12039-44
7. Sobin LH, Compton CC. TNM seventh edition: what's new, what's changed: communication from the International Union Against Cancer and the American Joint Committee on Cancer. Cancer. 2010;116:5336-9
8. Zhu WJ, Huang CY, Li C, Peng W, Wen TF, Yan LN. et al. Risk factors for early recurrence of HBV-related hepatocellular carcinoma meeting milan criteria after curative resection. Asian Pacific journal of cancer prevention: APJCP. 2013;14:7101-6
9. Peng SY, Chen WJ, Lai PL, Jeng YM, Sheu JC, Hsu HC. High alpha-fetoprotein level correlates with high stage, early recurrence and poor prognosis of hepatocellular carcinoma: significance of hepatitis virus infection, age, p53 and beta-catenin mutations. International journal of cancer. 2004;112:44-50
10. Arii S, Yamaoka Y, Futagawa S, Inoue K, Kobayashi K, Kojiro M. et al. Results of surgical and nonsurgical treatment for small-sized hepatocellular carcinomas: a retrospective and nationwide survey in Japan. The Liver Cancer Study Group of Japan. Hepatology (Baltimore, Md). 2000;32:1224-9
11. Ao L, Song X, Li X, Tong M, Guo Y, Li J. et al. An individualized prognostic signature and multiomics distinction for early stage hepatocellular carcinoma patients with surgical resection. Oncotarget. 2016;7:24097-110
12. Leek JT, Scharpf RB, Bravo HC, Simcha D, Langmead B, Johnson WE. et al. Tackling the widespread and critical impact of batch effects in high-throughput data. Nature reviews Genetics. 2010;11:733-9
13. Eddy JA, Sung J, Geman D, Price ND. Relative expression analysis for molecular cancer diagnosis and prognosis. Technology in cancer research & treatment. 2010;9:149-59
14. Chauhan R, Lahiri N. Tissue- and Serum-Associated Biomarkers of Hepatocellular Carcinoma. Biomarkers in cancer. 2016;8:37-55
15. Yang X, Xie X, Xiao YF, Xie R, Hu CJ, Tang B. et al. The emergence of long non-coding RNAs in the tumorigenesis of hepatocellular carcinoma. Cancer letters. 2015;360:119-24
16. Spizzo R, Almeida MI, Colombatti A, Calin GA. Long non-coding RNAs and cancer: a new frontier of translational research? Oncogene. 2012;31:4577-87
17. Fatima R, Akhade VS, Pal D, Rao SM. Long noncoding RNAs in development and cancer: potential biomarkers and therapeutic targets. Molecular and cellular therapies. 2015;3:5
18. Umeda S, Kanda M, Kodera Y. Recent advances in molecular biomarkers for patients with hepatocellular carcinoma. Expert review of molecular diagnostics. 2019;19:725-38
19. Lai MC, Yang Z, Zhou L, Zhu QQ, Xie HY, Zhang F. et al. Long non-coding RNA MALAT-1 overexpression predicts tumor recurrence of hepatocellular carcinoma after liver transplantation. Medical oncology (Northwood, London, England). 2012;29:1810-6
20. Yang Z, Zhou L, Wu LM, Lai MC, Xie HY, Zhang F. et al. Overexpression of long non-coding RNA HOTAIR predicts tumor recurrence in hepatocellular carcinoma patients following liver transplantation. Annals of surgical oncology. 2011;18:1243-50
21. Lossos IS, Czerwinski DK, Alizadeh AA, Wechser MA, Tibshirani R, Botstein D. et al. Prediction of survival in diffuse large-B-cell lymphoma based on the expression of six genes. The New England journal of medicine. 2004;350:1828-37
22. Huang da W, Sherman BT, Lempicki RA. Bioinformatics enrichment tools: paths toward the comprehensive functional analysis of large gene lists. Nucleic acids research. 2009;37:1-13
23. Demchak B, Hull T, Reich M, Liefeld T, Smoot M, Ideker T. et al. Cytoscape: the network visualization tool for GenomeSpace workflows. F1000Research. 2014;3:151
24. Bandiera S, Pfeffer S, Baumert TF, Zeisel MB. miR-122-a key factor and therapeutic target in liver disease. Journal of hepatology. 2015;62:448-57
25. Gui J, Tian Y, Wen X, Zhang W, Zhang P, Gao J. et al. Serum microRNA characterization identifies miR-885-5p as a potential marker for detecting liver pathologies. Clinical science (London, England: 1979). 2011;120:183-93
26. Qiu G, Lin Y, Zhang H, Wu D. miR-139-5p inhibits epithelial-mesenchymal transition, migration and invasion of hepatocellular carcinoma cells by targeting ZEB1 and ZEB2. Biochemical and biophysical research communications. 2015;463:315-21
27. Tandon P, Garcia-Tsao G. Prognostic indicators in hepatocellular carcinoma: a systematic review of 72 studies. Liver international: official journal of the International Association for the Study of the Liver. 2009;29:502-10
28. Yu L, Dai Z, Wang Z, Fan J, Zhou J. Prognostic indicators for tumor recurrence after liver transplantation in hepatocellular carcinoma and related molecular targeted therapy. Oncology. 2011;81(Suppl 1):116-22
29. King LY, Canasto-Chibuque C, Johnson KB, Yip S, Chen X, Kojima K. et al. A genomic and clinical prognostic index for hepatitis C-related early-stage cirrhosis that predicts clinical deterioration. Gut. 2015;64:1296-302
30. Chen ZZ, Huang L, Wu YH, Zhai WJ, Zhu PP, Gao YF. LncSox4 promotes the self-renewal of liver tumour-initiating cells through Stat3-mediated Sox4 expression. Nature communications. 2016;7:12598
31. Nault JC, De Reynies A, Villanueva A, Calderaro J, Rebouissou S, Couchy G. et al. A hepatocellular carcinoma 5-gene score associated with survival of patients after liver resection. Gastroenterology. 2013;145:176-87
32. Ye QH, Qin LX, Forgues M, He P, Kim JW, Peng AC. et al. Predicting hepatitis B virus-positive metastatic hepatocellular carcinomas using gene expression profiling and supervised machine learning. Nature medicine. 2003;9:416-23
33. Zhou M, Zhong L, Xu W, Sun Y, Zhang Z, Zhao H. et al. Discovery of potential prognostic long non-coding RNA biomarkers for predicting the risk of tumor recurrence of breast cancer patients. Scientific reports. 2016;6:31038
34. Li B, Feng W, Luo O, Xu T, Cao Y, Wu H. et al. Development and Validation of a Three-gene Prognostic Signature for Patients with Hepatocellular Carcinoma. Scientific reports. 2017;7:5517
35. Sun Y, Zhang F, Wang L, Song X, Jing J, Zhang F. et al. A five lncRNA signature for prognosis prediction in hepatocellular carcinoma. Molecular medicine reports. 2019;19:5237-50
36. Gu JX, Zhang X, Miao RC, Xiang XH, Fu YN, Zhang JY. et al. Six-long non-coding RNA signature predicts recurrence-free survival in hepatocellular carcinoma. World journal of gastroenterology. 2019;25:220-32
37. Han B, Zheng Y, Wang L, Wang H, Du J, Ye F. et al. A novel microRNA signature predicts vascular invasion in hepatocellular carcinoma. Journal of cellular physiology. 2019;234:20859-68
38. Yuan S, Wang J, Yang Y, Zhang J, Liu H, Xiao J. et al. The Prediction of Clinical Outcome in Hepatocellular Carcinoma Based on a Six-Gene Metastasis Signature. Clinical cancer research: an official journal of the American Association for Cancer Research. 2017;23:289-97
39. Cao WJ, Wu HL, He BS, Zhang YS, Zhang ZY. Analysis of long non-coding RNA expression profiles in gastric cancer. World journal of gastroenterology. 2013;19:3658-64
40. Du Z, Fei T, Verhaak RG, Su Z, Zhang Y, Brown M. et al. Integrative genomic analyses reveal clinically relevant long noncoding RNAs in human cancer. Nature structural & molecular biology. 2013;20:908-13
41. Zhang J, Fan D, Jian Z, Chen GG, Lai PB. Cancer Specific Long Noncoding RNAs Show Differential Expression Patterns and Competing Endogenous RNA Potential in Hepatocellular Carcinoma. PloS one. 2015;10:e0141042
42. Wong QW, Li J, Ng SR, Lim SG, Yang H, Vardy LA. RPL39L is an example of a recently evolved ribosomal protein paralog that shows highly specific tissue expression patterns and is upregulated in ESCs and HCC tumors. RNA biology. 2014;11:33-41
43. Xu W, Huang H, Yu L, Cao L. Meta-analysis of gene expression profiles indicates genes in spliceosome pathway are up-regulated in hepatocellular carcinoma (HCC). Medical oncology (Northwood, London, England). 2015;32:96
44. Liu H, Zhao P, Jin X, Zhao Y, Chen Y, Yan T. et al. A 9lncRNA risk score system for predicting the prognosis of patients with hepatitis B viruspositive hepatocellular carcinoma. Molecular medicine reports. 2019;20:573-83
45. Hu Y, Du G, Li G, Peng X, Zhang Z, Zhai Y. The miR-122 inhibition alleviates lipid accumulation and inflammation in NAFLD cell model. Archives of physiology and biochemistry. 2019;16:1-5
46. Long JK, Dai W, Zheng YW, Zhao SP. miR-122 promotes hepatic lipogenesis via inhibiting the LKB1/AMPK pathway by targeting Sirt1 in non-alcoholic fatty liver disease. Molecular medicine (Cambridge, Mass). 2019;25:26
47. Zou S, Rao Y, Chen W. miR-885-5p plays an accomplice role in liver cancer by instigating TIGAR expression via targeting its promoter. Biotechnology and applied biochemistry. 2019;66:763-71
Author contact
![]() Corresponding author: Jin Yang, Department of Translational Medicine Center, Affiliated Hospital of Hangzhou Normal University, Hangzhou Normal University, Hangzhou, Zhejiang 310015, P.R. China. Tel: 086-571-88358065. Fax: 086-571-88358065. E-mail: hz_zhiycom.
Corresponding author: Jin Yang, Department of Translational Medicine Center, Affiliated Hospital of Hangzhou Normal University, Hangzhou Normal University, Hangzhou, Zhejiang 310015, P.R. China. Tel: 086-571-88358065. Fax: 086-571-88358065. E-mail: hz_zhiycom.