Journal of Cancer
ISSN: 1837-9664
3.2
Impact Factor
ISSN: 1837-9664

 Global reach, higher impact
J Cancer 2019; 10(27):6801-6812. doi:10.7150/jca.27955 This issue Cite
Research Paper
A Competing Nomogram to Predict Survival Outcomes in Invasive Micropapillary Breast Cancer
Dan Li1*, Chenhan Zhong1*, Yi Cheng1, Ning Zhu1, Yinuo Tan1, Lizhen Zhu1, Dong Xu2,3, Ying Yuan1,3 ![]()
1. Department of Medical Oncology, The Second Affiliated Hospital, Zhejiang University School of Medicine, Hangzhou, Zhejiang Province, China.
2. Department of Surgical Oncology, The Second Affiliated Hospital, Zhejiang University School of Medicine, Hangzhou, Zhejiang Province, China.
3. Cancer Institute (Key Laboratory of Cancer Prevention and Intervention, Chinese National Ministry of Education; Key Laboratory of Molecular Biology in Medical Sciences, Zhejiang Province, China), The Second Affiliated Hospital of Zhejiang University School of Medicine, Hangzhou, Zhejiang Province, China.
* Dan Li and Chenhan Zhong contributed equally to this work.
Received 2018-6-18; Accepted 2019-9-14; Published 2019-11-1
Citation:
Li D, Zhong C, Cheng Y, Zhu N, Tan Y, Zhu L, Xu D, Yuan Y. A Competing Nomogram to Predict Survival Outcomes in Invasive Micropapillary Breast Cancer. J Cancer 2019; 10(27):6801-6812. doi:10.7150/jca.27955. https://www.jcancer.org/v10p6801.htm
Other stylesAbstract
Background: Although it is widely accepted that invasive micropapillary carcinoma (IMPC) presents more aggressive behavior and has a higher aggressive behavior, the prognosis of IMPC compared with invasive ductal carcinoma (IDC) remains controversial. We conducted this study to explore gene expression profiles of IMPC and establish a competing nomogram that predicts the survival outcomes across these two groups of patients.
Methods: Data from the Surveillance, Epidemiology, and End Results (SEER) database were reviewed. Propensity score matching (PSM) was used to adjust for potential baseline confounding between IMPC and IDC group. The Kaplan-Meier method was used to calculate the occurrence of overall mortality. The Gray method was used to estimate the rate of breast cancer specific death (BCSD). A competing regression model was used to evaluate factors associated with BCSD. A nomogram based on the competing risk regression model was established to predict individual outcomes. IMPC-specific gene expression profiles were explored using microarrays data from the Gene Expression Omnibus (GEO) database. Gene ontology (GO) and Kyoto Encyclopedia of Genes and Genomes pathway (KEGG) enrichment analyses were performed.
Results: In this study, 330786 (99.62%) patients with IDC 1247 (0.38%) patients with IMPC were included. Patients with IMPC had more lymph node involvement and a larger tumor size compared with those with IDC. After PSM, many distributional differences were eliminated, showing that the IMPC and IDC group were more similar. Patients with IMPC had a favorable prognosis with statistical significance compared with patients with IDC (overall mortality HR = 0.68; 95%CI, 0.53-0.86; P = 0.002). Based on Gray method, patients with IMPC had a favorable prognosis with significant statistical significance compared with patients with IDC (BCSD SHR = 0.64; 95%CI, 0.47-0.88; P = 0.006). Multivariate analysis based on competing risk model demonstrated that IMPC was a favorable independent factor for BCSD. The nomogram could accurately predict BCSD with a high internal and external validated C-index (0.835, 0.818 respectively). A total of 53 upregulated differentially expressed genes (DEGs) and 40 downregulated DEGs of IMPC was identified. The GO analysis results showed that downregulated DEGs were significantly enriched in extracellular structure organization, extracellular matrix, cell-substrate adhesion junction. KEGG analysis of selective gene sets shows that downregulated DEGs significantly enriched for processes related to carbon metabolism, Rap1 signaling pathway.
Conclusion: In the current study, IMPC accounted for 0.38% of the entire cohort. IMPC was found to be a favorable independent prognostic factor. The present study identified gene expression profiles and signal pathways of IMPC. The developed nomogram can help the oncologists to predict individual outcomes more accurately.
Keywords: invasive micropapillary carcinoma, tumor characteristics, survival outcomes, nomogram
Introduction
Invasive micropapillary carcinoma (IMPC) is an aggressive histological subtype of invasive cancer of the breast [1, 2]. Firstly described by Fisher in 1980 [3], pure IMPC is characterized by tumor cells arranged in typical nets papillary surrounded by an obliterated lumina [4, 5]. The formal concept of IMPC was initially put forward by Siriaunkgul et al in 1993 [6]. Given its unique morphological characteristics and greater invasiveness, IMPC was listed as an independent subtype in the 2003 World Health Organization classification of breast cancer [7]. Although it is widely accepted that IMPC has a more aggressive behavior, it remains unclear whether this behavior translates into poor prognosis [8, 9]. What's more, given its dissimilarity to the common histology of breast cancer, the rareness of IMPC should be emphasized in clinical practice [10].
Previous studies on IMPC often had bias caused by a small patient cohort and the limited follow-up time due to tumor rarity. The strategies in the clinical guidelines for the treatment of IMPC are based on those for the treatment of invasive ductal carcinoma (IDC). Therefore, a specific prognosis evaluation system for IMPC should be utilized to guide treatment strategies in clinical practice [1, 11]. On other hand, the causes of death other than cancer are competing risks among patients with early breast cancer. Thus the cause-specific endpoints were always chosen as endpoint for these studies. However, the Kaplan-Meier method and the Cox proportional hazards model fail to estimate cancer specific death [12].
More recently, nomogram as a prognostic and predictive model have been proposed as reliable and alternative tools to integrate pathological, molecular and clinical characteristics of a disease and consequently establish an evaluation system for the prediction of individual patient outcomes [13]. We attempted to construct a nomogram for IMPC and IDC based on nationwide, population-based clinicopathological and molecular data from Surveillance, Epidemiology, and End Results (SEER) database.
Patients and methods
Inclusion and exclusion criteria
The SEER database includes information on cancer samples from 18 population-based cancer registries and is updated annually to reflect the latest real-world information about cancer. The SEER. Stat software was used to identify patients with breast cancer from January 2001 to December 2015. The specific inclusion criteria were identified as follows: (1) histology ICD-O-3 was limited to IDC (8500/3), IMPC (8507/3), (2) patients without distance metastasis at diagnosis, and (3) the age at diagnosis was between 20 and 80. The exclusion criteria were as follows: (1) the detailed information lacks race, marital status or age, (2) patients with multiple primary tumors, (3) survival time less than 1 month, (4) unknown cause of death, (5) patients with metastatic disease, (6) T classification: unknown, and (7) N classification: unknown.
We randomly divided the entire cohort into a train cohort (75%) and validation cohort (25%) for development and validation of the competing risks nomogram.
The gene expression profiles of GSE66418 were downloaded from the Gene Expression Omnibus (GEO) database, which contains 124 samples, including 73 IMPC samples and 51 matched invasive carcinomas of no special type samples (ICNST). GSE66418 was based on the GPL6801platform [HG-U133_Plus_2] Affymetrix Human Genome U133 Plus 2.0 Array, and submitted by Gruel et al [14].
Variable declaration
Race was divided into white, black and others. The age was regrouped as 20-50yrs (young) and 51-80yrs (old). Marital status was listed as married, single and divorced. The hormone receptor (HR) status of the tumor was stratified as HR-positive and HR-negative. The chemotherapy variable was classified only as chemotherapy “yes” or “no/unknown”.
Statistical analysis
Propensity score matching (PSM) is a statistical method that reduces confounding from measured variables in observational data. In regression adjustment for the propensity score, a treatment case is matched with one or more control cases based on their propensity scores [15]. Patients with the same propensity score have the same distribution of measured confounders. Provided that there is no unmeasured confounding, we obtain unbiased estimates of the treatment effect by comparing treatment groups within levels of the propensity score [16].
Patients with early stage low-risk breast cancer detected by mammography screening programs, are expected to survive breast cancer are at a higher risk of non-BCSD [17]. To obtain unbiased estimates of the risk of BCSD, we applied a proportional subdistribution hazards regression (competing risk model), which connects the regression coefficients to a cumulative incidence function to estimate the unbiased risks in the presence of competing risks [18].
Categorical variables were compared using the Chi-Squared test. BCSD was calculated from the date of breast cancer diagnosis to the date of death due to breast cancer. Death due to other causes was defined as competing risks. Overall mortality was analyzed using the Kaplan-Meier method between groups with a log-rank test for significance. A proportional subdistribution hazards regression (competing risk model) was used to determine factors associated with BCSD. Prognostic factors with a P value < 0.05 in univariate analysis were incorporated into multivariate analysis. A P value < 0.05 was considered to be statistically significant in the multivariate analysis, while subdistribution hazard ratio (SHR) and a 95% confidence interval (CI) were used to adjust for prognostic variables. BCSD was set as the primary endpoint, because one of the primary goals of therapy is to reduce death attributable to the underlying breast cancer. In addition, Overall mortality was set as the secondary endpoint. To avoid multicollinearity, the multivariable analysis included the variables of T-classification, N-classification, ER (Estrogen receptor) status and PR(Progesterone receptor) status rather than the variables of stage and HR status.
A nomogram was established based on the competing risk regression model to predict the individual outcomes of BCSD at 3 years, 5 years, and 10 years. Age at diagnosis, race, marital status, tumor location, differentiation grade, histology, T classification, N classification, and ER and PR status were included in the model. The prognostic accuracy of the nomogram model was validated by internal validation, with bootstrapping to calculate a relatively unbiased measure of the ability to discriminate between patients as measured by the concordance index (C-index). The calibration was evaluated by plotting the observed Gray 3-year proportions, 5-year proportions and 10-year proportions compared with the corresponding nomogram for the 3-year, 5-year or 10-year predicted BCSD. Likewise, an external validation was performed in the validation cohort. The C-index was also used to quantify the discrimination ability of the prediction model. Since this study utilized data from the SEER database, which contained no personal identifying information, ethical approval and informed consent from patients in current study were not required.
All analysis was performed using the statistical software and R software (version 3.5.0). Rms package was used to performance survival analysis. Limma package was used to identify differentially expressed genes (DEGs) between IMPC and ICNT groups[19]. The adjusted P values < 0.05 and absolute fold change (FC) ≥ 2.0 were considered as the cutoff values. ClusterProfiler package was used to analyze the functions of DEGs [20]. Gene ontology (GO) and Kyoto Encyclopedia of Genes and Genomes pathway (KEGG) enrichment analyses were performed.
Result
Clinicopathological characteristics
A total of 332033 patients with early breast cancer were included in the study. The median age of the 330786 (99.62%) patients with IDC was 57 years compared with 58 years in the 1247 (0.38%) patients with IMPC. IMPC patients with larger tumor size (T3) (8.74% vs 4.54%; P < 0.001), more lymph node involvement (51.48% vs 33.73%, P < 0.001), and a higher stage (stage II 38.97% vs 37.88%, stage III 23.5% vs 12.45%, P < 0.001) compared with those with IDC. And IMPC was also related to a higher frequency of ER-positive and PR-positive status (88.69% vs 77.52%, P < 0.001; 78.75% vs 67.51%, P < 0.001, respectively) as well as an obviously higher frequency of HR-positive status (89.17% vs 78.87%, P < 0.001) compared with IDC. Additionally, similar percentages of patients with either IMPC or IDC were receiving. Compared to IDC group, IMPC group has a significant higher rate of receiving radiation treatment (59.42% vs 56.36%, P = 0.029) and chemotherapy treatment ((55.73% vs 48.92%, P < 0.001). IMPC group had a significant lower rate of breast conserving surgery (56.05% vs. 61.18%, P < 0.001). 35.12% of patients had at least 10 lymph nodes removed in IMPC group, which was significant higher than 29.48% in IDC group (P < 0.001). Given the clear group differences between IDC and IMPC group, propensity scores describing the likelihood of histology contingent on covariates were used to reweight the patient population for each group. Many distributional differences were eliminated, yielding IDC and IMPC group that were more similar (Supplementary Figure 1). The characteristics of the patients were shown in Table 1.
Survival analysis based on the Kaplan-Meier and Gray method
The median follow-up time for patients in the study was 64 months (range 1-179 months). After a PSM adjustment, based on Kaplan-Meier analysis, patients with IMPC had a favorable prognosis with marginal statistical significance compared with patients with IDC (overall mortality HR = 0.68; 95%CI, 0.53-0.86; P = 0.002). The cumulative incidence of the 3-year, 5-year and 10-year overall mortality for IMPC were 4.17%, 7.74% and 17.89%, respectively, compared with 6.73%, 13.15% and 26.08% respectively, in patients with IDC (Fig. 1). Based on Gray method, patients with IMPC had a favorable prognosis with significant statistical significance compared with patients with IDC (BCSD SHR = 0.64; 95%CI, 0.47-0.88; P = 0.006). The 3-year, 5-year and 10-year BCSD for the IMPC group was 3.58%, 4.84% and 10.94% compared with 4.05%, 8.93% and 16.24% for the IDC group.
Table 1
The characteristics of patients with resectable breast cancer
| Before PSM* | After PSM* | |||||
|---|---|---|---|---|---|---|
| Risk factors | IDC | IMPC | P | IDC | IMPC | P |
| (n= 330786) | (n= 1247) | (n= 1247) | (n= 1247) | |||
| Age | < 0.001 | 0.779 | ||||
| Young | 188118(56.87%) | 638(51.16%) | 631(50.6%) | 638(51.16%) | ||
| Old | 142668(43.13%) | 609(48.84%) | 616(49.4%) | 609(48.84%) | ||
| Race | 0.018 | 0.802 | ||||
| White | 262840(79.46%) | 951(76.26%) | 965(77.39%) | 951(76.26%) | ||
| Black | 36159(10.93%) | 162(12.99%) | 154(12.35%) | 162(12.99%) | ||
| Other | 31787(9.61%) | 134(10.75%) | 128(10.26%) | 134(10.75%) | ||
| Marital status | 0.079 | 0.847 | ||||
| Married | 205695(62.18%) | 746(59.82%) | 759(60.87%) | 746(59.82%) | ||
| Single | 50051(15.13%) | 216(17.32%) | 207(16.6%) | 216(17.32%) | ||
| Divorce | 75040(22.69%) | 285(22.85%) | 281(22.53%) | 285(22.85%) | ||
| Laterality | 0.887 | 0.841 | ||||
| Left | 167545(50.65%) | 627(50.28%) | 622(49.88%) | 627(50.28%) | ||
| Right | 163196(49.34%) | 620(49.72%) | 625(50.12%) | 620(49.72%) | ||
| Unknown | 45(0.01%) | 0(0%) | 0(0%) | 0(0%) | ||
| Location | 0.001 | 0.946 | ||||
| Central portion | 15190(4.59%) | 64(5.13%) | 57(4.57%) | 64(5.13%) | ||
| Upper-inner quadrant | 41080(12.42%) | 176(14.11%) | 182(14.6%) | 176(14.11%) | ||
| Lower-inner quadrant | 19594(5.92%) | 84(6.74%) | 78(6.26%) | 84(6.74%) | ||
| Upper-outer quadrant | 119222(36.04%) | 372(29.83%) | 377(30.23%) | 372(29.83%) | ||
| Lower-outer quadrant | 24612(7.44%) | 105(8.42%) | 97(7.78%) | 105(8.42%) | ||
| Other | 111088(33.58%) | 446(35.77%) | 456(36.57%) | 446(35.77%) | ||
| Differentiation grade | 0.039 | 0.772 | ||||
| Moderate-well | 132839(40.16%) | 465(37.29%) | 472(37.85%) | 465(37.29%) | ||
| Undifferentiated-Poor | 197947(59.84%) | 782(62.71%) | 775(62.15%) | 782(62.71%) | ||
| T-classification* | < 0.001 | 0.766 | ||||
| T1 | 207581(62.75%) | 712(57.1%) | 718(57.58%) | 712(57.1%) | ||
| T2 | 100128(30.27%) | 388(31.11%) | 398(31.92%) | 388(31.11%) | ||
| T3 | 15019(4.54%) | 109(8.74%) | 99(7.94%) | 109(8.74%) | ||
| T4 | 8058(2.44%) | 38(3.05%) | 32(2.57%) | 38(3.05%) | ||
| N-classification * | < 0.001 | 0.990 | ||||
| N0 | 219196(66.27%) | 605(48.52%) | 607(48.68%) | 605(48.52%) | ||
| N1 | 80924(24.46%) | 399(32%) | 398(31.92%) | 399(32%) | ||
| N2 | 20198(6.11%) | 134(10.75%) | 137(10.99%) | 134(10.75%) | ||
| N3 | 10468(3.16%) | 109(8.74%) | 105(8.42%) | 109(8.74%) | ||
| Stage * | < 0.001 | 0.828 | ||||
| I | 164286(49.67%) | 468(37.53%) | 469(37.61%) | 468(37.53%) | ||
| II | 125302(37.88%) | 486(38.97%) | 497(39.86%) | 486(38.97%) | ||
| III | 41198(12.45%) | 293(23.5%) | 281(22.53%) | 293(23.5%) | ||
| ER | < 0.001 | 0.899 | ||||
| Negative | 74369(22.48%) | 141(11.31%) | 139(11.15%) | 141(11.31%) | ||
| Positive | 256417(77.52%) | 1106(88.69%) | 1108(88.85%) | 1106(88.69%) | ||
| PR | < 0.001 | 0.844 | ||||
| Negative | 107456(32.49%) | 265(21.25%) | 261(20.93%) | 265(21.25%) | ||
| Positive | 223330(67.51%) | 982(78.75%) | 986(79.07%) | 982(78.75%) | ||
| HR | < 0.001 | 0.898 | ||||
| Negative | 69892(21.13%) | 135(10.83%) | 137(10.99%) | 135(10.83%) | ||
| Positive | 260894(78.87%) | 1112(89.17%) | 1110(89.01%) | 1112(89.17%) | ||
| nLN | < 0.001 | 0.773 | ||||
| 0 | 12438(3.76%) | 37(2.97%) | 38(3.05%) | 37(2.97%) | ||
| 1-10 | 220826(66.76%) | 772(61.91%) | 788(63.19%) | 772(61.91%) | ||
| >10 | 97522(29.48%) | 438(35.12%) | 421(33.76%) | 438(35.12%) | ||
| Surgery | < 0.001 | 1.000 | ||||
| BCS | 202389(61.18%) | 699(56.05%) | 699(56.05%) | 699(56.05%) | ||
| Mastectomy | 128397(38.82%) | 548(43.95%) | 548(43.95%) | 548(43.95%) | ||
| Radiotherapy | 0.029 | 0.326 | ||||
| Without | 144356(43.64%) | 506(40.58%) | 482(38.65%) | 506(40.58%) | ||
| With | 186430(56.36%) | 741(59.42%) | 765(61.35%) | 741(59.42%) | ||
| Chemotherapy | < 0.001 | 0.658 | ||||
| Without | 168950(51.08%) | 552(44.27%) | 563(45.15%) | 552(44.27%) | ||
| With | 161836(48.92%) | 695(55.73%) | 684(54.85%) | 695(55.73%) | ||
*P values obtained from the Chi squared test.
*Stage TNM, T, N-classification according to the 8th edition of AJCC staging.
Abbreviations: IDC: Infiltrating duct carcinoma.
PSM: propensity score matching.
IMPC: Invasive micropapillary carcinoma.
ER: Estrogen receptor.
PR: Progesterone receptor.
HR: Hormone receptor.
BCS: Breast conserving surgery.
nLN: number of lymph node resected.
Figure 1
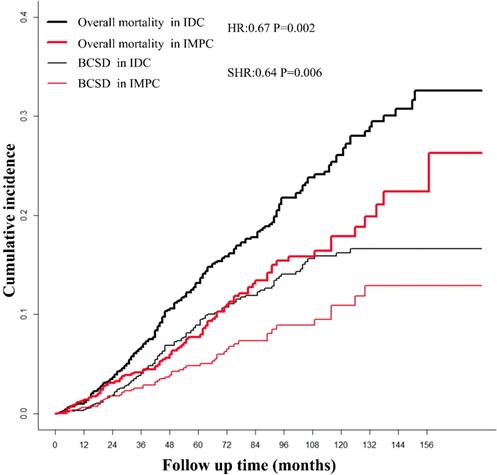
The survival of patients with IMPC and IDC based on Kaplan-Meier and Gray analysis. IMPC: Invasive micropapillary carcinoma; IDC: Infiltrative ductal cancer; BCSD: Breast cancer specific death.
Furthermore, we stratified the entire cohort by histology and analyzed BCSD according to patient and tumor characteristics based on univariate analysis of the competing risk regression model. The forest plot of subgroup analysis revealed that, in the young, white, married, left, other location, moderate-well, T2, N2, N3, stage III, ER positive, PR positive, HR positive, number of lymph node resected (nLN) > 10, with radiotherapy, with chemotherapy, with breast conserving and mastectomy surgery subgroups, patients with IMPC had a favorable prognosis compared with patients with IDC. In the divorce subgroup, patients with IDC had a favorable prognosis. Except for listed above subgroups, there was no significant difference between IMPC and IDC subgroup (Fig. 2).
Prognostic factors for IMPC and IDC based on competing risk model
We randomly divided the entire cohort into two parts: a train cohort (249024 patients) and a validation cohort (83009 patients). Relevant baseline variables were similarly distributed in the development and validation cohorts (Table 2). The competing risk regression model was used to explore the prognostic factors for patients with IMPC and IDC. Univariate analysis showed the race, marital status, differentiated grade, histology, T-classification, N-classification, stage and ER status, PR status, HR status, nLN, surgery, and chemotherapy were statistically significant prognostic factors for survival. Prognostic factors with a P value < 0.05 according to univariate analysis were incorporated into the multivariate analysis. Multivariate analysis showed the race, grade, histology, T-classification, N-classification, HR status, and nLN were statistically significant prognostic factors for BCSD (Table 3).
Table 2
Comparisons of patient characteristics of the study population in the train and validation cohorts
| Train cohort | Validation cohort | |||||
|---|---|---|---|---|---|---|
| Risk factors | IDC | IMPC | P | IDC | IMPC | P |
| (n= 248064) | (n= 960) | (n= 82722) | (n= 287) | |||
| Age | 0.002 | 0.006 | ||||
| Young | 140885(57.38%) | 497(52.75%) | 47233(57.1%) | 141(49.13%) | ||
| Old | 107179(42.62%) | 463(47.25%) | 35489(42.9%) | 146(50.87%) | ||
| Race | 0.012 | 0.672 | ||||
| White | 197182(79.92%) | 726(76.44%) | 65658(79.37%) | 225(78.4%) | ||
| Black | 27090(10.79%) | 126(13.6%) | 9069(10.96%) | 36(12.54%) | ||
| Other | 23792(9.29%) | 108(9.96%) | 7995(9.66%) | 26(9.06%) | ||
| Marital status | 0.109 | 0.669 | ||||
| Married | 154151(62.4%) | 574(60.73%) | 51544(62.31%) | 172(59.93%) | ||
| Single | 37505(14.75%) | 168(17.23%) | 12546(15.17%) | 48(16.72%) | ||
| Divorce | 56408(22.84%) | 218(22.04%) | 18632(22.52%) | 67(23.34%) | ||
| Laterality | 0.537 | 0.046 | ||||
| Left | 125472(50.66%) | 502(52.17%) | 42073(50.86%) | 125(43.55%) | ||
| Right | 122558(49.32%) | 458(47.83%) | 40638(49.13%) | 162(56.45%) | ||
| Unknown | 34(0.01%) | 0(0%) | 11(0.01%) | 0(0%) | ||
| Location | 0.001 | 0.531 | ||||
| Central portion | 11432(4.96%) | 47(5.51%) | 3758(4.54%) | 17(5.92%) | ||
| Upper-inner quadrant | 30673(12.16%) | 142(13.25%) | 10407(12.58%) | 34(11.85%) | ||
| Lower-inner quadrant | 14653(5.94%) | 65(6.33%) | 4941(5.97%) | 19(6.62%) | ||
| Upper-outer quadrant | 89634(35.94%) | 282(29.66%) | 29588(35.77%) | 90(31.36%) | ||
| Lower-outer quadrant | 18343(7.32%) | 79(8.56%) | 6269(7.58%) | 26(9.06%) | ||
| Other | 83329(33.68%) | 345(36.69%) | 27759(33.56%) | 101(35.19%) | ||
| Differentiation grade | 0.023 | 0.892 | ||||
| Moderate-well | 99655(40.74%) | 351(39.27%) | 33184(40.12%) | 114(39.72%) | ||
| Undifferentiated-Poor | 148409(59.26%) | 609(60.73%) | 49538(59.88%) | 173(60.28%) | ||
| T-classification* | < 0.001 | 0.005 | ||||
| T1 | 155485(62.92%) | 545(57.44%) | 52096(62.98%) | 167(58.19%) | ||
| T2 | 75235(30.22%) | 299(30.95%) | 24893(30.09%) | 89(31.01%) | ||
| T3 | 11318(4.39%) | 84(8.56%) | 3701(4.47%) | 25(8.71%) | ||
| T4 | 6026(2.47%) | 32(3.05%) | 2032(2.46%) | 6(2.09%) | ||
| N-classification * | < 0.001 | <0.001 | ||||
| N0 | 164426(65.77%) | 463(46.19%) | 54770(66.21%) | 142(49.48%) | ||
| N1 | 60639(24.53%) | 308(32.47%) | 20285(24.52%) | 91(31.71%) | ||
| N2 | 15120(6.41%) | 103(10.79%) | 5078(6.14%) | 31(10.8%) | ||
| N3 | 7879(3.29%) | 86(10.55%) | 2589(3.13%) | 23(8.01%) | ||
| Stage * | < 0.001 | < 0.001 | ||||
| I | 123214(49.36%) | 356(35.87%) | 41072(49.65%) | 112(39.02%) | ||
| II | 93990(37.87%) | 374(39.86%) | 31312(37.85%) | 112(39.02%) | ||
| III | 30860(12.77%) | 230(24.27%) | 10338(12.5%) | 63(21.95%) | ||
| ER | < 0.001 | < 0.001 | ||||
| Negative | 55901(23.04%) | 111(12.19%) | 18468(22.33%) | 30(10.45%) | ||
| Positive | 192163(76.96%) | 849(87.81%) | 64254(77.67%) | 257(89.55%) | ||
| PR | < 0.001 | 0.001 | ||||
| Negative | 80765(33.19%) | 198(24.03%) | 26691(32.27%) | 67(23.34%) | ||
| Positive | 167299(66.81%) | 762(75.97%) | 56031(67.73%) | 220(76.66%) | ||
| HR | <0.001 | <0.001 | ||||
| Negative | 52510(21.66%) | 105(11.61%) | 17382(21.01%) | 30(10.45%) | ||
| Positive | 195554(78.34%) | 855(88.39%) | 65340(78.99%) | 257(89.55%) | ||
| nLN | 0.001 | 0.053 | ||||
| 0 | 9356(3.76%) | 31(2.97%) | 3082(3.73%) | 6(2.09%) | ||
| 1-10 | 165603(66.76%) | 592(61.91%) | 55223(66.76%) | 180(62.72%) | ||
| >10 | 73105(29.48%) | 337(35.12%) | 24417(29.52%) | 101(35.19%) | ||
| Surgery | <0.001 | 0.539 | ||||
| BCS | 151925(60.66%) | 529(54.4%) | 50464(61%) | 170(59.23%) | ||
| Mastectomy | 96139(39.34%) | 431(45.6%) | 32258(39%) | 117(40.77%) | ||
| Radiotherapy | 0.303 | 0.008 | ||||
| Without | 108231(44.04%) | 403(41.38%) | 36125(43.67%) | 103(35.89%) | ||
| With | 139833(55.96%) | 557(58.62%) | 46597(56.33%) | 184(64.11%) | ||
| Chemotherapy | < 0.001 | 0.065 | ||||
| Without | 126677(50.84%) | 421(41.74%) | 42273(51.1%) | 131(45.64%) | ||
| With | 121387(49.16%) | 539(58.26%) | 40449(48.9%) | 156(54.36%) | ||
*P values obtained from the Chi squared test.
*Stage TNM, T, N-classification according to the 8th edition of AJCC staging.
Abbreviations: IDC: Infiltrating duct carcinoma.
PSM: propensity score matching.
IMPC: Invasive micropapillary carcinoma.
ER: Estrogen receptor.
PR: Progesterone receptor.
HR: Hormone receptor.
BCS: Breast conserving surgery.
nLN: number of lymph node resected.
Figure 2
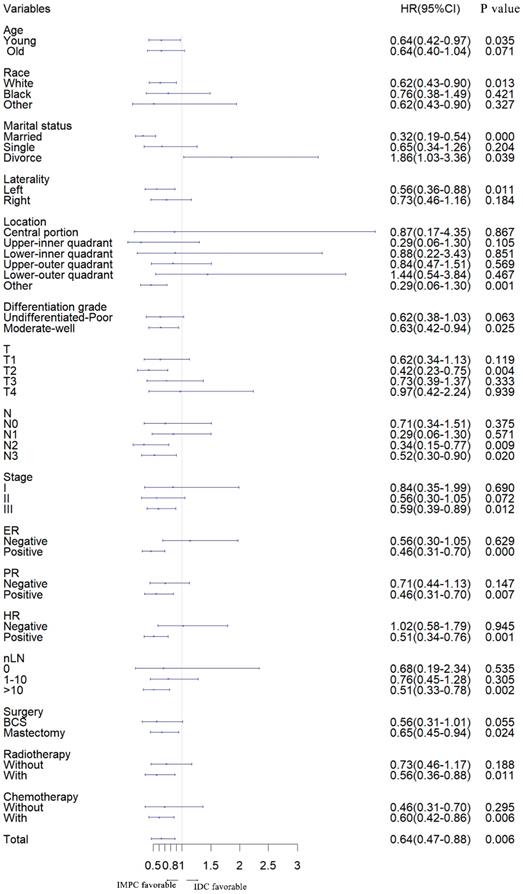
Forest plot of subgroup analysis. IMPC: Invasive micropapillary carcinoma; IDC: Infiltrative ductal cancer; SHR: Subdistribution hazard ratio; CI: Confidence index.
Table 3
Breast cancer-specific death in univariate and multivariate analysis based on competing risk model.
| Risk Factors | Univariate analysis# | Multivariate analysis# | ||
|---|---|---|---|---|
| SHR (95%CI) | P | SHR (95%CI) | P | |
| Age | ||||
| Young | Ref | |||
| Old | 0.8(0.57-1.12) | 0.196 | ||
| Race | ||||
| White | Ref | Ref | ||
| Black | 1.99(1.31-3) | 0.001 | 2.06(1.39-3.04) | < 0.001 |
| Other | 0.58(0.3-1.15) | 0.119 | 0.59(0.28-1.24) | 0.166 |
| Marital status | ||||
| Married | Ref | |||
| Single | 1.31(0.83-2.06) | 0.249 | ||
| Divorce | 1.46(1.00-2.15) | 0.053 | ||
| Laterality | ||||
| Left | Ref | |||
| Right | 1.07(0.77-1.5) | 0.685 | ||
| Location | ||||
| Central portion | Ref | |||
| Upper-inner quadrant | 0.49(0.18-1.32) | 0.158 | ||
| Lower-inner quadrant | 0.74(0.25-2.21) | 0.591 | ||
| Upper-outer quadrant | 0.92(0.39-2.16) | 0.847 | ||
| Lower-outer quadrant | 0.73(0.27-2.00) | 0.539 | ||
| Other | 1.20(0.52-2.77) | 0.668 | ||
| Histology | ||||
| IDC | Ref | Ref | ||
| IMPC | 0.63(0.44-0.9) | 0.012 | 0.56(0.39-0.81) | 0.002 |
| Differentiation grade | ||||
| Moderate-well | Ref | Ref | ||
| Undifferentiated-Poor | 3.25(2.29-4.61) | < 0.001 | 2.3(1.54-3.42) | < 0.001 |
| T-classification* | ||||
| T1 | Ref | Ref | ||
| T2 | 2.33(1.52-3.57) | < 0.001 | 1.57(1.00-2.47) | 0.049 |
| T3 | 6.21(3.84-10.04) | < 0.001 | 2.93(1.62-5.32) | < 0.001 |
| T4 | 15.35(9.2-25.61) | < 0.001 | 5.41(2.91-10.06) | < 0.001 |
| N-classification * | ||||
| N0 | Ref | Ref | ||
| N1 | 2.88(1.78-4.67) | < 0.001 | 2.97(1.69-5.21) | < 0.001 |
| N2 | 4.36(2.49-7.61) | < 0.001 | 3.54(1.73-7.26) | 0.001 |
| N3 | 9.98(6.03-16.53) | < 0.001 | 6.38(3.01-13.5) | < 0.001 |
| Stage * | ||||
| I | Ref | |||
| II | 2.94(1.61-5.37) | < 0.001 | ||
| III | 10.23(5.78-18.09) | < 0.001 | ||
| ER | ||||
| Negative | Ref | |||
| Positive | 0.29(0.2-0.43) | < 0.001 | ||
| PR | ||||
| Negative | Ref | |||
| Positive | 0.34(0.24-0.48) | < 0.001 | ||
| HR | ||||
| Negative | Ref | Ref | ||
| Positive | 0.31(0.21-0.46) | < 0.001 | 0.44(0.29-0.68) | < 0.001 |
| nLN | ||||
| 0 | Ref | Ref | ||
| 1-10 | 0.31(0.15-0.64) | 0.002 | 0.27(0.13-0.56) | < 0.001 |
| >10 | 0.67(0.33-1.39) | 0.284 | 0.17(0.08-0.39) | < 0.001 |
| Surgery | ||||
| BCS | Ref | Ref | ||
| Mastectomy | 2.81(1.96-4.02) | < 0.001 | 1.46(0.95-2.25) | 0.087 |
| Radiotherapy | ||||
| Without | Ref | |||
| With | 0.82(0.58-1.14) | 0.232 | ||
| Chemotherapy | ||||
| Without | Ref | Ref | ||
| With | 2.24(1.53-3.28) | < 0.001 | 0.77(0.49-1.2) | 0.250 |
#Univariate and multivariate analyses were conducted using competing risk model.
*Stage TNM, T, N-classification according to the 8th edition of AJCC staging.
SHR: Subdistribution hazard ratio.
HR: Hormone receptor.
ER: Estrogen receptor.
PR: Progesterone receptor.
IDC: Infiltrating duct carcinoma.
IMPC: Invasive micropapillary carcinoma.
BCS: Breast conserving surgery.
nLN: Number of lymph node resected.
Table 4
Point assignment and prognostic score in the nomogram
| Variable | Risk score |
|---|---|
| Race | |
| White | 31 |
| Black | 70 |
| Other | 0 |
| Histology | |
| IDC | 31 |
| IMPC | 0 |
| Differentiation grade | |
| Undifferentiated-Poor | 46 |
| Moderate-well | 0 |
| T-classification* | |
| T1 | 0 |
| T2 | 27 |
| T3 | 62 |
| T4 | 97 |
| N-classification* | |
| N0 | 0 |
| N1 | 59 |
| N2 | 69 |
| N3 | 100 |
| HR | |
| Negative | 45 |
| Positive | 0 |
| nLN | |
| 0 | 84 |
| 1-10 | 22 |
| >10 | 0 |
| Total prognostic score | Estimated 10-year BCSD rate (%) |
| 116 | 0.05 |
| 156 | 0.10 |
| 197 | 0.20 |
| 242 | 0.40 |
| 259 | 0.50 |
| 274 | 0.60 |
| 289 | 0.70 |
| 305 | 0.80 |
| 325 | 0.90 |
*Stage TNM, T, N-classification according to the 8th edition of AJCC staging.
IDC: Infiltrating duct carcinoma.
IMPC: Invasive micropapillary carcinoma.
ER: Estrogen receptor.
PR: Progesterone receptor.
nLN: Number of lymph node resected.
Construction of a nomogram model
A nomogram was constructed based on statistically significant factors identified by multivariate analysis from the competing regression model to predict the risk of BCSD in resectable breast cancer. The factors consisted of the race, grade, histology, T-classification, N-classification, HR status, and nLN. N-classification was the most predominant prognostic factor, followed by T-classification, nLN, race, HR status, grade and histology (Fig. 3). A vertical line was drawn from the factor to the point scale to determine the score of all variables (detailed in Table. 4). We then summarized all of the discrete values and drew a straight line from the total scale to the 3-year, 5-year, and the 10-year BCSD estimated lines to obtain the 3-year, 5-year, and 10-year BCSD rate. The bootstrap method was used to perform the internal validation. The C-index for the nomogram was 0.835 (95%CI: 0.830-0.843). The calibration plots showed a strong agreement for the 3-year, 5-year and 10-year BCSD rate between the nomogram prediction and realistic observation. In the external validation, the C-index for the nomogram was 0.818 (95%CI: 0.813 -0.821). The calibration plots showed a strong agreement for the 3-year, 5-year and 10-year BCSD rate between the nomogram prediction and realistic observation (Fig. 4).
Figure 3
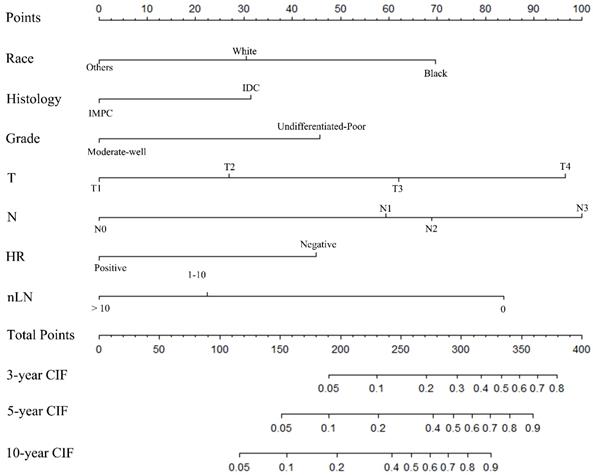
Nomogram to predict the probability of BCSD. The factors of marital status, differentiated grade, histology, T-classification, N-classification, HR status, and nLN were included in the model. IMPC: Invasive micropapillary carcinoma; IDC: Infiltrative ductal cancer; BCSD: Breast cancer specific death.
Figure 4
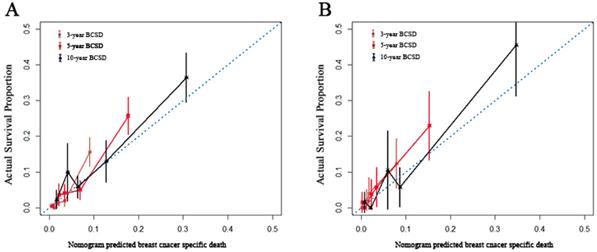
Internal and external validation of the nomogram. Calibration curves, which plot the average Gray estimate against the corresponding nomogram for 3-, 5- or 10- year predicted BCSD, were provided to evaluate the performance of the nomogram. The plot presented excellent agreement between the nomogram prediction and the actual observation for 3-, 5 and 10- year CSS. BCSD: Breast cancer specific death.
Identification of key genes and pathways in IMPC using bioinformatics analysis
To better understand whether IMPC is a unique biological disease, DEGs were identified between IMPC samples and ICNST samples. In present study, a total of 53 upregulated DEGs and 40 downregulated DEGs of IMPC was identified (Supplementary Table 3). Heatmap of the differentially expressed genes between IMPC samples and ICNST samples, with red indicating higher expression and green indicating lower expression (Supplementary Fig. 2). The GO analysis results showed that downregulated DEGs were significantly enriched in the following biological processes: extracellular structure organization, serine-type peptidase activity, extracellular matrix, cell-substrate adherens junction, cell-substrate junction. KEGG analysis of selective gene sets shows that upregulated DEGs significantly enriched for processes related to signal pathways: regulation of lipolysis in adipocytes, while downregulated DEGs significantly enriched for processes related to carbon metabolism, Rap1 signaling pathway.
Discussion
IMPC is a distinct histological subtype of breast cancer with a highly aggressive nature upon initial presentation [21-23]. In the current study, IMPC comprised 0.30% of the entire cohort, while previous studies found that IMPC accounted for < 3.0% of all breast cancers [9, 24]. Previous studies have indicated that IMPC usually presents with a later stage and has a higher propensity for lymph node involvement [11, 25-27]. Consistent with previous studies, our study demonstrated that patients with IMPC had more T3 tumors, a higher rate of N1-N3 nodal metastases, and a higher frequency of ER-positive, PR-positive, and HR-positive status. Previous studies showed that tumors containing the IMPC component tended to present with a larger size. Across clinical presentations, radiographic findings, locations and gross features, there were no obvious differences between IMPC and IDC [28]. It remains controversial whether the percentage of the micropapillary component is significant for either lymph node invasion or survival outcomes [1, 29]. The criteria for distinguishing between mixed and pure IMPC remain imprecise [28]. Molecular-genetic studies found that pure and mixed IMPC were remarkably similar at the genetic level [24]. Therefore, the presence of the IMPC component, rather than its percentage should be emphasized. The prognostic significance of tumor size in IMPC patients still requires further validation.
In the current study, IMPC had similar lymph node involvement (52.48%) compared with the range (40.3%-84.8%) of previous studies on IMPC which was significantly higher than that of IDC [8]. Ide et al suggested that 8.4% of breast cancer lesions contained the IMPC component in their study of 486 patients. They showed that the presence of the IMPC component alone was a significant predictive factor for lymph node metastasis, even if it was detected in only a small proportion of the tumor [1]. Simonetti's study demonstrated that IMPC had high expression of CD24 and low expression of CD44 compared with IDCs, which might explain the increased propensity for lymph node metastasis [30].
The prognosis of IMPC compared with IDC remains a topic of debate. Chen et al analyzed 100 patients with IMPC with a median 5-year follow-up and revealed that IMPC had a worse OS outcome than IDC (59% vs 77%, P = 0.004). This was consistent with a retrospective multicenter study by Shi (OS, 75.9% vs 89.5%; P<0.001). However, more recently, several studies referring to the outcomes of OS suggested that the OS of IMPC was not inferior to that of IDC [8, 10, 11, 31, 32]. Liu et al reported that patients with IMPC had similar prognosis compared with lymph node matched IDC patients, patients with IDC had a favorable prognosis in the T1N2-3 subset, whereas IMPC patients demonstrated comparatively better prognosis in the T2N2-3 subgroup [29]. The relationship between IMPC and prognosis may be confused by other factors in the univariate analysis. The prognostic value of IMPC was demonstrated via multivariate analysis (P < 0.001). After the adjustment for prognostic factors, especially the T- and N-classification, histology was significantly associated with BCSD (SHR = 0.64; 95%CI, 0.47-0.88; P = 0.006). IMPC correlates with an advanced stage (higher T- and N-classification), which is related to an unfavorable survival outcome, and may mask the prognostic value of IMPC for OS in univariate analysis. The established nomogram based on the competing regression model demonstrated that IMPC had favorable clinical outcomes compared with those of IDC, and that prognostic value of IMPC exceeded prognostic factors, grade. Therefore, IMPC might be an independent favorable prognostic factor for patients with breast cancer.
Lymph node metastasis and larger tumor size are widely considered unfavorable prognostic factors in the clinical practice. However, inferior clinical characteristics did not translate into a poor prognosis in the IMPC cohort. Lymph node status, primary tumor size, and clinical characteristics will often determine the follow-up treatment, including chemotherapy, radiation, and endocrine therapy [5]. Given the inferior clinicopathologic characteristics, clinicians usually chose aggressive treatment in clinical practice. Patients with IMPC have a higher probability of receiving endocrine therapy compared with patients with IDC due to higher HR positivity. In the study by Tang et al, a total of 898 patients (170 IMPC and 728 IDC) were enrolled. Hormone therapy was administered to 607 patients with HR positivity, of whom 135 (79.41%) were IMPC patients and 472 (64.84%) were IDC patients (P < 0.001) [33]. Previous studies identified that IMPC patients had higher histological grades than IDC patients (P < 0.05) [31, 33, 34]. Liu et al observed a significantly higher percentage (92.2%, P = 0.044) of IMPC patients receiving a regimen containing anthracycline compared with IDC patients (79.4%) [35]. A previous study identified that compared with IDC Patients, IMPC patients received chemotherapy more frequently, although the difference was not statistically significant [31, 33]. In addition, patients with IMPC were more likely to undergo resection with axillary lymph node dissection [36]. In our study, 38.45% of patients had at least 10 lymph nodes removed in IMPC group, which was significant higher than 30.55% in IDC group (P < 0.001).
IMPC as a unique entity is characterized by proliferation of carcinomatous cells organized in nesting pattern, separated from the extracellular matrix by an artifactually created spaces with the cellular apical surface polarity towards the outside[22, 37]. Determining whether a specific gene profile may cause abnormalities in IMPC polarity, the present study identified DEGs and signal pathways in IMPC. The GO functions reveal that cell-substrate interactions are among top affected molecular functions in downregulated DEGs for IMPC. This may suggests an important role for downregulated DEGs in promoting cellular polarity and shape maintenance [14, 37]. In cell adhesion, cell-cell interactions between cancer cells with endothelium determine the metastatic spread [38]. This may explain why IMPC has a higher rate of lymph node metastasis. Unfortunately, the gene expression profiles we used do not provide additional clinical information. Our genomic analyses have not identified direct specific genomic aberration that may explain clinical behavior of IMPC.
To the best of our knowledge, this is the first individual estimated nomogram for IMPC based on a multicentric large-population cohort. The value of the constructed nomogram is its ability to help guide treatment decision making with high cost-efficacy since specific guidelines have not been generated for this rare histological type. The C-index for the nomogram was 0.835 (95%CI: 0.830-0.843), which indicated accurate prognostic prediction for individual survival outcomes. Further studies should focus on how the widely-accepted inferior characteristics of IMPC that did not translate into a worse prognosis could be attributed to more intensive hormone therapy, more frequent chemotherapy, and distinct features, including a higher histological grade or the molecular and genetic mechanisms that underlie the highly aggressive nature of IMPC.
Limitation
Retrospective analyze are often affected by various biases. Information about is absent in the SEER database, which is important to this study. Thus, there was no clearly defined relationship between the established nomogram and chemotherapy. SEER database also lacks records of molecular information, such as HER2 status and Ki67, such information is also important to establish an intrinsic subtype model.
Conclusion
In conclusion, our present study focused on IMPC, a rare type of breast cancer that accounted for 0.3% of the entire cohort. IMPC was found to be a favorable independent prognostic factor. The present study identified gene expression profiles and signal pathways of IMPC, which deepen our understanding of the molecular mechanisms of IMPC. The nomogram generated in this study is the first to predict the survival outcomes for IMPC, it accurately predicts early breast cancer outcomes, and provides a reference for informed decision making in clinical practice.
Supplementary Material
Supplementary figures and tables.
Acknowledgements
This work was supported by Traditional Chinese Medicine (Integrated Chinese and Western Medicine) Key Discipline Construction Project of Zhejiang Province (2017-XK-A40) and the Natural Science Foundation of China (No.81773181).
Compliance with Ethical Standards
This article does not contain any studies with human participants or animals performed by any of the authors.
Competing Interests
The authors have declared that no competing interest exists.
References
1. Ide Y, Horii R, Osako T, Ogura K, Yoshida R, Iwase T. et al. Clinicopathological significance of invasive micropapillary carcinoma component in invasive breast carcinoma. Pathol Int. 2011;61:731-6
2. Gruel N, Benhamo V, Popova T, Gauthier A, Cascone I, Arnould L. et al. Micropapillary breast carcinoma is characterized by deregulation of genes involved in cell division control. Cancer research. 2012;72:87-92
3. Fisher ER, Palekar AS, Redmond C, Barton B, Fisher B. Pathologic Findings from the National Surgical Adjuvant Breast Project (Protocol No. 4): VI. Invasive Papillary Cancer. American journal of clinical pathology. 1980;73:313-22
4. Paterakos M, Watkin WG, Edgerton SM, Moore DH, Thor AD. Invasive micropapillary carcinoma of the breast: a prognostic study. Human pathology. 1999;30:1459-63
5. Gokce H, Durak MG, Akin MM, Canda T, Balci P, Ellidokuz H. et al. Invasive micropapillary carcinoma of the breast: a clinicopathologic study of 103 cases of an unusual and highly aggressive variant of breast carcinoma. The breast journal. 2013;19:374-81
6. Siriaunkgul S, Tavassoli F. Invasive micropapillary carcinoma of the breast. Modern pathology: an official journal of the United States and Canadian Academy of Pathology, Inc. 1993;6:660-2
7. Böcker W. WHO classification of breast tumors and tumors of the female genital organs: pathology and genetics. Verhandlungen der Deutschen Gesellschaft fur Pathologie. 2001;86:116-9
8. Li G, Yang S, Yao J, Wang Z, Yao G, Liu M. et al. Invasive micropapillary carcinoma of the breast had poor clinical characteristics but showed no difference in prognosis compared with invasive ductal carcinoma. World J Surg Oncol. 2016;14:207
9. Zhang D, Song J, Liu S, Li X. et al. Current Research Situation of Diagnosis and Treatment of Breast Invasive Micropapillary Carcinoma (IMPC). Cancer Genetics and Epigenetics. 2015;6:1-4
10. Yu JI, Choi DH, Park W, Huh SJ, Cho EY, Lim YH. et al. Differences in prognostic factors and patterns of failure between invasive micropapillary carcinoma and invasive ductal carcinoma of the breast: matched case-control study. Breast (Edinburgh, Scotland). 2010;19:231-7
11. Chen AC, Paulino AC, Schwartz MR, Rodriguez AA, Bass BL, Chang JC. et al. Population-based comparison of prognostic factors in invasive micropapillary and invasive ductal carcinoma of the breast. Br J Cancer. 2014;111:619-22
12. Li D, Zhong C, Tang X, Yu L, Ding K, Yuan Y. Competing nomograms help in the selection of elderly patients with colon cancer for adjuvant chemotherapy. J Cancer Res Clin Oncol. 2018;144:909-23
13. Fu J, Wu L, Jiang M, Li D, Jiang T, Hong Z. et al. Clinical Nomogram for Predicting Survival Outcomes in Early Mucinous Breast Cancer. PLoS One. 2016;11:e0164921
14. Gruel N, Fuhrmann L, Lodillinsky C, Benhamo V, Mariani O, Cedenot A. et al. LIN7A is a major determinant of cell-polarity defects in breast carcinomas. Breast Cancer Res. 2016;18:23
15. Little RJ, Rubin DB. Causal effects in clinical and epidemiological studies via potential outcomes: concepts and analytical approaches. Annual review of public health. 2000;21:121-45
16. McCandless LC, Gustafson P, Austin PC, Levy AR. Covariate balance in a Bayesian propensity score analysis of beta blocker therapy in heart failure patients. Epidemiol Perspect Innov. 2009;6:5-11
17. Fu J, Wu L, Jiang M, Li D, Jiang T, Fu W. et al. Real-world impact of non-breast cancer-specific death on overall survival in resectable breast cancer. Cancer. 2017;123:2432-43
18. Fine JP, Gray RJ. A proportional hazards model for the subdistribution of a competing risk. Journal of the American statistical association. 1999;94:496-509
19. Smyth GK. Limma: linear models for microarray data. Bioinformatics and computational biology solutions using R and Bioconductor: Springer. 2005 p. 397-420
20. Yu G, Wang L-G, Han Y, He Q-Y. clusterProfiler: an R package for comparing biological themes among gene clusters. Omics: a journal of integrative biology. 2012;16:284-7
21. Nassar H, Wallis T, Andea A, Dey J, Adsay V, Visscher D. Clinicopathologic analysis of invasive micropapillary differentiation in breast carcinoma. Modern Pathology. 2001;14:836
22. Walsh MM, Bleiweiss IJ. Invasive micropapillary carcinoma of the breast: eighty cases of an underrecognized entity. Hum Pathol. 2001;32:583-9
23. Boafo C, Eaton A, Stempel M, Filho JR-, King TA. Invasive micropapillary breast cancer: Single-institution experience in the modern era. Journal of Clinical Oncology. 2013;31:150-155
24. Marchio C, Iravani M, Natrajan R, Lambros MB, Geyer FC, Savage K. et al. Mixed micropapillary-ductal carcinomas of the breast: a genomic and immunohistochemical analysis of morphologically distinct components. J Pathol. 2009;218:301-15
25. Kuroda H, Sakamoto G, Ohnisi K, Itoyama S. Clinical and pathologic features of invasive micropapillary carcinoma. Breast Cancer. 2004;11:169-74
26. Chen AC, Paulino AC, Schwartz MR, Rodriguez AA, Bass BL, Chang JC. et al. Prognostic markers for invasive micropapillary carcinoma of the breast: a population-based analysis. Clinical breast cancer. 2013;13:133-9
27. Cui ZQ, Feng JH, Zhao YJ. Clinicopathological features of invasive micropapillary carcinoma of the breast. Oncology letters. 2015;9:1163-6
28. Yang Y-L, Liu B-B, Zhang X, Fu L. Invasive micropapillary carcinoma of the breast: an update. Archives of Pathology & Laboratory Medicine. 2016;140:799-805
29. Gokce H, Durak MG, Akin MM, Canda T, Balci P, Ellidokuz H. et al. Invasive micropapillary carcinoma of the breast: a clinicopathologic study of 103 cases of an unusual and highly aggressive variant of breast carcinoma. Breast J. 2013;19:374-81
30. Simonetti S, Terracciano L, Zlobec I, Kilic E, Stasio L, Quarto M. et al. Immunophenotyping analysis in invasive micropapillary carcinoma of the breast: role of CD24 and CD44 isoforms expression. Breast (Edinburgh, Scotland). 2012;21:165-70
31. Vingiani A, Maisonneuve P, Dell'Orto P, Farante G, Rotmensz N, Lissidini G. et al. The clinical relevance of micropapillary carcinoma of the breast: a case-control study. Histopathology. 2013;63:217-24
32. Rodrigues MA, Gamba CO, Faria JAQA, Ferreira Ê, Goes AM, Gomes DA. et al. Inner nuclear membrane localization of epidermal growth factor receptor (EGFR) in spontaneous canine model of invasive micropapillary carcinoma of the mammary gland. Pathology-Research and Practice. 2016;212:340-4
33. Tang S-l, Yang J-q, Du Z-g, Tan Q-w, Zhou Y-t, Zhang D. et al. Clinicopathologic study of invasive micropapillary carcinoma of the breast. Oncotarget. 2017;5:10-15
34. Zekioglu O, Erhan Y, Ciris M, Bayramoglu H, Özdemir N. Invasive micropapillary carcinoma of the breast: high incidence of lymph node metastasis with extranodal extension and its immunohistochemical profile compared with invasive ductal carcinoma. Histopathology. 2004;44:18-23
35. Liu Y, Huang X, Bi R, Yang W, Shao Z. Similar prognoses for invasive micropapillary breast carcinoma and pure invasive ductal carcinoma: a retrospectively matched cohort study in China. PloS one. 2014;9:e106564
36. Mahe E, Farag M, Boutross-Tadross O. Invasive micropapillary breast carcinoma: a retrospective study of classification by pathological parameters. The Malaysian journal of pathology. 2013;35:133
37. Gruel N, Benhamo V, Bhalshankar J, Popova T, Freneaux P, Arnould L. et al. Polarity gene alterations in pure invasive micropapillary carcinomas of the breast. Breast Cancer Res. 2014;16:R46
38. Chen D, Li Y, Wang L, Jiao K. SEMA6D Expression and Patient Survival in Breast Invasive Carcinoma. Int J Breast Cancer. 2015;2015:539721
Author contact
![]() Corresponding author: Ying Yuan, M.D., Ph.D. Department of Medical Oncology, The Second Affiliated Hospital of Zhejiang University School of Medicine, 88 Jiefang Road, Hangzhou 310000, Zhejiang, China. Tel.: +86-571-87784795 Fax: +86-571-87767088. Email: yuanying1999edu.cn
Corresponding author: Ying Yuan, M.D., Ph.D. Department of Medical Oncology, The Second Affiliated Hospital of Zhejiang University School of Medicine, 88 Jiefang Road, Hangzhou 310000, Zhejiang, China. Tel.: +86-571-87784795 Fax: +86-571-87767088. Email: yuanying1999edu.cn
Citation styles
APA
Li, D., Zhong, C., Cheng, Y., Zhu, N., Tan, Y., Zhu, L., Xu, D., Yuan, Y. (2019). A Competing Nomogram to Predict Survival Outcomes in Invasive Micropapillary Breast Cancer. Journal of Cancer, 10(27), 6801-6812. https://doi.org/10.7150/jca.27955.
ACS
Li, D.; Zhong, C.; Cheng, Y.; Zhu, N.; Tan, Y.; Zhu, L.; Xu, D.; Yuan, Y. A Competing Nomogram to Predict Survival Outcomes in Invasive Micropapillary Breast Cancer. J. Cancer 2019, 10 (27), 6801-6812. DOI: 10.7150/jca.27955.
NLM
Li D, Zhong C, Cheng Y, Zhu N, Tan Y, Zhu L, Xu D, Yuan Y. A Competing Nomogram to Predict Survival Outcomes in Invasive Micropapillary Breast Cancer. J Cancer 2019; 10(27):6801-6812. doi:10.7150/jca.27955. https://www.jcancer.org/v10p6801.htm
CSE
Li D, Zhong C, Cheng Y, Zhu N, Tan Y, Zhu L, Xu D, Yuan Y. 2019. A Competing Nomogram to Predict Survival Outcomes in Invasive Micropapillary Breast Cancer. J Cancer. 10(27):6801-6812.
This is an open access article distributed under the terms of the Creative Commons Attribution License (https://creativecommons.org/licenses/by/4.0/). See http://ivyspring.com/terms for full terms and conditions.