Journal of Cancer
ISSN: 1837-9664
3.2
Impact Factor
ISSN: 1837-9664

 Global reach, higher impact
J Cancer 2019; 10(24):6088-6094. doi:10.7150/jca.33244 This issue Cite
Research Paper
High expression of DOCK2 indicates good prognosis in acute myeloid leukemia
Ning Hu1, Yifan Pang2, Hongmian Zhao1, Chaozeng Si3, Hui Ding1, Li Chen1, Chao Wang1, Tong Qin1, Qianyu Li1, Yu Han1, Yifeng Dai4, Yijie Zhang5, Jinlong Shi6, Depei Wu7, Xinyou Zhang8 ![]() , Zhiheng Cheng4
, Zhiheng Cheng4 ![]() , Lin Fu1,9,10
, Lin Fu1,9,10 ![]()
1. Department of Hematology, Huaihe Hospital of Henan University, Kaifeng, 475000, China
2. Department of Medicine, William Beaumont Hospital, Royal Oak, MI 48073, USA
3. Department of Operations and Information Management, China-Japan Friendship Hospital, Beijing, 100029, China
4. Department of Pathology and Medical Biology, University Medical Center Groningen, University of Groningen, Groningen, Netherlands
5. Department of Respiratory, Huaihe Hospital of Henan University, Kaifeng, 475000, China
6. Department of Biomedical Engineering, Chinese PLA General Hospital, Beijing, 100853, China
7. Department of Hematology, The First Affiliated Hospital of Soochow University, Suzhou 215006, China
8. Department of Hematology, The Second Clinical Medical College (Shenzhen People's Hospital), Jinan University, Shenzhen 518020, China
9. Department of Hematology, The Second Affiliated Hospital of Guangzhou Medical University, Guangzhou, 510260, China
10. Translational Medicine Center, The Second Affiliated Hospital of Guangzhou Medical University, Guangzhou, 510260, China
Received 2019-1-17; Accepted 2019-8-20; Published 2019-10-15
Citation:
Hu N, Pang Y, Zhao H, Si C, Ding H, Chen L, Wang C, Qin T, Li Q, Han Y, Dai Y, Zhang Y, Shi J, Wu D, Zhang X, Cheng Z, Fu L. High expression of DOCK2 indicates good prognosis in acute myeloid leukemia. J Cancer 2019; 10(24):6088-6094. doi:10.7150/jca.33244. https://www.jcancer.org/v10p6088.htm
Other stylesAbstract
DOCK family proteins are evolutionarily conserved guanine nucleotide exchange factors for Rho GTPase with different cellular functions. It has been demonstrated that DOCK1 had adverse prognostic effect in acute myeloid leukemia (AML). We first analyzed data of 85 AML patients who were treated with chemotherapy and had available DOCK1 to DOCK11 expression information and found that DOCK1 and DOCK2 had prognostic significance in AML. In view of the known prognosis of DOCK1 in AML, we then explored the prognostic role of DOCK2. One hundred fifty-six AML patients with DOCK2 expression data were extracted from The Cancer Genome Atlas (TCGA) database and enrolled in this study. Patients were divided based on treatment modality into the chemotherapy group and the allogeneic hematopoietic stem cell transplant (allo-HSCT) group. Each group was divided into two groups by the median expression levels of DOCK2. In the chemotherapy group, high DOCK2 expression was associated with longer event-free survival (EFS, P=0.001) and overall survival (OS, P=0.007). In the allo-HSCT group, EFS and OS were not significantly different between high and low DOCK2 expression groups. Multivariate analysis showed that high DOCK2 expression was an independent favorable prognostic factor for both EFS and OS in all patients (all P<0.05). In conclusion, our results indicated that high DOCK2 expression, in contrast to DOCK1, conferred good prognosis in AML.
Keywords: acute myeloid leukemia, DOCK2, allogeneic hematopoietic stem cell transplantation, chemotherapy, prognosis
Introduction
Genetic abnormality is not only the pathogenic basis of acute myeloid leukemia (AML) [1] but also has important prognostic implications. For example, NPM1 mutations and double CEBPA mutations are associated with favorable prognosis in cytogenetically normal AML (CN-AML) [2, 3], while DNMT3A and WT1 mutations are adverse prognostic factors [4, 5].
The dedicators of cytokinesis (DOCK) family, including DOCK1 to DOCK11 proteins, are evolutionarily conserved guanine nucleotide exchange factors (GEF) for the Rho GTPases Rac. It is involved in various pathologies including cancers, immune disorders, and central nervous system diseases [6]. For instance, high DOCK1 expression is an unfavorable prognostic marker in breast cancer and ovarian cancer [7,8], and it induces migration and invasion of malignant cells in lung and brain cancer [9, 10]. Fukui Y et al found that DOCK2 is only expressed in hematopoietic tissues [11]. In addition, DOCK2 is also associated with the development of various cancers [12].
Previous study has shown that high DOCK1 expression conferred poor prognosis in AML [13], but the prognosis value of the other DOCK family members in AML is unclear. We screened all the DOCK family members and found that DOCK2 also had independent prognostic significance in AML.
Materials and Methods
Patients
From The Cancer Genome Atlas (TCGA) database (https://cancergenome.nih.gov/), 156 AML patients with DOCK2 expression data were enrolled in this study [14]. All patients were between ages 18 and 88, registered between November 2001 and March 2010, were selected from a set of more than 400 samples to reflect a realworld distribution of subtypes. Eighty-five patients were treated with chemotherapy alone, and other 71 received allo-HSCT. Patients treated with chemotherapy alone were defined as the chemotherapy group; patients who underwent allo-HSCT were defined as the allo-HSCT group. Then, each group was divided into two subgroups by the respective median DOCK2 expression levels. All clinical and molecular information including DOCK2 expression levels were publicly accessible from the TCGA website. All patients provided written informed consent and the research was approved by the Human Research Ethics Committee of Washington University. Primary endpoints were event-free survival (EFS) and overall survival (OS). EFS was defined as the time from diagnosis to removal from the study due to the absence of complete remission, relapse or death or was censored at the last follow-up. OS was defined as the time from diagnosis to death or was censored at the last follow-up.
Statistical Analysis
The clinical and molecular characteristics of patients were summarized using descriptive statistics. The Mann-Whitney U test and the chi-square test were used to compare continuous and categorical data, respectively. EFS and OS were estimated with the Kaplan-Meier method and compared using the log-rank test. Cox proportional hazard model was constructed for EFS and OS to identify possible prognostic factors among the clinical and molecular variables. All statistical analyses were performed by SPSS software 20.0 and GraphPad Prism software 5.0. For all statistical analyses, P-values were two-sided and P<0.05 was considered significant.
Results
Comparison of EFS and OS between different expression levels of DOCK1-11
To assess the prognostic significance of DOCK family in AML, EFS and OS patients with high and low expression groups of each DOCK family proteins were compared (Table 1). The results showed that DOCK1 was an adverse prognostic factor and DOCK2 was a favorable prognostic factor in AML. However, other DOCK members had no effect on EFS and OS.
Table 1
Comparison of EFS and OS between different expression levels of Dock1-11 based on chemotherapy.
| Variables | EFS | OS | |||
|---|---|---|---|---|---|
| χ2 | P-value | χ2 | P-value | ||
| Dock1 (high vs. low) | 14.908 | 0.000 | 14.343 | 0.000 | |
| Dock2(high vs. low) | 13.331 | 0.000 | 11.748 | 0.001 | |
| Dock3 (high vs. low) | 0.030 | 0.863 | 0.000 | 0.999 | |
| Dock4(high vs. low) | 1.598 | 0.206 | 1.658 | 0.198 | |
| Dock5(high vs. low) | 0.153 | 0.695 | 0.021 | 0.884 | |
| Dock6(high vs. low) | 0.930 | 0.335 | 0.312 | 0.576 | |
| Dock7 (high vs. low) | 0.552 | 0.457 | 1.261 | 0.262 | |
| Dock8(high vs. low) | 0.288 | 0.591 | 0.419 | 0.518 | |
| Dock9(high vs. low) | 0.170 | 0.680 | 0.497 | 0.481 | |
| Dock10(high vs. low) | 0.011 | 0.916 | 0.009 | 0.923 | |
| Dock11(high vs. low) | 0.054 | 0.817 | 0.002 | 0.968 | |
Abbreviations: EFS, event-free survival; OS, overall survival.
Table 2
Clinical and molecular characteristics of patients according to DOCK2 levels
| Characteristics | Chemotherapy group | Allo-HSCT group | |||||
|---|---|---|---|---|---|---|---|
| High DOCK2 (n = 42) | Low DOCK2 (n = 43) | P | High DOCK2 (n = 35) | Low DOCK2 (n = 36) | P | ||
| Age/years, median (range) | 66.5 (22-77) | 66 (33-88) | 0.324* | 51 (22-69) | 52.5 (18-72) | 0.890* | |
| Age group/n (%) | 0.311§ | 0.205§ | |||||
| < 60 years | 15 (35.7) | 11 (25.6) | 28 (80.0) | 24 (66.7) | |||
| ≥ 60 years | 27 (64.3) | 32 (74.4) | 7 (20.0) | 12 (33.3) | |||
| Gender/n (%) | 0.591§ | 0.288§ | |||||
| Male | 21 (50.0) | 24 (55.8) | 18 (51.4) | 23 (63.9) | |||
| Female | 21 (50.0) | 19 (44.2) | 17 (48.6) | 13 (36.1) | |||
| WBC/×109/L, median (range) | 15.2(1.0-171.9) | 12.3(0.7-297.4) | 0.329* | 30.9(1.2-223.8) | 27.7(0.6-90.4) | 0.200* | |
| BM blast/%, median (range) | 71 (30-97) | 74 (32-99) | 0.379* | 71 (34-100) | 70 (30-97) | 0.809* | |
| PB blast/%, median (range) | 23 (0-91) | 25 (0-98) | 0.972* | 48 (0-96) | 53 (0-90) | 0.801* | |
| FAB subtypes/n(%) | |||||||
| M0 | 4 (9.5) | 3 (7.0) | 0.713§ | 3 (8.6) | 6 (16.7) | 0.478§ | |
| M1 | 7 (16.7) | 13 (30.2) | 0.140§ | 14 (40.0) | 9 (25.0) | 0.177§ | |
| M2 | 12 (28.6) | 9 (20.9) | 0.414§ | 8 (22.9) | 10 (27.8) | 0.634§ | |
| M3 | 0 (0.0) | 0 (0.0) | 0 (0.0) | 1 (2.8) | 1.000§ | ||
| M4 | 11 (26.2) | 9 (20.9) | 0.568§ | 8 (22.9) | 5 (13.9) | 0.329§ | |
| M5 | 7 (16.7) | 6 (14.0) | 0.728§ | 1 (2.9) | 3 (8.3) | 0.614§ | |
| M6 | 1 (2.4) | 0 (0.0) | 0.494§ | 0 (0.0) | 1 (2.8) | 1.000§ | |
| M7 | 0 (0.0) | 2 (4.7) | 0.494§ | 0 (0.0) | 1 (1.4) | 1.000§ | |
| Karyotype/n(%) | |||||||
| Normal | 21 (50.0) | 19 (44.2) | 0.591§ | 11 (29.7) | 23 (62.2) | 0.005§ | |
| Complex | 3 (7.1) | 9 (20.9) | 0.117§ | 7 (18.9) | 5 (13.5) | 0.528§ | |
| inv(16)/CBFβ-MYH11 | 6 (14.3) | 0 (0.0) | 0.012§ | 5 (13.5) | 0 (0.0) | 0.054§ | |
| 11q23/MLL | 0 (0.0) | 3 (7.0) | 0.241§ | 2 (5.4) | 1 (2.7) | 1.000§ | |
| t(15;17)/PML-RARA | 0 (0.0) | 0 (0.0) | 1 (2.7) | 1 (2.7) | 1.000§ | ||
| t(9;22)/BCR-ABL1 | 0 (0.0) | 1 (2.3) | 1.000§ | 2 (5.4) | 0 (0.0) | 0.493§ | |
| t(8;21)/RUNX1-RUNX1T1 | 4 (9.5) | 2 (4.7) | 0.433§ | 0 (0.0) | 1 (2.7) | 1.000§ | |
| Others | 8 (19.0) | 9 (20.9) | 0.828§ | 4 (10.8) | 2 (5.4) | 0.674§ | |
| Risk/n(%) | |||||||
| Good | 10 (23.8) | 2 (4.7) | 0.014§ | 5 (14.3) | 2 (5.6) | 0.260§ | |
| Intermediate | 26 (61.9) | 20 (46.5) | 0.154§ | 23 (65.7) | 17 (47.2) | 0.116§ | |
| Poor | 6 (14.3) | 19 (44.2) | 0.002§ | 6 (17.1) | 17 (47.2) | 0.007§ | |
| FLT3-ITD/n(%) | 0.366§ | 0.730§ | |||||
| Presence | 9 (21.4) | 6 (14.0) | 9 (25.7) | 8 (22.2) | |||
| Absence | 33 (78.6) | 37 (86.0) | 29 (78.4) | 28 (75.7) | |||
| NPM1/n(%) | 0.440§ | 0.246§ | |||||
| Mutation | 15 (35.7) | 12 (27.9) | 11 (31.4) | 7 (19.4) | |||
| Wildtype | 27 (64.3) | 31 (72.1) | 24 (68.6) | 29 (80.6) | |||
| CEBPA/n(%) | 0.557§ | 0.033§ | |||||
| Single mutation | 1 (2.4) | 2 (4.7) | 4 (11.4) | 1 (2.8) | |||
| Double mutation | 0 (0.0) | 0 (0.0) | 3 (8.6) | 0 (0.0) | |||
| Wild type | 41 (97.6) | 41 (95.3) | 28 (80.0) | 35 (97.2) | |||
| DNMT3A/n(%) | 0.859§ | 0.044§ | |||||
| Mutation | 11 (26.2) | 12 (27.9) | 12 (34.3) | 5 (13.9) | |||
| Wildtype | 31 (73.8) | 31 (72.1) | 23 (65.7) | 31 (86.1) | |||
| IDH1/IDH2/n(%) | 0.366§ | 0.730§ | |||||
| Mutation | 9 (21.4) | 6 (14.0) | 9 (25.7) | 8 (22.2) | |||
| Wildtype | 33 (78.6) | 37 (86.0) | 26 (74.3) | 28 (77.8) | |||
| RUNX1/n(%) | 0.156§ | 0.260§ | |||||
| Mutation | 6 (14.3) | 2 (4.7) | 2 (5.7) | 6 (16.7) | |||
| Wildtype | 36 (85.7) | 41 (95.3) | 33 (94.3) | 30 (83.3) | |||
| WT1/n(%) | 1.000§ | 0.478§ | |||||
| Mutation | 1 (2.4) | 1 (2.3) | 5 (14.3) | 3 (8.3) | |||
| Wildtype | 41 (97.6) | 42 (97.7) | 30 (85.7) | 33 (91.7) | |||
| MLL-PTD/n(%) | 0.360§ | 0.614§ | |||||
| Presence | 1 (2.4) | 4 (9.3) | 1 (2.9) | 3 (8.3) | |||
| Absence | 41 (97.6) | 39 (90.7) | 34 (97.1) | 33 (91.7) | |||
| NRAS/KRAS/n(%) | 0.505§ | 0.710§ | |||||
| Mutation | 7 (16.7) | 5 (11.6) | 4 (11.4) | 3 (8.3) | |||
| Wildtype | 35 (83.3) | 38 (88.4) | 31 (88.6) | 33 (91.7) | |||
| TET2/n(%) | 0.778§ | 1.000§ | |||||
| Mutation | 5 (11.9) | 6 (14.0) | 2 (5.7) | 2 (5.6) | |||
| Wildtype | 37 (88.1) | 37 (86.0) | 33 (94.3) | 34 (94.4) | |||
| TP53/n(%) | 0.049§ | 0.115§ | |||||
| Mutation | 2 (4.8) | 9 (20.9) | 0 (0.0) | 4 (11.1) | |||
| Wildtype | 40 (95.2) | 34 (79.1) | 35 (100.0) | 32 (88.9) | |||
| Relapse/n(%) | 0.227§ | 0.614§ | |||||
| Yes | 18 (42.9) | 13 (30.2) | 25 (71.4) | 23 (63.9) | |||
| No | 24 (57.1) | 30 (69.8) | 10 (28.6) | 13 (36.1) | |||
Abbreviations: WBC: white blood cell; BM: bone marrow; PB: peripheral blood; FAB: French American British.
*denotes Mann-Whitney U test; §denotes chi-square test.
Figure 1
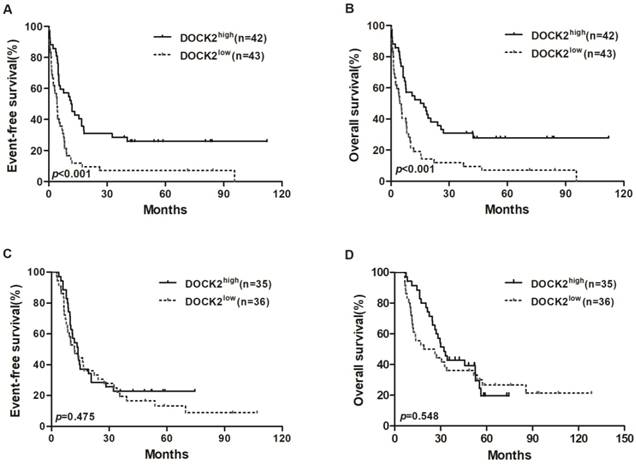
Kaplan-Meier curves of EFS and OS in the chemotherapy and allo-HSCT groups. (A, B) In the chemotherapy group, high DOCK2 expressers had longer EFS and OS than low expressers. (C, D) EFS and OS were not significantly different between high and low DOCK2 expression subgroups in the allo-HSCT group.
Association between DOCK2 expression and patient's characteristics
Comparison of clinical and molecular characteristics between different expression subgroups within chemotherapy and allo-HSCT groups were summarized in Table 2. In the chemotherapy group, high DOCK2 expression group had more good-risk patients (P=0.014), fewer poor-risk patients (P=0.002) and less TP53mutations (P=0.049) than low expression group. Six patients among the low expression group harbored CBFβ-MYH11, which was not found in the high expression group (P=0.012). No significant difference was found in age, sex distribution, peripheral white blood cell (WBC) count and bone marrow blast (BM) percentage at diagnosis, French-American-British (FAB) classification, frequency of other recurrent genetic mutations (FLT3-ITD, NPM1, CEBPA, IDH1/IDH2, RUNX1, MLL-PTD, NRAS/KRAS, TET2, WT1 and TP53), or relapse rate between the high and low expression subgroups.
In the allo-HSCT group, high DOCK2 expression group had fewer poor-risk patients (P=0.007), fewer normal karyotype patients (P=0.005), more CEBPA (P=0.033) and DNMT3A mutations (P=0.044) than the low expression group. No significant difference was found in age, sex distribution, BM blasts, FAB classification, frequent AML mutations (FLT3-ITD, NPM1, IDH1/IDH2, RUNX1, MLL-PTD, NRAS/KRAS, TET2, WT1 and TP53), or relapse rate between two subgroups.
Prognostic value of DOCK2 in AML
In the chemotherapy group, high DOCK2 expressers had longer EFS and OS (all P<0.001; Figure 1A and 1B) than low expressers, but survival was not significantly different between DOCK2 high and low expression subgroups in the allo-HSCT group (Figure 1C and 1D).
We chose DOCK2 expression levels (low vs. high), therapy method (chemotherapy vs. allo-HSCT), age (<60 vs. ≥60 years), WBC counts (<20×109/L vs. ≥20×109/L), FLT3-ITD (positive vs. negative) and common AML mutations (NPM1, DNMT3A, IDH1/IDH2, RUNX1, WT1, CEBPA and TP53, mutated vs.wild) to construct multivariate analysis of EFS and OS.
In the chemotherapy group, multivariate analysis showed that age ≥60 years and TP53 mutations were independent risk factors for EFS and OS (all P<0.05), and high DOCK2 expression was an independent favorable factor for EFS and OS (all P<0.05, Table 3). In the allo-HSCT group, multivariate analysis showed that FLT3-ITD was an independent risk factor for EFS and OS (all P<0.05). WBC counts ≥20×109/L and WT1 mutations were independent risk factors for EFS. Mutations in RUNX1 and TP53 were independent risk factors for OS (all P<0.05, Table 4).
In all patients, multivariate analysis showed that high DOCK2 expression and allo-HSCT were independent favorable factors for EFS and OS (all P<0.05). Age ≥60 years, WBC counts ≥20×109/L and mutations in DNMT3A, RUNX1 and TP53 were independent risk factors for EFS and OS (all P<0.05, Table 5).
Correlation analysis of DOCK2 expression and genome-wide microRNA and gene expression profile
In order to further evaluate the role of DOCK2 in AML, we obtained DOCK2-associated gene expression profiles and mircroRNA from TCGA database through high-throughput sequencing. There were 907 genes were positively associated with DOCK2 expression, and 9712 genes were negatively associated with DOCK2 expression (P<0.05, fold change=1.5, Figure. 2A). Then, we identified 50 up-regulated and 86 down-regulated microRNAs that were significantly correlated with DOCK2 expression (P<0.05, fold change=1.5, Figure. 2B). Furthermore, gene ontology (GO) enrichment analysis suggested that the genes related to DOCK2 expression were mainly concentrated in "diencephalon development", "adenohypophysis development", "axon guidance", "neuron projection guidance", "hypothalamus development", "limbic system development", "neurotrophin TRK receptor signaling pathway", "neurotrophin signaling pathway", "appendage morphogenesis", and "limb morphogenesis" pathways (Figure. 2C).
Figure 2
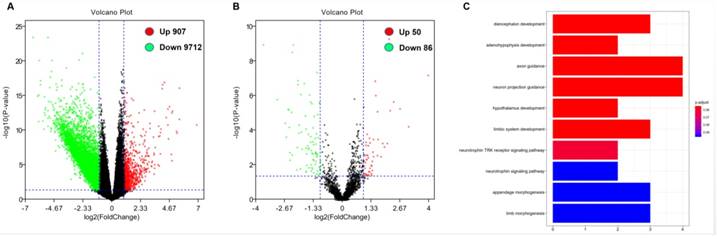
Genome-wide gene/microRNA expression profiles and cell signaling pathways associated with DOCK2 expression. (A) Volcano plot of differential gene expression. Up-regulated and down-regulated genes were labeled with red and green dots, respectively. (B) Volcano plot of differential microRNA expression. Up-regulated and down-regulated microRNAs were labeled with red and green dots, respectively. (C) Gene ontology (GO) enrichment analysis of genes related to DOCK2 expression.
Table 3
Multivariate analyses for EFS and OS based on chemotherapy
| Variables | EFS | OS | |||
|---|---|---|---|---|---|
| HR (95%CI) | P-value | HR (95%CI) | P-value | ||
| DOCK2 (high vs. low) | 2.301 (1.381-3.835) | 0.001 | 1.974 (1.201-3.245) | 0.007 | |
| Age (< 60 v. ≥ 60 years) | 2.909 (1.550-5.460) | 0.001 | 2.582 (1.355-4.918) | 0.004 | |
| WBC (<20 vs. ≥20×109/L) | 1.382 (0.777-2.457) | 0.270 | 1.263 (0.719-2.220) | 0.416 | |
| NPM1,mutated v wild type | 0.653 (0.352-1.210) | 0.175 | 0.813 (0.439-1.504) | 0.509 | |
| DNMT3A, mutated v wild type | 0.674 (0.375-1.211) | 0.187 | 0.631 (0.357-1.117) | 0.114 | |
| FLT3-ITD, presence v absence | 0.801 (0.411-1.558) | 0.512 | 0.974 (0.495-1.916) | 0.939 | |
| IDH1/IDH2, mutated v wild typemutated v wild type | 1.077 (0.555-2.089) | 0.827 | 1.106 (0.560-2.185) | 0.772 | |
| RUNX1, mutated v wild type | 0.508 (0.218-1.185) | 0.117 | 0.500 (0.214-1.168) | 0.109 | |
| WT1, mutated v wild type | 0.638 (0.134-3.041) | 0.573 | 1.094 (0.134-8.929) | 0.933 | |
| CEBPA, mutated v wild type | 0.471 (0.139-1.596) | 0.226 | 0.461 (0.136-1.567) | 0.215 | |
| TP53, mutated v wild type | 0.351 (0.154-0.801) | 0.013 | 0.414 (0.184-0.933) | 0.033 | |
Abbreviations: EFS: Event-free survival; OS: Overall survival; WBC: white blood cell.
Table 4
Multivariate analyses for EFS and OS based on allo-HSCT.
| Variables | EFS | OS | |||
|---|---|---|---|---|---|
| HR (95%CI) | P-value | HR (95%CI) | P-value | ||
| DOCK2 (high vs. low) | 1.741 (0.921-3.294) | 0.088 | 1.386 (0.705-2.725) | 0.344 | |
| Age (< 60 v. ≥ 60 years) | 0.869 (0.453-1.670) | 0.674 | 1.174 (0.600-2.299) | 0.639 | |
| WBC (<20 vs. ≥20×109/L) | 2.151 (1.127-4.105) | 0.020 | 1.339 (0.687-2.612) | 0.391 | |
| NPM1,mutated v wild type | 1.878 (0.885-3.984) | 0.101 | 1.476 (0.621-3.507) | 0.378 | |
| DNMT3A, mutated v wild type | 0.711 (0.344-1.468) | 0.356 | 0.553 (0.258-1.183) | 0.127 | |
| FLT3-ITD, presencevabsence | 0.407 (0.201-0.826) | 0.013 | 0.451 (0.206-0.990) | 0.047 | |
| IDH1/IDH2, mutated v wild typemutated v wild type | 0.800 (0.354-1.806) | 0.591 | 1.058 (0.442-2.529) | 0.900 | |
| RUNX1, mutated v wild type | 0.822 (0.333-2.030) | 0.671 | 0.386 (0.155-0.958) | 0.040 | |
| WT1, mutated v wild type | 0.361 (0.137-0.949) | 0.039 | 0.607 (0.239-1.540) | 0.293 | |
| CEBPA, mutated v wild type | 1.358 (0.502-3.676) | 0.547 | 1.106 (0.402-3.042) | 0.846 | |
| TP53, mutated v wild type | 0.371 (0.112-1.222) | 0.103 | 0.155 (0.043-0.557) | 0.004 | |
Abbreviations: EFS: Event-free survival; OS: Overall survival; WBC: white blood cell.
Table 5
Multivariate analyses for EFS and OS based on chemotherapy and allo-HSCT.
| Variables | EFS | OS | |||
|---|---|---|---|---|---|
| HR (95%CI) | P-value | HR (95%CI) | P-value | ||
| DOCK2 (high vs. low) | 1.721 (1.175-2.518) | 0.005 | 1.489 (1.012-2.191) | 0.044 | |
| Chemotherapy v allo-HSCT | 1.599 (1.097-2.330) | 0.015 | 1.946 (1.301-2.910) | 0.001 | |
| Age (< 60 vs. ≥ 60 years) | 1.664 (1.107-2.500) | 0.014 | 1.957 (1.270-3.016) | 0.002 | |
| WBC (<20 vs. ≥20×109/L) | 1.649 (1.103-2.465) | 0.015 | 1.331 (0.883-2.005) | 0.172 | |
| NPM1, mutated v wild type | 0.936 (0.593-1.477) | 0.777 | 0.904 (0.559-1.461) | 0.680 | |
| DNMT3A, mutated v wild type | 0.578 (0.382-0.876) | 0.010 | 0.536 (0.352-0.816) | 0.004 | |
| FLT3-ITD, presence v absence | 0.781 (0.488-1.252) | 0.305 | 0.888 (0.533-1.478) | 0.646 | |
| IDH1/IDH2, mutated v wild typemutated v wild type | 1.135 (0.705-1.830) | 0.602 | 1.229 (0.746-2.026) | 0.419 | |
| RUNX1, mutated v wild type | 0.535 (0.294-0.974) | 0.041 | 0.413 (0.224-0.764) | 0.005 | |
| WT1, mutated v wild type | 0.612 (0.290-1.288) | 0.196 | 0.762 (0.352-1.650) | 0.491 | |
| CEBPA, mutated v wild type | 0.580 (0.273-1.232) | 0.156 | 0.671 (0.310-1.453) | 0.312 | |
| TP53, mutated v wild type | 0.310 (0.160-0.600) | 0.001 | 0.269 (0.137-0.531) | 0.000 | |
Abbreviations: EFS: Event-free survival; OS: Overall survival; WBC: white blood cell.
Discussion
Our study showed that high DOCK2 expression was an independent favorable factor in AML patients who underwent chemotherapy alone, but not in patients who also underwent allo-HSCT. Consistent with previous studies, we also found that high DOCK1 expression was an adverse factor in AML [13].
Previous researches have demonstrated that TP53 mutation and older age were negative prognostic factors in AML [15,16], while CBFβ-MYH11 was associated with favorable prognosis in AML [17]. Our study found that in high DOCK2 expression patients, there were more good-risk patients, more CBFβ-MYH11, and fewer TP53 mutations, suggesting that high expression of DOCK2 was more likely to co-exist with CBFβ-MYH11 rather than TP53 mutations. In the chemotherapy group, the survival analysis indicated that high DOCK2 expression was a favorable factor for EFS and OS, but it not in the allo-HSCT group, suggesting that the unfavorable effect of low DOCK2 expression might be overcome by allo-HSCT.
DOCK2 has been shown to be a specific Rac activator in mature lymphocytes [18]. It is involved in neutrophil chemotaxis [19] and NK cells differentiation [20]. Previous study found that DOCK2 plays a key role in the regulation of cell proliferation in diffuse large B cell lymphoma and follicular lymphoma via the ERK signaling pathway [21]. Nishihara H et al found that DOCK2 is associated with CrkL and regulates Rac1 in human leukemia cell lines [22]. Another study revealed that DOCK2 regulates CXCR4 signaling in immature hematopoietic cells [23]. In the present study, DOCK2 was associated with "neurotrophin TRK receptor signaling pathway", "neurotrophin signaling pathway", "appendage morphogenesis". We speculate that DOCK2 may play a prognostic role in leukemia by interacting with genes in these functional pathways.
A previous study suggested that knocking down DOCK2 could sensitize FLT3-ITD leukemic cells to cytarabine treatment through the inhibition of Rac1 pathway [24], whereas in this study, we observed a favorable prognostic impact of high DOCK2 expression in AML patients. This discrepancy might be related to the different research objects of the two studies, since we did not specifically study AML patients with FLT3-ITD.
DOCK2 may play different roles in the lymphoid and myeloid system [21]. This is similar to LEF1. High LEF1 expression has been reported as a favorable prognostic factor in CN-AML [25], but it is also an adverse prognostic factor in adult B-precursor acute lymphoblastic leukemia [26]. Low expression of DOCK2 is associated with poorer prognosis in colorectal cancer [27]. However, the expression level of DOCK2 is positively correlated with the proliferation rate of CXCL13-induced prostate cancer cells [28]. We theorized that DOCK2 had tissue-specific effects in different malignancies.
In summary, two of the 11 members of the DOCK family have prognostic significance in AML. DOCK1 has adverse prognostic effect and DOCK2 the opposite. This finding may further deepen the risk stratification system of AML.
Acknowledgements
This work was supported by grants from the National Natural Science Foundation of China (81500118, 61501519), the China Postdoctoral Science Foundation funded project (project No.2016M600443) and PLAGH project of Medical Big Data (Project No.2016MBD-025.
Competing Interests
The authors have declared that no competing interest exists.
References
1. Prada-Arismendy J, Arroyave JC, Röthlisberger S. Molecular Biomarkers in Acute Myeloid Leukemia. Blood Rev. 2017;31(1):63-76
2. Döhner K, Schlenk RF, Habdank M. et al. Mutant nucleophosmin (NPM1) predicts favorable prognosis in younger adults with acute myeloid leukemia and normal cytogenetics: interaction with other gene mutations. Blood. 2005;106(12):3740-3746
3. Dufour A, Schneider F, Metzeler K. et al. Acute myeloid leukemia with biallelic CEBPA gene mutations and normal karyotype represents a distinct genetic entity associated with a favorable clinical outcome. J Clin Oncol. 2010;28(4):570-577
4. Lin N, Fu W, Zhao C. et al. Biologico-clinical significance of DNMT3A variants expression in acute myeloid leukemia. Biochem Biophys Res Commun. 2017;494:270-277
5. Lyu X, Xin Y, Mi R. et al. Over expression of Wilms tumor 1 gene as a negative prognostic indicator in acute myeloid leukemia. PLoS ONE. 2014;9(3):e92470
6. Gadea G, Blangy A. Dock-family exchange factors in cell migration and disease. Eur J Cell Biol. 2014;93:466-477
7. Laurin M, Huber J, Pelletier A. et al. Rac-specific guanine nucleotide exchange factor DOCK1 is a critical regulator of HER2-mediated breast cancer metastasis. Proc Natl Acad Sci U S A. 2013;110:7434-7439
8. Zhao F, Siu MK, Jiang L. et al. Overexpression of dedicator of cytokinesis I (Dock180) in ovarian cancer correlated with aggressive phenotype and poor patient survival. Histopathology. 2011;59(6):1163-1172
9. Li H, Yang L, Fu H. et al. Association between Galphai2 and ELMO1/Dock180 connects chemokinesignalling with Rac activation and metastasis. Nat Commun. 2013;4:1706
10. Haizhong Feng, Bo Hu, Kun-Wei Liu. et al. Activation of Rac1 by Src-dependent phosphorylation of Dock180(Y1811) mediates PDGFRa-lphastimulated glioma tumorigenesis in mice and humans. J. Clin. Invest. 2011;121:4670-4684
11. Fukui Y, Hashimoto O, Sanui T. et al. Haematopoietic cell-specific CDM family protein DOCK2 is essential for lymphocyte migration. Nature. 2001;412(6849):826-831
12. Chen Y, Meng F, Wang B. et al. Dock2 in the development of inflammation and cancer. Eur J Immunol. 2018;48(6):915-922
13. Sze-Hwei Lee, Yu-Chiao Chiu, Yi-Hung Li. et al. High expression of dedicator of cytokinesis 1 (DOCK1) confers poor prognosis in acute myeloid leukemia. Oncotarget. 2017;8(42):72250-72259
14. Ley TJ, Miller C, Ding L. et al. Genomic and epigenomic landscapes of adult de novo acute myeloid leukemia. N Engl J Med. 2013;368:2059-2074
15. Stengel A, Kern W, Haferlach T. et al. The impact of TP53 mutations and TP53 deletions on survival varies between AML, ALL, MDS and CLL: an analysis of 3307 cases. Leukemia. 2017;31(3):705-711
16. Döhner H, Weisdorf DJ, Bloomfield CD. Acute myeloid leukemia. New Engl J Med. 2015;373:1136-1152
17. Kurosawa S, Miyawaki S, Yamaguchi T. et al. Prognosis of patients with core binding factor acute myeloid leukemia after first relapse. Haematologica. 2013;98:1525-1531
18. Fukui Y, Hashimoto O, Sanui T. et al. Haematopoietic cell-specific CDM family protein DOCK2 is essential for lymphocyte migration. Nature. 2001;412:826-831
19. Nishikimi A, Fukuhara H, Su W. et al. Sequential regulation of DOCK2 dynamics by two phospholipids during neutrophil chemotaxis. Science. 2009;324:384-387
20. Sakai Y, Tanaka Y, Yanagihara T. et al. The Rac activator DOCK2 regulates naturalkiller cell-mediated cytotoxicity in mice through the lytic synapse formation. Blood. 2013;122:386-393
21. Wang L, Nishihara H, Kimura T. et al. DOCK2 regulates cell proliferation through Rac and ERK activation in B cell lymphoma. Biochem Biophys Res Commun. 2010;395(1):111-115
22. Nishihara H, Maeda M, Oda A. et al. DOCK2 associates with CrkL and regulates Rac1 in human leukemia cell lines. Blood. 2002;100(12):3968-3974
23. Kikuchi T, Kubonishi S, Shibakura M. et al. Dock2 participates in bone marrow lympho-hematopoiesis. Biochem Biophys Res Commum. 2008;367(1):90-96
24. Wu M, Hamaker M, Li L. et al. DOCK2 Interacts with FLT3 and Modulates the Survival of FLT3-Expressing Leukemia Cells. Leukemia. 2017;31(3):688-696
25. Kuhnl A, Gokbuget N, Kaiser M. et al. Overexpression of LEF1 predicts unfavorable outcome in adult patients with B-precursor acute lymphoblastic leukemia. Blood. 2011;118:6362-6367
26. Metzeler KH, Heilmeier B, Edmaier KE. et al. High expression of lymphoid enhancer-binding factor-1 (LEF1) is a novel favorable prognostic factor in cytogenetically normal acute myeloid leukemia. Blood. 2012;120:2118-2126
27. Yu J, Wu WK, Li X. et al. Novel recurrently mutated genes and a prognostic mutation signature in colorectal cancer. Gut. 2015;64:636-645
28. El-Haibi CP, Singh R, Sharma PK. et al. CXCL13 mediates prostate cancer cell proliferation through JNK signalling and invasion through ERK activation. Cell Prolif. 2011;44:311-319
Author contact
![]() Corresponding authors: Lin Fu, MD. PhD. Department of Hematology, Huaihe Hospital of Henan University, Kaifeng, 475000, China. Email: fulin022com, Tel: +86-0371-23906543, Fax: +86-0371-23906543. Zhiheng Cheng. Department of Pathology and Medical Biology, University Medical Center Groningen, University of Groningen, Groningen, Netherlands. Email: chengzh217com. Xinyou Zhang, MD. Department of Hematology, The Second Clinical Medical College (Shenzhen People's Hospital), Jinan University, Shenzhen, 518020, China. Email: zhangxinyou0518com. These senior corresponding authors contributed equally to this work.
Corresponding authors: Lin Fu, MD. PhD. Department of Hematology, Huaihe Hospital of Henan University, Kaifeng, 475000, China. Email: fulin022com, Tel: +86-0371-23906543, Fax: +86-0371-23906543. Zhiheng Cheng. Department of Pathology and Medical Biology, University Medical Center Groningen, University of Groningen, Groningen, Netherlands. Email: chengzh217com. Xinyou Zhang, MD. Department of Hematology, The Second Clinical Medical College (Shenzhen People's Hospital), Jinan University, Shenzhen, 518020, China. Email: zhangxinyou0518com. These senior corresponding authors contributed equally to this work.
Citation styles
APA
Hu, N., Pang, Y., Zhao, H., Si, C., Ding, H., Chen, L., Wang, C., Qin, T., Li, Q., Han, Y., Dai, Y., Zhang, Y., Shi, J., Wu, D., Zhang, X., Cheng, Z., Fu, L. (2019). High expression of DOCK2 indicates good prognosis in acute myeloid leukemia. Journal of Cancer, 10(24), 6088-6094. https://doi.org/10.7150/jca.33244.
ACS
Hu, N.; Pang, Y.; Zhao, H.; Si, C.; Ding, H.; Chen, L.; Wang, C.; Qin, T.; Li, Q.; Han, Y.; Dai, Y.; Zhang, Y.; Shi, J.; Wu, D.; Zhang, X.; Cheng, Z.; Fu, L. High expression of DOCK2 indicates good prognosis in acute myeloid leukemia. J. Cancer 2019, 10 (24), 6088-6094. DOI: 10.7150/jca.33244.
NLM
Hu N, Pang Y, Zhao H, Si C, Ding H, Chen L, Wang C, Qin T, Li Q, Han Y, Dai Y, Zhang Y, Shi J, Wu D, Zhang X, Cheng Z, Fu L. High expression of DOCK2 indicates good prognosis in acute myeloid leukemia. J Cancer 2019; 10(24):6088-6094. doi:10.7150/jca.33244. https://www.jcancer.org/v10p6088.htm
CSE
Hu N, Pang Y, Zhao H, Si C, Ding H, Chen L, Wang C, Qin T, Li Q, Han Y, Dai Y, Zhang Y, Shi J, Wu D, Zhang X, Cheng Z, Fu L. 2019. High expression of DOCK2 indicates good prognosis in acute myeloid leukemia. J Cancer. 10(24):6088-6094.
This is an open access article distributed under the terms of the Creative Commons Attribution License (https://creativecommons.org/licenses/by/4.0/). See http://ivyspring.com/terms for full terms and conditions.