Journal of Cancer
ISSN: 1837-9664
3.2
Impact Factor
ISSN: 1837-9664

 Global reach, higher impact
J Cancer 2019; 10(17):4142-4150. doi:10.7150/jca.30493 This issue Cite
Research Paper
HBV Integration-mediated Cell Apoptosis in HepG2.2.15
Xiaoge Hu1,2,#, Jiahong Jiang1,#, Chao Ni1,3,#, Qiuran Xu1,2, Song Ye4, Junjie Wu1,2, Feimin Ge5, Yong Han1,2, Yinyuan Mo6, Dongsheng Huang1,2,3 ![]() , Liu Yang1,2,
, Liu Yang1,2, ![]()
1. Key Laboratory of Tumor Molecular Diagnosis and Individualized Medicine of Zhejiang Province, Zhejiang Provincial People's Hospital, People's Hospital of Hangzhou Medical College, Hangzhou, Zhejiang 310014, P. R. China.
2. Key Laboratory of Gastroenterology of Zhejiang Province, Zhejiang Provincial People's Hospital, People's Hospital of Hangzhou Medical College, Hangzhou, Zhejiang 310014, P. R. China.
3. Department of General surgery, Zhejiang Provincial People's Hospital, People's Hospital of Hangzhou Medical College, Hangzhou, Zhejiang 310014, P. R. China.
4. Division of Hepatobiliary and Pancreatic Surgery, Department of Surgery, The Secondary Affiliated Hospital, School of Medicine, Zhejiang University, Hangzhou, Zhejiang 310003, P. R. China.
5. Department of Pharmacy, Zhejiang Provincial People's Hospital, People's Hospital of Hangzhou Medical College, Hangzhou, Zhejiang 310014, P. R. China.
6. Department of Pharmacology/Toxicology and Cancer Institute, University of Mississippi Medical Center, 2500 North State Street, Jackson, MS 39216, USA.
#These authors contributed equally to this work.
Received 2018-10-8; Accepted 2019-5-1; Published 2019-7-10
Citation:
Hu X, Jiang J, Ni C, Xu Q, Ye S, Wu J, Ge F, Han Y, Mo Y, Huang D, Yang L. HBV Integration-mediated Cell Apoptosis in HepG2.2.15. J Cancer 2019; 10(17):4142-4150. doi:10.7150/jca.30493. https://www.jcancer.org/v10p4142.htm
Other stylesAbstract
Hepatocellular carcinoma (HCC) is the most common type of primary liver cancer and the second leading cause of cancer deaths in the word. Hepatitis B virus (HBV) infection plays an important role in the development of HCC. However, the mechanisms by which HBV integration affects host cells remain poorly understood. HepG2.2.15 cell line is derived from HCC cell line HepG2 with stable transfection HBV expression. In this study, HepG2.2.15 cells showed decreased proliferation, G1 cell cycle arrest and increased apoptosis, when compared to HepG2 cells. HBV capture sequencing was conducted in both genome and transcriptome level, followed by RNA expression sequencing in HepG2.2.15. Here, CAMSAP2/CCDC12/DPP7/OR4F3 were found to be targets for HBV integration in both genome and transcriptome level, accompanied by alteration in their expression when compared to HepG2. Among these genes, DPP7 was the only one gene with HBV integration into its exon, meanwhile DPP7 expression level was also downregulated in HepG2.2.15 as compared to HepG2. Furthermore, DPP7 knockdown resulted in increased apoptosis through upregulation of the Bax/Bcl2 ratio in HepG2 cells. Our results suggest that HBV integration of DPP7 was involved in cell apoptosis.
Keywords: HepG2.2.15, viral integration, Hepatitis B virus, proliferation, cell cycle, apoptosis
Introduction
The most prevalent primary liver cancer is known to be Hepatocellular carcinoma (HCC). It is considered to be the second highest cause of deaths associated with cancer globally [1, 2]. Chronic infections with the hepatitis B virus (HBV) or hepatitis C virus (HCV) are the primary risk factors for HCC [3]. In China, HBV plays a more prominent role because it may lead to liver fibrosis and cirrhosis, which eventually results in HCC [3-6]. Around 50% of HCC patients are associated with HBV infections [7]. Carriers of the hepatitis B surface antigen (HBsAg) are at 25-37-fold higher risk of developing HCC as compared to those not expressing the antigen [8, 9].
HBV contains eight known genotypes (A to H) [10]. Its genome contains four genes, C, P, S and X, that encode the core protein (HBcAg), DNA polymerase, surface antigen (HBsAg) and protein X (HBx), respectively. Numerous studies have been done to establish the mechanisms of HBV-associated hepatocarcinogenesis [11-14]. HBV genome integration, host gene deregulation and many viral factors have already been implied to contribute to HBV-associated HCC. HBx, for example, contributes to intracellular signal transduction, cell cycle and apoptosis regulation, and has been suggested to be an effector of hepatocarcinogenesis [11]. Almost 90% of HBx transgenic mice develop HCC [15]. HBV Integration leads to the dysfunction of host genes and affects cell proliferation, cell cycle progression, apoptosis, and even chromosomal stability [12, 16-20]. Recurrent integrations in TERT and MLL4, for example, are frequently observed in HCC [21-29]. HBx-LINE integration, which functions as a long non-coding RNA, has been shown to promote tumorigenesis of HCC [12]. With the help of next generation sequencing, it has been found that genome-wide HBV integration is commonly reported in HCC [25, 30].
HepG2.2.15 cells are derived from HepG2 with HBV expression stablely[31]. Little work has been done in the context of HepG2.2.15 cells with regards to the effects of HBV on cellular function, and HBV integration detection of HepG2.2.15 cells has not been carried out. In this study, we conducted HBV capture sequencing in HepG2.2.15 cells at both the whole genome and transcriptome levels, followed by RNA sequencing. Our results reveal that several genes are targets for HBV integration, leading to altered expression patterns of these genes. Integration in the dipeptidyl peptidase 7 (DPP7) gene causes decreased expression of DPP7 in HepG2.2.15 cells. Furthermore, DPP7 knockdown results in increased apoptosis with upregulation of the Bax/Bcl2 ratio. Our results suggest that HBV integration of DPP7 was involved in cell apoptosis.
Materials and Methods
Cell culture and transfection
HepG2 was cultured with DMEM (HyClone, SH30022.01B) with 10 % FBS (Biological Industries) and incubated at 37℃ with 5% CO2. HepG2.2.15 was cultured with DMEM (HyClone) with 10 % FBS and 200ug/ml G418 (SIGMA). SiRNA transfection was done with Lipofection 3000 reagent according to the manufacturer's protocol. DPP7 siRNA sequence 5'-3': siRNA#1 (CCGAGCACUGCUACGACAUTT), siRNA#2 (GCAACAAUGUGACCGAUAUTT), siRNA#3 (CCUGAGUGCCUCAGUCAUCTT).
Antibody reagents
Protein expression was analyzed by western blot. Rb, pRb780, pRb795, pRb807/811, cyclinD, cyclinE, CDK2, p21, p27, p53, Bcl2, Bax antibody were obtained from Cell Signaling Technology (CST). DPP7 antibody was bought from Santa Cruz Biotechnology. GAPDH antibody was bought from Beyotime.
DNA and RNA isolation
With the use of Genomic DNA Mini Kit (Invitrogen, Life Technologies) and Trizol reagent (Takara), extraction of Genomic DNA and Total RNA from cells were carried out, respectively. Then, quantification of DNA and RNA was carried out with the use of NanoDrop 2000.
HBV capture experiment at genomic DNA level
Firstly, HBV capture probe were designed based on full-length HBV genome of eight types (A to H). The sequencing library construction was conducted as per Illumina protocol. Genomic DNA was sheared to 150-200 bp DNA fragments by Covaris E-210. They were purified, end blunted, “A” tailed, and finally ligated to adaptors. 12 cycle PCR was carried out to amplify the ligation products to build the genomic DNA library. Library quantification was analyzed by Qubit dsDNA HS Assay Kit (Invitrogen). Next, libraries hybridization with HBV probe was carried out at 65℃ for 24 hours. Uncaptured fragments were then removed by washing., The eluted fragments underwent amplification by 16 cycles of PCR to generate sequencing library followed by paired-end index sequencing in the illumina HiSeq 2000 sequencer.
HBV capture experiment at RNA level
Firstly, HBV capture probe were designed based on full-length HBV genome of eight types (A to H). As per Illumina paired-end sequencing protocols, 1 μg of total RNA was used to construct library. With ProtoScript® II Reverse Transcriptase (NEB), First-strand cDNA was synthesized. This was followed by second-strand cDNA synthesis with the help of Second Strand Synthesis Enzyme Mix (NEB) and purified using DNA Clean & Concentrator kit (Zymo Research). The double-strand cDNA products were sheared to 150-200 bp DNA fragments by Covaris E-210. These sheared fragments underwent purification, end blunting, “A” tailing, and finally ligation to adaptors. 12 cycles of PCR amplification were conducted for library construction. Libraries quantification was analyzed by Qubit dsDNA HS Assay Kit (Invitrogen). Then, library hybridization with HBV probe were conducted at 65℃ for 24 hours. Uncaptured fragments were removed by washing. Sequencing libraries were obtained by amplification of eluted fragments with 16 cycles of PCR, and were then subjected to paired-end index sequencing in the illumina HiSeq 2000 sequencer.
Viral-Human Fusion identification by VirusSeq
VirusSeq [32] was used to detect viral-human fusion. Briefly, sequencing raw data was firstly filtered, so that clean reads could be obtained for subsequent analysis. The clean PE reads were then mapped onto both the human genome (NCBI build 37, HG19) and HBV genome (HE815465.1) by Burrows-Wheeler Aligner (BWA). hg19Virus is a novel hybrid reference genome made by combining human genome (H19) and virus genome (Virus). All PE reads are mapped to hg19Virus. Only the PE reads that mapped to both human chromosome and Virus, is considered as a discordant read pair. After annotation with human and viral genes, fusion candidates were reported for further analysis as previously reported [32]. The coverage, depth and coverage rate onto HBV genome were measured according to reported reads.
PCR and Sanger sequencing validation
For verification of the HBV integration breakpoints from VirusSeq analysis, Sanger sequencing was conducted. Using the paired-end assembled fragment as a basis, the PCR primers (Table S1) were designed, that one of the primers was located in HBV genome and the other in human genome. PCR was then carried out followed by sequencing.
Detection of HBV gene copy number
HBV gene copy number was detected using Diagnostic Kit for Quantification of Hepatitis B Virus DNA based on manufacturer's protocol. Finally, PCR reactions of the prepared samples were performed with Stepone Real-Time PCR System.
Cell proliferation analysis
We used Cell Counting Kit-8 (CCK-8, Biotool) for analysis of cell proliferation based on manufacturer's instruction. Cells were seeded in 96-well plates at a density of 3.5×10³ cells per well and cultured in DMEM with 10% serum. 24h/48h/72h later, the old medium was removed, and then 1/10 volume of CCK-8 was then added into 100ul fresh medium. After incubation at 37℃ for 4h, absorbance was measured at 450 nm.
Cell cycle analysis
We used Cell Cycle and Apoptosis Analysis Kit (Beyotime) to analyze cell cycle based on manufacturer's protocol. Cells (1×10⁶) with different treatments were harvested followed by washing with cold 1 × PBS. Cells were then fixed in 1 ml 70 % cold ethanol at 4 ℃ for one night. Cells were washed three times with cold 1 × PBS, and then resuspended in 500 ul staining buffer (200 mg/ml RNase A and 50 μg/ml PI) and stained in the dark at 37 ℃ for 30min. Finally, Flow Cytometer (ACEA NovoCyteTM) was used for cell cycle detection.
Cell apoptosis analysis
We used Annexin V-FITC/PI apoptosis kit (Multi Science) to analyze cell apoptosis based on manufacturer's protocol. Cells (5 × 10⁵) with different treatments were harvested followed by washing with cold 1 × PBS. The cell were resuspended in 500ul 1 × Binding Buffer, and 5 μl Annexin V-FITC and 10 μl PI were then added to the cell mixture followed by incubation in the dark at 37 ℃ for 5 minutes. Finally, apoptosis was detected by Flow Cytometer (ACEA NovoCyteTM).
RNA extraction, reverse transcription and qPCR
We used Trizol (Takara) to extract RNA from cells. cDNA synthesis was conducted by PrimeScriptTM RT Master Mix kit (Takara). PCR reaction was then done with SYBR Premix Ex TaqTM, (Tli RNaseH Plus) kit (Takara). The primers used in this paper were shown in Table S2. GAPDH was used as a control gene.
Statistics
Data were presented as mean ± SEM based on three independent experiments. Unpaired student's t test analysis was performed in quantification of RT-PCR results. p values that were less than 0.05 were considered to be statistically significant.
Results
Detection of HBV in HepG2.2.15 cells
HBV DNA was detected in HepG2.2.15 cells by a fluorescent labeled PCR probe. HepG2 cell was served as a negative control. As shown in Figure 1A, the HBV DNA copy number in HepG2.2.15 cells showed a 25,763-fold increase in comparison with HepG2, confirming that HepG2.2.15 cells are positive for HBV DNA.
Identification of genome HBV integration sites
To explore the integration of the HBV genome in HCC, we conducted HBV capture sequencing in HepG2.2.15 cells using the Illumina HiSeq 2000 sequencing system. Identification of the integrated HBV genome was subsequently performed using VirusSeq [32] (Figure 2).
We obtained 2,374,482 raw reads that had with a 141 bp average read length from HepG2.2.15 genomic DNA samples, of which 192,901 reads were matched to the HBV genome (HBV-D-3) (Table 1). An average depth of 6417.52 and 100% coverage was achieved with 20-fold read mapped to the HBV genome (Table 1). 14 HBV integration breakpoints were identified (Table 1), and the genome HBV integration breakpoints in HepG2.2.15 were distributed in HBV genome (Figure 1B).
As shown in Table 2, 14 HBV integration breakpoints are mainly located within the region where the X protein, S protein and core protein are located [33]. The HBx protein is the most frequently integrated protein. HBV is preferentially integrated into chromosome 1 (4/14), chromosome 2 (3/14), chromosome 3 (2/14), chromosome 7 (1/14), chromosome 9 (1/14), chromosome 20 (1/14), chromosome 21 (1/14) and chromosome X (1/14) (Table 2). The majority of HBV integrations are intronic and intergenic, while the DPP7 integration sites are exonic (Table 2).
Identification of transcriptome HBV integration sites
To further explore HBV integration at the level of the transcriptome, total RNA of HepG2.2.15 cells was obtained, reversed transcribed to cDNA and subjected to HBV capture sequencing (Figure 2).
Figure 1
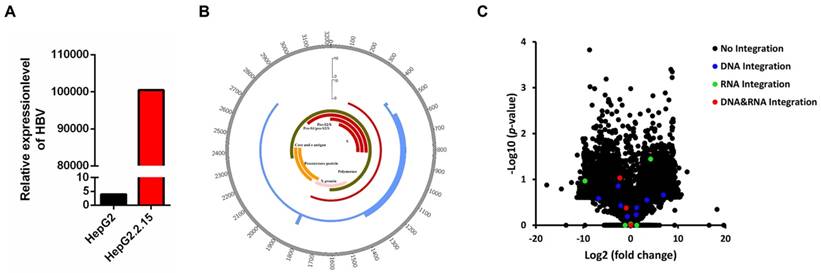
HBV integration breakpoints distribution in HBV genome and gene expression change in HepG2.2.15. (A) Detection of HBV gene copy number by PCR. (B) Distribution of integration breakpoints in the HBV genome in HepG2.2.15 (genome integration breakpoints of HepG2.2.15: blue, transcriptome integration breakpoints of HepG2.2.15: red) are shown. Histograms were constructed for 100bp intervals. HBV genes with different functions are shown. (C) Volcano plot of differently expressed genes between HepG2.2.15 and HepG2. The logarithms of the fold changes of genes (x-axis) are plotted against the negative logarithm of their p-value(y-axis). Black dots represent genes without HBV integration (No integration), blue dots represent genes with HBV integration in genome (DNA integration), green dots represent genes with HBV integration in transcriptome (RNA integration), red dots represent genes with HBV integration in both genome and transcriptome (DNA&RNA integration).
Table 1
HBV capture sequencing data
| Sample | Reads number | Raw bases (Mb) | Clean bases (Mb) | Average read length | No. of the reads mapped to HBV | Target 20X rate (%) | Target mean depth | Coverage rate (%) | No. of integration breakpoints |
|---|---|---|---|---|---|---|---|---|---|
| Genomic DNA | 2374482 | 358.55 | 316.91 | 141 | 192901 | 100 | 8157.27 | 100 | 14 |
| Total RNA | 94192016 | 14222.99 | 12390.66 | 138 | 561510 | 100 | 22604.45 | 100 | 9 |
Table 2
HBV genomic integration breakpoints and gene expression fold change
| Human location | Nearest genes | Location type | HBV location | HBV transcript | Supporting reads number | Nearest gene fold change (log2) |
|---|---|---|---|---|---|---|
| chr1:155104681 | EFNA1 | intronic | 460 | S protein | 14 | -0.693 |
| chr1:200809469 | CAMSAP2 | intronic | 1746 | X protein | 8 | -0.923 |
| chr3:47015291 | CCDC12 | intronic | 1820 | X protein | 71 | 0.023 |
| chr9:140008668 | DPP7 | extronic | 1716 | X protein | 114 | -2.261 |
| chr2:27241835 | MAPRE3 | intronic | 1829 | X protein | 11 | -2.092 |
| chr1:200809321 | CAMSAP2 | intronic | 1746 | precore/core protein | 10 | -0.923 |
| chr1:569999 | OR4F3 | intergenic | 1801 | precore/core protein | 13 | - |
| chr7:25573057 | NPVF | intergenic | 1594 | X protein | 103 | 0 |
| chr3:42696821 | ZBTB47 | intronic | 1829 | X protein | 112 | -2.59583 |
| chrX:9148656 | FAM9B | intergenic | 2082 | precore/core protein | 55 | -6.74895 |
| chr20:62935214 | LINC00266-1 | intergenic | 2639 | polymerase protein | 38 | 3.4362 |
| chr2:27775260 | GCKR | intergenic | 2775 | polymerase protein | 22 | 6.90382 |
| chr21:10007085 | TEKT4P2 | intergenic | 607 | S protein | 45 | 1.28415 |
| chr2:27915039 | SLC4A1AP | intronic | 2567 | polymerase protein | 22 | 1.17871 |
Chr: chromosome; -: no signal test.
Figure 2
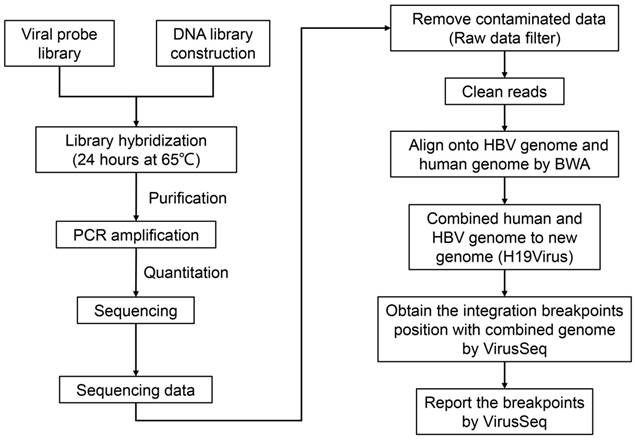
The pipeline of workflow. Experimental workflow and bioinformatic analysis is performed in this study. BWA: Burrows-Wheeler Aligner.
Table 3
HBV RNA integration breakpoints and gene expression fold change
| Human location | Nearest gene | Location type | HBV location | HBV transcript | Supporting reads number | Nearest gene log2(fold change) |
|---|---|---|---|---|---|---|
| chr11:85195011 | DLG2 | intronic | 407834 | S protein | 9 | 1.283 |
| chr5:71146794 | MAP1B | intergenic | 408128 | S protein | 8 | 4.212 |
| chr17:33478111 | UNC45B | intronic | 407658 | S protein | 6 | -1.162 |
| chr1:200809476 | CAMSAP2 | intronic | 409112 | X protein | 12 | -0.923 |
| chr3:47015261 | CCDC12 | intronic | 409144 | X protein | 41 | 0.023 |
| chr9:140008690 | DPP7 | exonic | 409079 | X protein | 359 | -2.261 |
| chr7:25572926 | MIR148A | intergenic | 408983 | X protein | 16 | 0.003 |
| chr1:570051 | OR4F3 | intergenic | 409270 | X protein | 8 | - |
| chr12:20704358 | PDE3A | intronic | 408967 | X protein | 7 | -9.627 |
Chr: chromosome; -: no signal test.
We obtained 94,192,016 raw reads with an average read length of 138 base pairs. A total of 561,510 reads were matched to the HBV genome (HBV-D-3) (Table 1). We obtained 100% coverage of the targeted region with 20-fold read mapped to the HBV genome (Table 1). Nine HBV integration breakpoints were identified (Table 1), and the transcriptome HBV integration breakpoints in HepG2.2.15 were distributed in HBV genome (Figure 1B).
As shown in Table 3, all nine HBV integration breakpoints are distributed in the region where the X protein and S protein are located within the HBV genome [33] (Table 3). Three integration breakpoints are within the S protein and six are within the X protein. The HBV integration sites are located within chr1, chr3, chr5, chr7, chr9, chr11, chr12, chr17 (Table 3). Most of the integrations are intronic and intergenic, while the HBV integration of DPP7 is exonic (Table 3).
Expression of target genes with HBV integration
To explore whether HBV integration affects the expression of host genes, we conducted RNA-Seq in HepG2 and HepG2.2.15 cells. Statistical analysis of RNA-Seq data is shown in Table 4. Expression change of genes were shown in Figure 1C, including the genes without or with HBV integration in genome level, transcriptome level and both genome and transcriptome level. Combining the RNA-Seq and HBV integration results, four genes (CAMSAP2/CCDC12/DPP7/OR4F3) are identified with HBV integration in both the genome and transcriptome of HepG2.2.15 cells (Table 5). Expression of DPP7, which shows integration of the X protein transcript, decreases 4.8-fold as compared to expression in HepG2 cells. Changes in expression levels of CAMSAP2/CCDC12/OR4F3, which show intronic or intergenic HBV integration, are lower (Table 5). To confirm HBV integration into the genes, PCR amplification followed by Sanger sequencing was carried out. Integration of HBV into the four genes (CAMSAP2/CCDC12/DPP7/OR4F3) was confirmed by Sanger sequencing (Figure S1), validating the results from HBV capture sequencing.
HBV integration decreases cell proliferation, and induces G1 arrest and apoptosis
Since HepG2.2.15 cells originate from HepG2 with HBV expression stablely, we first examined whether the cell phenotype is stable. The cell proliferation assay shows a significant reduction of HepG2.2.15 cells growth rate as compared to HepG2 cells (Figure 3A). Cell cycle analysis was conducted to determine whether cell cycle distribution was changed. As compared to HepG2 cells, there was an obvious increase in the proportion of G1 phase and a decrease in the S and G2 phases in HepG2.2.15 cells (Figure 3B, C). The decreased cell proliferation and G1 cell cycle arrest are consistent with previous reports [34]. Cell apoptosis detection was also carried out by flow cytometry, and the rate of apoptosis in HepG2.2.15 cells is increased in comparison with HepG2 (Figure 3D, E).
Table 4
Statistics information of RNA-seq data
| Sample | Reads number | Raw bases (Mb) | Clean bases (Mb) | Average read length | Average insert size | Mapped reads | Coverage rate(%) | Target mean depth |
|---|---|---|---|---|---|---|---|---|
| HepG2 | 193531404 | 29223.24 | 25439.31 | 130 | 948.7 | 96922102 | 62.76 | 59.55 |
| HepG2.2.15 | 145773306 | 22011.77 | 19359.6 | 126 | 989.9 | 98707630 | 61.12 | 65.79 |
Table 5
HBV integration genes in both genome and transcriptome
| Gene | Chr | HBV transcript | Integration type | fold change (log2) |
|---|---|---|---|---|
| CAMSAP2 | chr1 | X protein/core protein | intronic | -0.923 |
| CCDC12 | chr3 | X protein | intronic | 0.023 |
| DPP7 | chr9 | X protein | exonic | -2.261 |
| OR4F3 | chr1 | X protein/core protein | intergenic | - |
Chr: chromosome; -: no signal test.
Figure 3
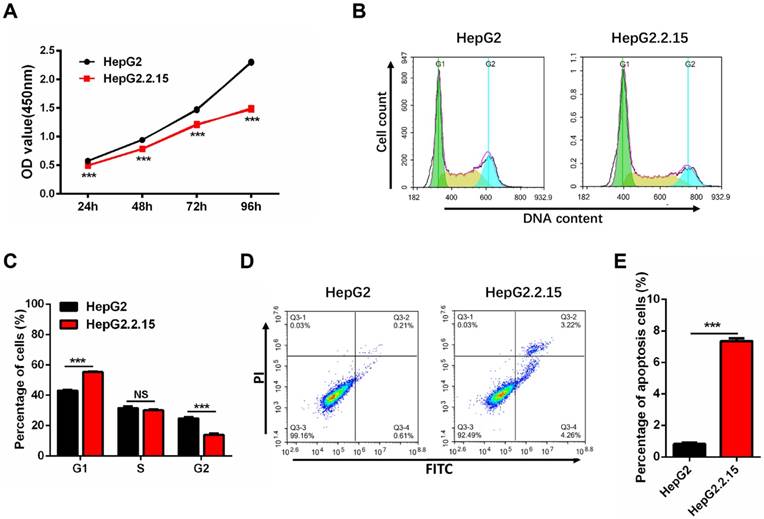
HepG2.2.15 cells show decreased proliferation, G1 cell cycle arrest and increased apoptosis. (A) Proliferation of HepG2 and HepG2.2.15 cells. OD450 values were measured at 24 h, 48 h, 72 h and 96h. Data shown represents the mean ± SEM values from three independent experiments (***p < 0.001). (B) Cell cycle analysis of HepG2 and HepG2.2.15 cells. (C) Quantitative cell cycle distribution of HepG2 and HepG2.2.15 cells. HepG2.2.15 cells show G1 cell cycle arrest when compared to HepG2 cells. Data shown represents the mean ± SEM values from three independent experiments (***p < 0.001, NS: none significant). (D) Analysis of cell apoptosis by flow cytometry. Increased apoptosis is observed in HepG2.2.15 cells. (E) Quantitative results of cells undergoing apoptosis in HepG2 and HepG2.2.15 populations. Data shown represents the mean ± SEM values from three independent experiments (***p < 0.001).
Figure 4
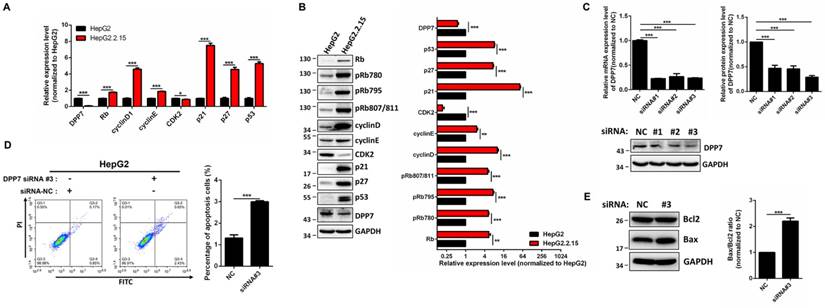
DPP7 knockdown induces cell apoptosis in HepG2 cells (A) RT-PCR analysis of cell cycle regulated genes in HepG2 and HepG2.2.15 cells. GAPDH was used as a reference gene. Data shown represents the mean ± SEM values from three independent experiments (*p < 0.05, ***p < 0.001). (B) Western blot analysis of cell cycle regulated genes. Quantification results were shown in the right. GAPDH was used as a reference gene. Data shown represents the mean ± SEM values from three independent experiments (**p<0.01, ***p < 0.001). (C) Verification of DPP7 siRNA knockdown efficiency by RT-PCR and western blot. Quantification results were shown in the upper. Data shown represents the mean ± SEM values from three independent experiments (***p < 0.001). (D) Knockdown of DPP7 induces increased cell apoptosis in HepG2 cells. Data shown represents the mean ± SEM values from three independent experiments (***p < 0.001). (E) Knockdown of DPP7 in HepG2 cells leads to increased Bax/Bcl2 ratio as measured by western blot. Quantification results were shown in the right. GAPDH served as a loading control. Data shown represents the mean ± SEM values from three independent experiments (***p < 0.001).
To identify the mechanism of G1 cell cycle arrest, expression of cell cycle-regulated genes were detected. The results obtained from RT-PCR showed that mRNA expression of Rb, cyclin D1, cyclin E1, p21, p27, and p53 is increased in HepG2.2.15 cells, while expression of CDK2 is decreased (Figure 4A) in comparison with HepG2 cells. In addition, the protein expression of Rb, cyclin D1, cyclin E1, p21, p27, p53 is upregulated, while there was a downregulation of CDK2 expression in HepG2.2.15 cells (Figure 4B).
DPP7 knockdown results in cell apoptosis
In order to determine whether the phenotype of HepG2.2.15 cells is linked with HBV integration, we studied DPP7, since it is the only gene with HBV integration at both the genome and transcriptome levels, and decreased expression levels. The mRNA expression of DPP7 is 10-fold decrease in HepG2.2.15 in comparison with HepG2 (Figure 4A).
DPP7, also referred to as quiescent cell proline dipeptidase (QPP, DPP2, DPPII), is a post-proline cleaving aminopeptidase [35, 36]. It has been previously reported that DPP7 inhibition in quiescent lymphocytes results in cell apoptosis [37]. We reasoned that the HBV integration-mediated decreases in DPP7 expression may be associated with cell apoptosis in HepG2.2.15 cells. Therefore, we used DPP7 siRNAs for knockdown of DPP7 (Figure 4C). In HepG2 cells, DPP7 knockdown induced more cell apoptosis than the siRNA control (Figure 4D). Apoptosis-related proteins such as Bcl2 and Bax play an vital role in cell apoptosis. We then analyzed the expression of apoptosis-related proteins to explore the cellular mechanism of the higher apoptosis of HepG2.2.15 cells. Western blot results show that DPP7 knockdown results in an upregulation of Bax, without affecting Bcl2 (Figure 4E). This leads to an increase in Bax/Bcl2 ratio, which may contribute to the increased levels of apoptosis.
Discussion
Currently, HCC is the second leading cause of cancer-associated deaths globally. In China, HBV has a vital contribution to HCC development. The HepG2.2.15 originates from HepG2 by stable transfection with HBV genome [31]. In comparison with HepG2, HepG2.2.15 shows decreased proliferation, G1 cell cycle arrest and increased rate of apoptosis. In our study, HBV capture sequencing was conducted at both the genome and transcriptome levels to discover HBV integration sites in the HepG2.2.15 genome. RNA-Seq was subsequently performed to analyze gene expression. Based on the HBV capture sequencing and RNA-Seq results, a number of genes show HBV integration accompanied by altered expression. In particular, integration of HBV into DPP7 is observed both at the genome and transcriptome levels, and expression of this gene is reduced in HepG2.2.15 cells when compared to HepG2 cells. Furthermore, DPP7 knockdown leads to apoptosis with upregulation of the Bax/Bcl2 ratio in HepG2 cells, which suggest that HBV integration-induced decreases in DPP7 expression can increase apoptosis in HepG2.2.15 cells, indicating that HBV can regulate cell function through integrating into host genes.
Previous studies have revealed a large number of genes with HBV integration in human HCC tissue [30]. Although a large amount of data has been obtained in studies of clinical samples, few studies have performed functional analysis. The mechanism by which HBV integration induces HCC remains to be elucidated. One of the challenges in identifying these mechanisms is that HBV was randomly integrated into the genome, which makes choosing a cell line model with specific HBV integration difficult. HBx-LINE1, an HBV-human chimeria contribute to HCC through acting as a LncRNA [12]. In the aforementioned study, six HCC cell lines were obtained from patients who were infected with HBV, which paves the way for further functional studies [12]. Here, we chose HepG2.2.15 cells as our HBV integration cell model, to explore the relationship between HBV integration and cell function and phenotype.
In a previous study, whole-genome gene expression were profiled in both HepG2 and HepG2.2.15 cells. It showed that 2978 genes are up- or down-regulated, including genes related to cell cycle, transport, signal transduction, cell adhesion and cellular metabolism [38]. Two-dimensional gel electrophoresis-mass spectrometry indicated that HBV infection can affect protein expression [39, 40]. HepG2.2.15 cells also show reduction in proliferation and G1 cell cycle arrest with alterations in cell cycle-regulated genes [34, 41, 42]. However, the association between HBV integration and cell functional and phenotypic changes has not been elucidated. In our study, HepG2.2.15 cells showed reduction in proliferation, G1 cell cycle arrest and increased apoptosis when compared to HepG2 cells. HBV capture sequencing and RNA-Seq revealed that HBV integration occurs in DPP7 accompanied by decreased expression levels of the gene. DPP7, a post-proline cleaving aminopeptidase, has been shown to play role in apoptosis of lymphocytes [37]. Consistent with this finding, we show that DPP7 knockdown leads to increased apoptosis with upregulation of the Bax/Bcl2 ratio in HepG2 cells. Together, our data suggests that HBV integration affects the expression of host genes such as DPP7, leading to increased apoptosis in HepG2.2.15 cells.
Although our results reveal alterations of several important genes, it has some limitations. For example, many genes have been identified with HBV integration in HCC tissue, whereas fewer genes were detected here, which may be attributed to the cell model we choose. Since HepG2.2.15 cells originate from HepG2 with HBV expression stablely, they do not exactly mimic the HBV infection process under physiological conditions. In this regard, HepG2.2.15 may not be the best cell line model for HBV integration analysis. Nevertheless, this cell line provides a tool to study HBV integrations and the effects on expression of host genes. Our results suggest that HBV infection decreases host cell activities, such as decreased cell proliferation, and increased cell apoptosis, which are contrary to the predominant hypothesis that HBV infection contributes to hepatocarcinogenesis [4-6]. HBV contains eight genotypes (A-H) with different geographic distribution. Increasing evidence has suggested that not all HBV genotypes are linked with HCC [43, 44]. The HBV genotype of HepG2.2.15 cells is genotype D, [31] and the clinical impact of genotype D is still controversial. For example, some clinical and epidemiological data suggests that genotype D does not affect the severity and chronicity of the disease [45], while other studies report that genotype D is related to chronic and occult HBV infections [46]. In these previous studies, a large amount of data was obtained from clinical specimens and, therefore, more functional studies are needed to clarify these issues. It is possible that the decreased cell proliferation and cell activity induced by HBV integration in HepG2.2.15 is specific for HBV genotype D, as previously reported [34].
Supplementary Material
Supplementary figure and tables.
Acknowledgements
The present study was supported by the National Natural Science Foundation of China (no.81772575; 81502463), the Science Technology Department of Zhejiang Province (no. 2016C33116), the key project of Health Bureau of Zhejiang Province (no. 2018274734), the CSCO Merck Serono Oncology Research Fund, SCORE (no. Y-MX2015-038), the Key Research Project of Science Technology Department of Zhejiang Province (no. 2015C03030) and the National High Technology Research and Development Program of China (863 Program, no. 2012AA02A205).
Competing Interests
The authors have declared that no competing interest exists.
References
1. Forner A, Llovet JM, Bruix J. Hepatocellular carcinoma. Lancet. 2012;379:1245-55
2. Torre LA, Bray F, Siegel RL, Ferlay J, Lortet-Tieulent J, Jemal A. Global cancer statistics, 2012. CA Cancer J Clin. 2015;65:87-108
3. Ghouri YA, Mian I, Rowe JH. Review of hepatocellular carcinoma: Epidemiology, etiology, and carcinogenesis. J Carcinog. 2017;16:1
4. Iloeje UH, Yang HI, Su J, Jen CL, You SL, Chen CJ. et al. Predicting cirrhosis risk based on the level of circulating hepatitis B viral load. Gastroenterology. 2006;130:678-86
5. Montalto G, Cervello M, Giannitrapani L, Dantona F, Terranova A, Castagnetta LA. Epidemiology, risk factors, and natural history of hepatocellular carcinoma. Ann N Y Acad Sci. 2002;963:13-20
6. Chen CJ, Yang HI, Su J, Jen CL, You SL, Lu SN. et al. Risk of hepatocellular carcinoma across a biological gradient of serum hepatitis B virus DNA level. JAMA. 2006;295:65-73
7. Sherman M. Hepatocellular carcinoma: epidemiology, surveillance, and diagnosis. Semin Liver Dis. 2010;30:3-16
8. Hassan MM, Hwang LY, Hatten CJ, Swaim M, Li D, Abbruzzese JL. et al. Risk factors for hepatocellular carcinoma: synergism of alcohol with viral hepatitis and diabetes mellitus. Hepatology. 2002;36:1206-13
9. Sun CA, Wu DM, Lin CC, Lu SN, You SL, Wang LY. et al. Incidence and cofactors of hepatitis C virus-related hepatocellular carcinoma: a prospective study of 12,008 men in Taiwan. Am J Epidemiol. 2003;157:674-82
10. Kramvis A, Kew M, Francois G. Hepatitis B virus genotypes. Vaccine. 2005;23:2409-23
11. Koike K, Moriya K, Iino S, Yotsuyanagi H, Endo Y, Miyamura T. et al. High-level expression of hepatitis B virus HBx gene and hepatocarcinogenesis in transgenic mice. Hepatology. 1994;19:810-9
12. Lau CC, Sun T, Ching AK, He M, Li JW, Wong AM. et al. Viral-human chimeric transcript predisposes risk to liver cancer development and progression. Cancer Cell. 2014;25:335-49
13. Neuveut C, Wei Y, Buendia MA. Mechanisms of HBV-related hepatocarcinogenesis. J Hepatol. 2010;52:594-604
14. Chaturvedi VK, Singh A, Dubey SK, Hetta HF, John J, Singh MP. Molecular mechanistic insight of hepatitis B virus mediated hepatocellular carcinoma. Microb Pathog. 2019;128:184-94
15. Kim CM, Koike K, Saito I, Miyamura T, Jay G. HBx gene of hepatitis B virus induces liver cancer in transgenic mice. Nature. 1991;351:317-20
16. Chami M, Gozuacik D, Saigo K, Capiod T, Falson P, Lecoeur H. et al. Hepatitis B virus-related insertional mutagenesis implicates SERCA1 gene in the control of apoptosis. Oncogene. 2000;19:2877-86
17. Lee YH, Oh BK, Yoo JE, Yoon SM, Choi J, Kim KS. et al. Chromosomal instability, telomere shortening, and inactivation of p21(WAF1/CIP1) in dysplastic nodules of hepatitis B virus-associated multistep hepatocarcinogenesis. Mod Pathol. 2009;22:1121-31
18. Peng Z, Zhang Y, Gu W, Wang Z, Li D, Zhang F. et al. Integration of the hepatitis B virus X fragment in hepatocellular carcinoma and its effects on the expression of multiple molecules: a key to the cell cycle and apoptosis. Int J Oncol. 2005;26:467-73
19. Liang HW, Wang N, Wang Y, Wang F, Fu Z, Yan X. et al. Hepatitis B virus-human chimeric transcript HBx-LINE1 promotes hepatic injury via sequestering cellular microRNA-122. J Hepatol. 2016;64:278-91
20. Song X, Tan S, Wu Z, Xu L, Wang Z, Xu Y. et al. HBV suppresses ZHX2 expression to promote proliferation of HCC through miR-155 activation. Int J Cancer. 2018;143:3120-30
21. Saigo K, Yoshida K, Ikeda R, Sakamoto Y, Murakami Y, Urashima T. et al. Integration of hepatitis B virus DNA into the myeloid/lymphoid or mixed-lineage leukemia ( MLL4 ) gene and rearrangements of MLL4 in human hepatocellular carcinoma †. Human Mutation. 2008;29:703-8
22. Dong H, Zhang L, Qian Z, Zhu X, Zhu G, Chen Y. et al. Identification of HBV-MLL4 Integration and Its Molecular Basis in Chinese Hepatocellular Carcinoma. PLoS One. 2015;10:e0123175
23. Huang J, Deng Q, Wang Q, Li KY, Dai JH, Li N. et al. Exome sequencing of hepatitis B virus-associated hepatocellular carcinoma. Nat Genet. 2012;44:1117-21
24. Toh ST, Jin Y, Liu L, Wang J, Babrzadeh F, Gharizadeh B. et al. Deep sequencing of the hepatitis B virus in hepatocellular carcinoma patients reveals enriched integration events, structural alterations and sequence variations. Carcinogenesis. 2013;34:787-98
25. Sung WK, Zheng H, Li S, Chen R, Liu X, Li Y. et al. Genome-wide survey of recurrent HBV integration in hepatocellular carcinoma. Nat Genet. 2012;44:765-9
26. Paterlini-Brechot P, Saigo K, Murakami Y, Chami M, Gozuacik D, Mugnier C. et al. Hepatitis B virus-related insertional mutagenesis occurs frequently in human liver cancers and recurrently targets human telomerase gene. Oncogene. 2003;22:3911-6
27. Shiraishi Y, Fujimoto A, Furuta M, Tanaka H, Chiba K, Boroevich KA. et al. Integrated analysis of whole genome and transcriptome sequencing reveals diverse transcriptomic aberrations driven by somatic genomic changes in liver cancers. PLoS One. 2014;9:e114263
28. Fujimoto A, Totoki Y, Abe T, Boroevich KA, Hosoda F, Nguyen HH. et al. Whole-genome sequencing of liver cancers identifies etiological influences on mutation patterns and recurrent mutations in chromatin regulators. Nat Genet. 2012;44:760-4
29. Saigo K, Yoshida K, Ikeda R, Sakamoto Y, Murakami Y, Urashima T. et al. Integration of hepatitis B virus DNA into the myeloid/lymphoid or mixed-lineage leukemia (MLL4) gene and rearrangements of MLL4 in human hepatocellular carcinoma. Hum Mutat. 2008;29:703-8
30. Zhao LH, Liu X, Yan HX, Li WY, Zeng X, Yang Y. et al. Genomic and oncogenic preference of HBV integration in hepatocellular carcinoma. Nat Commun. 2016;7:12992
31. Sells MA, Chen ML, Acs G. Production of hepatitis B virus particles in Hep G2 cells transfected with cloned hepatitis B virus DNA. Proc Natl Acad Sci U S A. 1987;84:1005-9
32. Chen Y, Yao H, Thompson EJ, Tannir NM, Weinstein JN, Su X. VirusSeq: software to identify viruses and their integration sites using next-generation sequencing of human cancer tissue. Bioinformatics. 2013;29:266-7
33. Li X, Zhang J, Yang Z, Kang J, Jiang S, Zhang T. et al. The function of targeted host genes determines the oncogenicity of HBV integration in hepatocellular carcinoma. Journal of Hepatology. 2014;60:975-84
34. Wang T, Zhao R, Wu Y, Kong D, Zhang L, Wu D. et al. Hepatitis B virus induces G1 phase arrest by regulating cell cycle genes in HepG2.2.15 cells. Virol J. 2011;8:231
35. Leiting B, Pryor KD, Wu JK, Marsilio F, Patel RA, Craik CS. et al. Catalytic properties and inhibition of proline-specific dipeptidyl peptidases II, IV and VII. Biochem J. 2003;371:525-32
36. Underwood R, Chiravuri M, Lee H, Schmitz T, Kabcenell AK, Yardley K. et al. Sequence, purification, and cloning of an intracellular serine protease, quiescent cell proline dipeptidase. J Biol Chem. 1999;274:34053-8
37. Chiravuri M, Schmitz T, Yardley K, Underwood R, Dayal Y, Huber BT. A novel apoptotic pathway in quiescent lymphocytes identified by inhibition of a post-proline cleaving aminodipeptidase: a candidate target protease, quiescent cell proline dipeptidase. J Immunol. 1999;163:3092-9
38. Ding XR, Yang J, Sun DC, Lou SK, Wang SQ. Whole genome expression profiling of hepatitis B virus-transfected cell line reveals the potential targets of anti-HBV drugs. Pharmacogenomics J. 2008;8:61-70
39. Tong A, Wu L, Lin Q, Lau QC, Zhao X, Li J. et al. Proteomic analysis of cellular protein alterations using a hepatitis B virus-producing cellular model. Proteomics. 2008;8:2012-23
40. Wang J, Jiang D, Zhang H, Lv S, Rao H, Fei R. et al. Proteome responses to stable hepatitis B virus transfection and following interferon alpha treatment in human liver cell line HepG2. Proteomics. 2009;9:1672-82
41. Liu X, Liang J, Li G. Lipopolysaccharide promotes adhesion and invasion of hepatoma cell lines HepG2 and HepG2.2.15. Mol Biol Rep. 2010;37:2235-9
42. Livezey KW, Negorev D, Simon D. Hepatitis B virus-transfected Hep G2 cells demonstrate genetic alterations and de novo viral integration in cells replicating HBV. Mutat Res. 2000;452:163-78
43. Zumbika E, Ruan B, Xu CH, Ni Q, Hou W, Chen Z. et al. HBV genotype characterization and distribution in patients with HBV-related liver diseases in Zhejiang Province, P.R. China: possible association of co-infection with disease prevalence and severity. Hepatobiliary Pancreat Dis Int. 2005;4:535-43
44. Tonetto PA, Goncales NS, Fais VC, Vigani AG, Goncales ES, Feltrin A. et al. Hepatitis B virus: molecular genotypes and HBeAg serological status among HBV-infected patients in the southeast of Brazil. BMC Infect Dis. 2009;9:149
45. Madan K, Batra Y, Sreenivas V, Mizokami M, Tanaka Y, Chalamalasetty SB. et al. HBV genotypes in India: do they influence disease severity? Hepatol Res. 2009;39:157-63
46. Chandra PK, Biswas A, Datta S, Banerjee A, Panigrahi R, Chakrabarti S. et al. Subgenotypes of hepatitis B virus genotype D (D1, D2, D3 and D5) in India: differential pattern of mutations, liver injury and occult HBV infection. J Viral Hepat. 2009;16:749-56
Author contact
![]() Corresponding authors: Professor Liu Yang or Professor Dongsheng Huang, Key Laboratory of Tumor Molecular Diagnosis and Individualized Medicine of Zhejiang Province, Zhejiang Provincial People's Hospital, Shang Tang Road 158, Hangzhou, Zhejiang 310014, P.R. China. Liu Yang, Email: yangliuqq2003com; Dongsheng Huang, Email: dshuangedu.cn
Corresponding authors: Professor Liu Yang or Professor Dongsheng Huang, Key Laboratory of Tumor Molecular Diagnosis and Individualized Medicine of Zhejiang Province, Zhejiang Provincial People's Hospital, Shang Tang Road 158, Hangzhou, Zhejiang 310014, P.R. China. Liu Yang, Email: yangliuqq2003com; Dongsheng Huang, Email: dshuangedu.cn
Citation styles
APA
Hu, X., Jiang, J., Ni, C., Xu, Q., Ye, S., Wu, J., Ge, F., Han, Y., Mo, Y., Huang, D., Yang, L. (2019). HBV Integration-mediated Cell Apoptosis in HepG2.2.15. Journal of Cancer, 10(17), 4142-4150. https://doi.org/10.7150/jca.30493.
ACS
Hu, X.; Jiang, J.; Ni, C.; Xu, Q.; Ye, S.; Wu, J.; Ge, F.; Han, Y.; Mo, Y.; Huang, D.; Yang, L. HBV Integration-mediated Cell Apoptosis in HepG2.2.15. J. Cancer 2019, 10 (17), 4142-4150. DOI: 10.7150/jca.30493.
NLM
Hu X, Jiang J, Ni C, Xu Q, Ye S, Wu J, Ge F, Han Y, Mo Y, Huang D, Yang L. HBV Integration-mediated Cell Apoptosis in HepG2.2.15. J Cancer 2019; 10(17):4142-4150. doi:10.7150/jca.30493. https://www.jcancer.org/v10p4142.htm
CSE
Hu X, Jiang J, Ni C, Xu Q, Ye S, Wu J, Ge F, Han Y, Mo Y, Huang D, Yang L. 2019. HBV Integration-mediated Cell Apoptosis in HepG2.2.15. J Cancer. 10(17):4142-4150.
This is an open access article distributed under the terms of the Creative Commons Attribution License (https://creativecommons.org/licenses/by/4.0/). See http://ivyspring.com/terms for full terms and conditions.