Journal of Cancer
ISSN: 1837-9664
3.2
Impact Factor
ISSN: 1837-9664

 Global reach, higher impact
J Cancer 2019; 10(10):2220-2228. doi:10.7150/jca.28261 This issue Cite
Research Paper
Tropomyosin-1 Functions as a Tumor Suppressor with Respect to Cell Proliferation, Angiogenesis and Metastasis in Renal Cell Carcinoma
Jin Wang*, Chao Tang*, Chao Yang, Qi Zheng, Yuchuan Hou ![]()
Department of Urology, the First Hospital of Jilin University, 71 Xinmin Street, Changchun 130021, Jilin, China.
*These authors contributed equally to this work.
Received 2018-7-2; Accepted 2019-3-31; Published 2019-5-21
Citation:
Wang J, Tang C, Yang C, Zheng Q, Hou Y. Tropomyosin-1 Functions as a Tumor Suppressor with Respect to Cell Proliferation, Angiogenesis and Metastasis in Renal Cell Carcinoma. J Cancer 2019; 10(10):2220-2228. doi:10.7150/jca.28261. https://www.jcancer.org/v10p2220.htm
Other stylesAbstract
Background: Tropomyosin-1 (TPM1) has long been known to be an actin-binding cytoskeletal protein. Multiple recent studies have revealed that TPM1 is down-regulated in various malignant tumors, including renal cell carcinoma (RCC).
Methods: To further verify its role in RCC, transfection of a reconstructed plasmid was used to bi-directionally regulate TPM1 levels. A colony formation assay, tube formation assay and invasion assay were adopted to assess cell proliferation, angiogenesis and metastasis, respectively, in the 786-O and ACHN cell lines. The xenograft tumor sizes were measured, and the microvessel density (MVD) was quantified. Western blot and immunohistochemistry (IHC) were used to detect key proteins involved in these processes.
Results: The colony formation assay and xenograft tumor models illustrated that TPM1 up-regulation inhibited RCC cell proliferation. The tube formation assay and detection of vascular endothelial growth factor (VEGF) and cluster of differentiation 34 (CD34) in xenografts revealed that TPM1 up-regulation inhibited angiogenesis in RCC. The invasion assay and detection of the E-cadherin and matrix metalloproteinases 9 (MMP-9) levels in xenografts demonstrated that TPM1 up-regulation inhibited tumor metastasis in RCC. Opposing effects were absent in TPM1 down-regulation models.
Conclusions: TPM1 functions as a tumor suppressor with respect to cell proliferation, angiogenesis and metastasis in RCC, suggesting that it is a potential therapeutic target for advanced RCC.
Keywords: Renal cell carcinoma, Tropomyosin-1, Cell Proliferation, Angiogenesis, Metastasis
Introduction
Renal cell carcinoma (RCC) accounts for approximately 2% of all malignant tumors in adults, and clear cell renal cell carcinoma (ccRCC) is the predominant pathological subtype. In 2016, 62,700 new cases were diagnosed as kidney and renal pelvic cancer and 14,240 related deaths were reported in the US [1]. Chinese data show that there were 67,100 newly diagnosed kidney cancers and 24,100 related deaths in 2013 [2]. The overall 5-year survival rate for RCC has improved from 50% to 74% over the past three decades [1]. This improvement is primarily attributed to the growing proportion of early diagnosis of RCC, which is facilitated by the increasing use of medical imaging. While early detection has improved in this neoplasm, treatment of advanced or metastatic RCC remains limited. Since 2005, clinical treatment of RCC has transitioned from a nonspecific immune approach to targeted therapy against vascular endothelial growth factor (VEGF) and now to novel immunotherapy agents [3]. Currently, mainstream RCC targeted therapies include tyrosine kinase inhibitors (TKIs) and mammalian target of rapamycin (mTOR) inhibitors, which are based on the inactivation of the tumor suppressor von Hippel-Lindau (VHL) and regulation of the hypoxia-inducible transcription factor (HIF)-VEGF pathway in most ccRCC. Although these agents have improved progression free survival, development of resistance is nearly universal, even for the new checkpoint inhibitors [4]. Therefore, identification of novel therapeutic targets is necessary to combat the resistance observed in classic target therapies.
Tropomyosin-1 (TPM1) is a tropomyosin family member that is known to be an actin-binding cytoskeletal protein in various cells. Tropomyosins function within the troponin complex to regulate muscle contraction in a calcium-dependent manner in muscle cells, while they have increased functional complexity in non-muscle cells and primarily act as microfilaments to stabilize the cytoskeleton [5]. Mutations in tropomyosins are directly involved in cardiac and skeletal muscle diseases, while alterations in tropomyosin expression directly contribute to the growth and spread of cancer [6]. Prasad and colleagues first reported that TPM1 is down-regulated and functions as a tumor suppressor gene (TSG) in breast cancer [7]. Subsequently, similar phenomena were observed in additional cancers, such as glioma, cholangiocarcinoma, oral squamous cell carcinoma and so on [8-10]. miRNA-21 is a well-known oncogene that is over-expressed in many tumor tissues compared with matched normal tissues. Suppression of miRNA-21 inhibits tumor growth through up-regulation of its target gene TPM1 [11]. TPM1 over-expression has been reported to stabilize F-actin and increase the number of cell-cell junctions, reducing the migratory potential of endothelial cells [12].
Our previous study demonstrated that TPM1 is down-regulated in both RCC patient tumors and cell lines. In vitro assays demonstrated that TPM1 is associated with RCC cell apoptosis, invasion and migration [13]. More recently, we reported that TPM1 promotes apoptosis via the p53-mediated mitochondrial pathway in RCC [14]. However, many details concerning the correlation of TPM1 and RCC cell proliferation and angiogenesis have yet to be reported, and the role of TPM1 as a tumor suppressor in RCC is still not fully established. The present study aimed to further investigate the correlations between TPM1 regulation and cell proliferation, angiogenesis, and metastasis in RCC. We assessed its tumor suppressive effects using bi-directional regulation of TPM1 both in vitro and in vivo using two RCC cell lines.
Materials and methods
Cell culture and antibodies
The 786-O and ACHN cell lines were both obtained from Procell Life Science & Technology (Wuhan, China) and maintained in RPMI medium and MEM medium (Gibco, Rockville, MD, USA), respectively. Cells were also cultured with 10% fetal bovine serum (Hyclone, Rockville, MD, USA) and 1% penicillin/streptomycin in 5×7 cm flasks. Cells were kept in a 37℃ incubator in a 5% CO2 fully humidified atmosphere. The anti-tropomyosin-1 antibody was obtained from Cell Signaling Technology (Danvers, MA, USA), while the anti-MMP-9, anti-VEGF, anti-E-cadherin, anti-CD34 and anti-β-actin antibodies were purchased from Biosynthesis Biotechnology (Beijing, China).
Plasmid construction and transient transfection
We purchased reconstructed plasmids from Suzhou GenePharma (Suzhou, China), including the over expression (OE) plasmid pEX4-TPM1, over-expression negative control (OE-NC) plasmid pEX4-NC, knock-down (KD) plasmid pGPU6/GFP/Neo-shTPM1 and knock-down negative control (KD-NC) plasmid pGPU6/GFP/Neo-shNC. In addition to these four groups, we designated another Mock group using LipofectamineTM 2000 only with no vector. 786-O and ACHN cells were seeded into 24-well microplates (approximately 4×10⁴ cells/well) and cultured for 24 to 48 hours. We transfected both cell lines with the plasmids mentioned above when cell confluence reached approximately 70%-80% using LipofectamineTM 2000 (Invitrogen, Carlsbad, CA, USA) according to the manufacturer's instructions. The ratio of plasmid to transfection reagent was 1:1.5.
Colony formation assay
Twenty-four hours after transfection, 786-O and ACHN cells were seeded into 6-well plates at approximately 500 cells per well. Cells were cultured for 8 to 10 days until small colonies could be clearly seen. Plates containing colonies were gently washed with PBS and fixed with ethanol for 10 minutes. Wells were rinsed again with PBS and the colonies were stained with 0.1% crystal violet solution in ethanol for 10 minutes. Experiments were performed three times in duplicate.
Tube formation assay
Matrigel™ (BD Biosciences, San Jose, CA, USA) was kept at 4°C overnight for precooling, and then, 60 μl of Matrigel™ was transferred to a 96-well plate. Twenty-four hours after transfection, ACHN and 786-O cells were collected, diluted and transferred to the assigned wells in a 96-well plate (2×10⁴ cells/well). After 8 hours of incubation, tube formation was imaged using a microscope at 40× magnification and quantified by counting the branch points in 3 randomly selected microscopic fields per well. Experiments were performed twice in duplicate.
Invasion assay
The invasive behaviors of 786-O and ACHN cells in response to alterations in TPM1 expression were assessed using Matrigel™ (BD Biosciences, San Jose, CA, USA) precoated 24-well Transwell® plates (Corning Costar, Corning, NY, USA). Twenty-four hours after transfection, we added 100 μl (106 cell/ml) of the cell suspension into the upper chamber and higher serum concentration medium into the lower chamber. After incubation for another 36 hours, cells that invaded to the bottom of the inserts were fixed in 2% paraformaldehyde in methanol and dyed with a 0.1% crystal violet solution. Three random 100× magnification microscopic fields were selected for cell counting.
Xenograft tumor models
Five groups of three mice each were subcutaneously injected with 100 μl (approximately 107 cells) of the ACHN cell suspension in the scapular region. ACHN cells were transfected with five different plasmids 24 hours prior to injection. The tumor size was measured via calipers at the injection site every six days. The tumor volume was calculated using the formula 0.5ab2, where a and b represent the larger and smaller of the 2 diameters, respectively. Four weeks later, mice were injected intraperitoneally with pentobarbital sodium 200 mg/kg for euthanasia. Immunodeficient mice (BALB/c) were purchased from Beijing Vital River Laboratory Animal Technology (Beijing, China). All experimental protocols were approved by the animal experiments ethical committee of Jilin University, and nude mice were cared for and manipulated in accordance with the committee's guidelines. All possible methods were utilized to reduce animal suffering while maintaining a certain number of animals in the study.
Western blotting
After nude mice were sacrificed, tumor specimens were immediately harvested and immersed in liquid nitrogen. One hundred milligrams of tumor tissue with 1 ml of RIPA lysis buffer suspended via a homogenizer. For 786-O and ACHN cell lines, both were harvested 36 hours after transfection. Cells were suspended in ice-cold buffer and homogenized after centrifugation. Homogenates were centrifuged at 10,000 g at 4°C for 10 minutes to obtain supernatants. Equal amounts of denatured protein were loaded on 10% polyacrylamide gels and separated by electrophoresis. Specific proteins were detected by immunoblotting using anti-TPM1 (1:1000), anti-VEGF (1:500), anti-E-cadherin (1:1000) and anti-β-actin (1:1000) antibodies.
Immunohistochemistry (IHC) staining
Xenograft tumor tissues were fixed for 36 hours in paraformaldehyde followed by embedding in paraffin wax. Tissue blocks were cut into thin slices and dried for 35 minutes at 60°C in an oven. Slides were deparaffinized with xylene and rehydrated through a series of graded ethanol. Antigen retrieval was performed in 10 mM sodium citrate buffer for 20 minutes in a microwave. Endogenous peroxidase was eliminated by a hydrogen peroxide solution, and slides were blocked with 5% BSA. Anti-MMP-9 (1:500) and anti-CD34 (1:500) primary antibodies were applied for overnight incubation at 4°C, followed by incubation with secondary antibody conjugated to streptavidin-horseradish peroxidase (Maixin biotechnology, Fuzhou, China). The immunoreactive score (IRS) was calculated as previously reported [13].
Statistical analysis
All statistical analyses were performed using GraphPad Prism 5.0 software (GraphPad Software, Inc., La Jolla, CA, USA). All data are expressed as the mean ± standard deviation unless otherwise stated. One-way or two-way analysis of variance (ANOVA) followed by the Bonferroni test was used for comparisons between groups. P<0.05 was considered statistically significant.
Results
TPM1 suppresses cell proliferation and tumorigenesis in RCC
Transient transfection of pEX4-TPM1 and pGPU6-shTPM1 in 786-O and ACHN cell lines was utilized to investigate the effects of TPM1 on RCC progression. The expression levels of TPM1 protein were detected by western blotting 24 hours after transfection. Both reconstructed plasmids were successfully transfected into the 786-O and ACHN cell lines. pEX4-TPM1 over-expression plasmid worked as expected while pGPU6-shTPM1 knock-down plasmid did not. These data were reported in our previous published article.
Figure 1
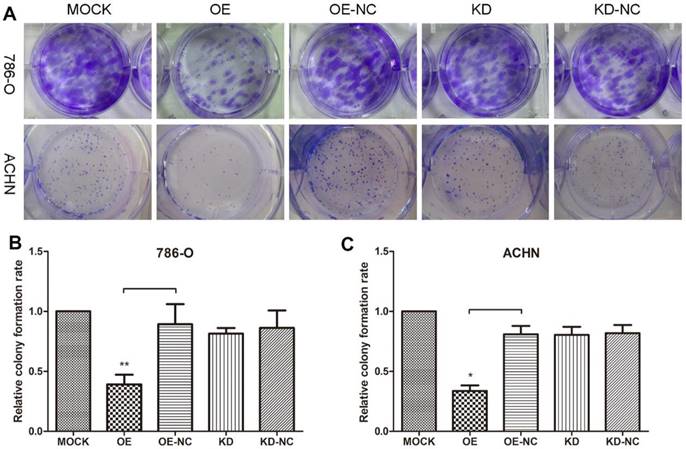
TPM1 up-regulation inhibits cell proliferation in 786-O and ACHN cell lines. (A) Representative pictures of colonies formed 10 days after plasmid transfection from each group. Relative colony formation rates of different groups in 786-O cells (B) and ACHN cells (C). Colony formation rate of the Mock group was defined as 100% for both cell lines. Values indicated by bars are mean ± standard deviation of 3 experimental repeats. * p<0.05, ** p<0.01 and *** p<0.001, compared with assigned negative control groups.
Colony formation assays were performed to evaluate 786-O and ACHN cell growth changes in response to changes in the TPM1 levels (Figure 1A). The results revealed remarkable reductions in colonies formed in the pEX4-TPM1 over-expression groups compared to the pEX4-NC negative controls (Figure 1B and 1C). No obvious difference was observed between the TPM1 knock-down groups and knock-down negative control groups (Figure 1B and 1C).
We utilized xenograft animal models to further assess the role of TPM1 in tumorigenesis. Compared to the negative controls, tumor burden was significantly reduced in response to TPM1 over-expression and was nearly unchanged in the TPM1 knock-down groups (Figure 2A). The OE group exhibited significant reductions in the average tumor volume from the beginning to the end of the experiments as well as delayed tumor formation compared to its counterpart, the OE-NC group (Figure 2B). Opposing phenomena were absent when we determined the tumor volumes in the KD and KD-NC groups (Figure 2C). Our results indicate that TPM1 suppresses RCC cell proliferation and tumorigenesis both in vitro and in vivo.
TPM1 inhibits RCC angiogenesis in vitro and in vivo
We performed a tube formation assay to profile the effects of TPM1 on angiogenesis in RCC. The branch points in each microscopic field, which represent the density of newly formed vessels, were significantly reduced in the TPM1 OE groups compared with their counterparts, the OE-NC groups (Figure 3A and 3B). The branch points in the TPM1 KD group were significantly increased compared to those in its counterpart, the KD-NC group, in 786-O cells, while this difference was absent in ACHN cells (Figure 3A and 3B).
Proteins were extracted from RCC tumor tissues, and western blotting was used to detect expression changes in VEGF in response to changes in TPM1 expression. The western blot results demonstrated that the TPM1 levels in xenograft tumors were significantly up-regulated after pEX4-TPM1 transfection but remained unchanged after pGPU6-shTPM1 transfection compared to those in their counterpart negative control groups (Figure 4A and 4B). The VEGF bands indicated that TPM1 up-regulation significantly decreases its expression levels (Figure 4A and 4B). VEGF expression showed no obvious difference between the TPM1 KD and KD-NC groups (Figure 4A and 4B). To further verify the anti-angiogenic effect of TPM1 in vivo, xenograft tumors from nude mice were sectioned and stained with the endothelial cell marker CD34. The CD34 staining results revealed that the microvessel density (MVD) was drastically reduced in the TPM1 OE group compared to that in the OE-NC group (Figure 4C and 4D). Similar to previous results, this difference was absent between the KD and KD-NC groups (Figure 4C and 4D).
TPM1 restrains invasion by regulating E-cadherin and MMP-9 in RCC
As a cytoskeleton protein, TPM1 might participate in RCC cell motility. A Transwell® invasion assay was performed to evaluate invading cells 60 hours after transfection with the different plasmids. Compared with the negative control groups, TPM1 over-expression clearly restrained the invasion ability of both RCC cell lines (Figure 5A and 5B). However, the opposite effects were not observed in response to down-regulation of TPM1 in RCC cells (Figure 5A and 5B).
Figure 2
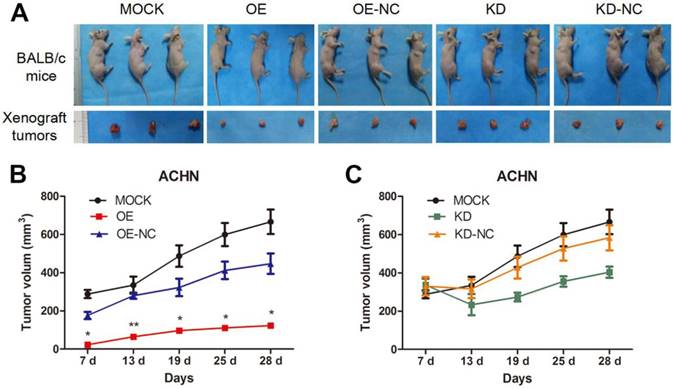
TPM1 suppresses RCC tumorigenesis and tumor growth in xenograft animal models. (A) Representative images showing xenograft tumors in nude mice and resected tumors from different treatment groups. (B-C) Tumor growth curves of different groups. (OE and OE-NC groups (B); KD and KD-NC groups (C)). Average tumor size of 3 mice per group is presented. Values indicated by bars are mean ± standard deviation. * p<0.05, ** p<0.01 and *** p<0.001, compared with assigned negative control groups.
Figure 3
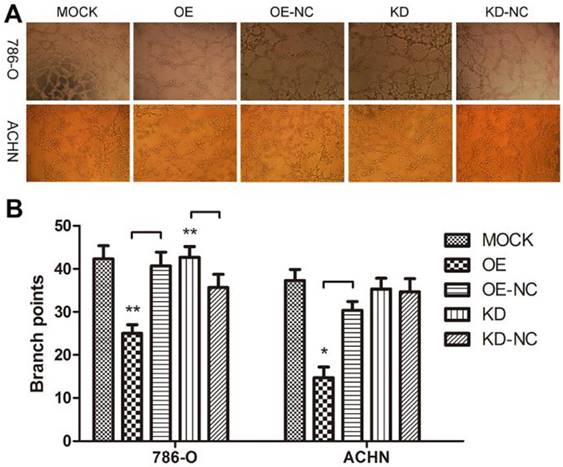
TPM1 up-regulation suppresses angiogenesis in 786-O and ACHN cell lines. (A) Representative images under phase contrast microscopy of tubes formed 8 hours after incubation with Matrigel™ in two RCC cell lines. (B) Statistical analysis of number of branch points for different groups in 786-O cells and ACHN cells. Reduced from ×40. Values indicated by bars are mean ± standard deviation of 3 randomly selected microscopic fields. * p<0.05, ** p<0.01 and *** p<0.001, compared to negative control groups.
Figure 4
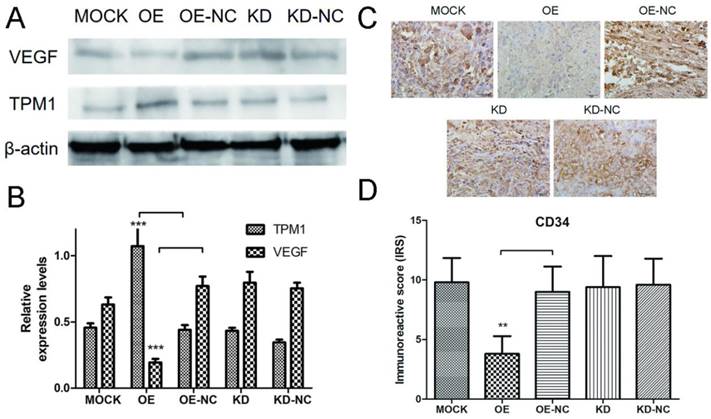
TPM1 suppresses RCC angiogenesis by down-regulating VEGF expression in vivo. (A) Representative cropped protein bands of VEGF, TPM1 and β-actin from different treatment groups. (B) Relative expression levels of VEGF were significantly down-regulated in response to TPM1 over-expression. (C) Representative IHC staining for CD34 in xenograft tumor sections from different treatment groups. (D) Immunoreactive scores of CD34 staining demonstrated that xenograft tumor MVD decreased significantly in response to TPM1 up-regulation. Reduced from ×400. Values indicated by bars are mean ± standard deviation of 3 repeats. * p<0.05, ** p<0.01 and *** p<0.001, compared to negative control groups.
Figure 5
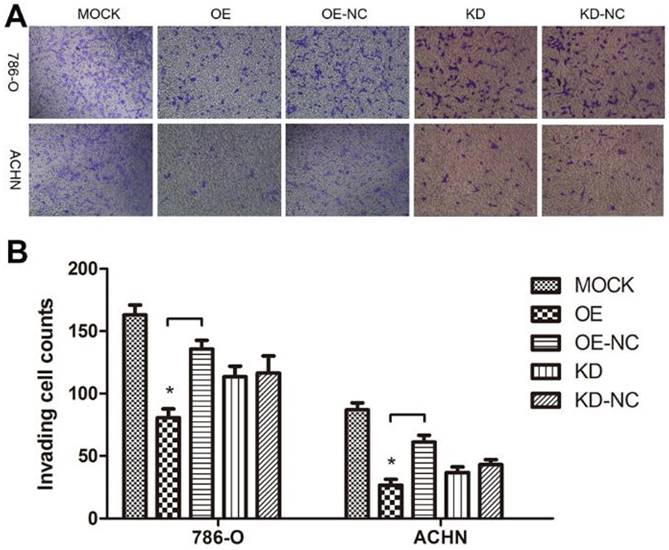
TPM1 up-regulation inhibits cell motility in 786-O and ACHN cell lines. (A) Invading cells through the Transwell membrane were stained and imaged for different treatment groups. (B) Statistical analysis of invading cell number for different groups in 786-O cells and ACHN cells. Reduced from ×100. Values indicated by bars are mean ± standard deviation of cell numbers in three randomly selected microscopic fields. * p<0.05, ** p<0.01 and *** p<0.001, compared to negative control groups.
Figure 6
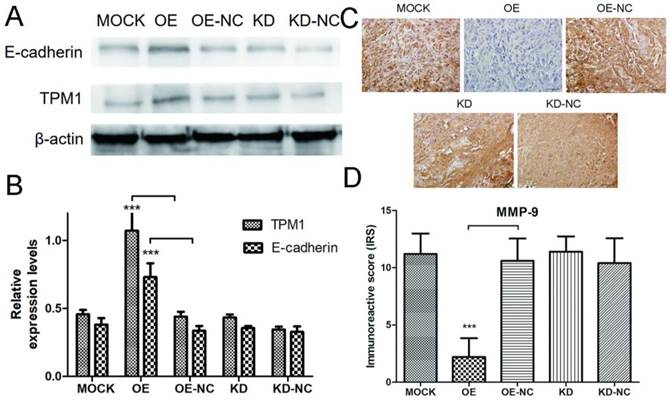
TMP1 over-expression correlates with increased expression of E-cadherin and decreased expression of MMP-9 in vivo. (A) Representative cropped protein bands of E-cadherin, TPM1 and β-actin from different treatment groups. (B) Relative expression levels of E-cadherin were significantly up-regulated in response to TPM1 over-expression. (C) Representative IHC staining for MMP-9 in xenograft tumor sections from different treatment groups. (D) Immunoreactive scores of MMP-9 staining demonstrated that MMP-9 was significantly down-regulated by TPM1 over-expression. Reduced from ×400. Values indicated by bars are mean ± standard deviation of three experimental repeats. * p<0.05, ** p<0.01 and *** p<0.001, compared to negative control groups.
Next, we performed western blotting and IHC staining on xenograft tumors to explore the potential mechanisms of TPM1-mediated inhibition of RCC metastasis. The expression levels of E-cadherin and MMP-9 were measured by western blotting and IHC in response to changes in TPM1 expression. The results demonstrated that the E-cadherin expression levels markedly increased and the MMP-9 expression levels significantly decreased in response to TPM1 up-regulation in vivo (Figure 6A-6D). Similar to our other observations, no changes in E-cadherin or MMP-9 expression were observed in the TPM1 KD group compared with the KD-NC group (Figure 6A-6D).
Discussion
The most important characteristics of malignant tumors are uncontrolled cell proliferation and infinite tumor growth. This study illustrated that TPM1 suppresses cell proliferation in vitro and inhibits tumor growth in vivo. These results are consistent with our previous observations from the MTT assay [14]. It has been reported that miRNA-21 is over-expressed in RCC tissue and modulates growth, apoptosis and cell cycle progression of RCC cells and regulates expression of programmed cell death 4 (PDCD4) and TPM1 [15]. TPM1 modulates all of these tumor suppressing effects, except for the cell cycle, according to our results. Other miRNAs, such as miRNA-107, also target TPM1 to influence cell proliferation and other tumor behaviors [16].
With the rapid growth of malignant tumors, hypoxia stress occurs inside the tumor, initiating multiple angiogenesis signaling pathways to meet the increasing demand for oxygen. Many anti-tumor drugs have been developed based on this theory. Prior to our study, TPM1 was found to be an intermediary in glioma between 4'-acetoamido-4-hydroxychalcone (AHC) and its anti-tumor effects, which include suppressing angiogenesis [8]. TPM1 is regulated by hypoxia to participate in angiogenesis-mediated cytoskeletal remodeling in human umbilical vein endothelial cells (HUVECs) [17]. By contrast, hyperoxia also down-regulates expression of TPM1 in neural crest stem cells [18]. Our study demonstrated that TPM1 up-regulation inhibits RCC angiogenesis by decreasing VEGF expression. Targeting angiogenic factors from the VEGF family has become an effective strategy for inhibiting tumor growth in RCC [19]. We hypothesize that TPM1 may be another potential target from the VEGF pathway for the treatment of advanced RCC.
Another characteristic of malignant tumors is metastasis. miRNA-21 targets TPM1, PDCD4 and maspin to regulate invasion and metastasis in breast cancer cells [20]. As mentioned above, TPM1 has been reported to stabilize cell-cell junctions and reduce the migratory potential of endothelial cells [12]. Matrix metalloproteinases (MMPs) and other extracellular matrix-degrading enzymes participate in RCC invasion and metastasis. Epithelial-mesenchymal transition (EMT) transcription factors, such as Snail and Slug, promote tumor cell invasion through up-regulation of MMPs and down-regulation of E-cadherin [21]. Thus, we hypothesized that TPM1 suppresses RCC cell mobility through regulation of those molecules. The transwell assay results confirmed the role of TPM1 in attenuating cell invasion. Further observation demonstrated that TPM1 over-expression correlated with increases in E-cadherin expression and decreases in MMP-9 expression. It can be inferred that TPM1 is involved in EMT, a key process in tumor invasion and distant dissemination. E-cadherin, MMP-9 and even VEGF participate in cell adherence and EMT [22].
In addition to cell proliferation, angiogenesis and metastasis, we previously reported that TPM1 is down-regulated in RCC and could induce RCC cell apoptosis [13,14]. Other studies found that decreased TPM1 might be one mechanism underlying radiation resistance and also a potential target for overcoming it in glioma [23]. Based on our findings in RCC and those of many other researchers in other tumors, it can be concluded that TPM1 is a novel TSG in RCC.
The highest impact of discovering a novel TSG in cancer is the opportunity to develop a new treatment method or to overcome resistance to targeted therapy. Prior to 2005, medical therapies for RCC were limited to cytokine therapies, which are very toxic and benefit only a small percentage of patients. As of 2017, therapeutic agents also include kinase and immune checkpoint inhibitors [24]. Inhibition of the VHL/ HIF/ VEGF and PI3K/ AKT/ mTOR pathways decrease protein translation and inhibit both angiogenesis and tumor cell proliferation. Although TKIs are the primary first-line treatment option for advanced RCC, all patients eventually become resistant to TKIs [25]. To overcome this resistance, second-line treatments based on different mechanisms can be used, including mTOR inhibitors (mTORi), programmed death 1 (PD-1) inhibitors, programmed death ligand 1 (PD-L1) inhibitors, or various combinations among them. TPM1 is reported to be related to the MEK/ERK and NF-κB signaling pathways in osteosarcoma [16]. Thus, TPM1 may be utilized to prevent tumor angiogenesis and apoptosis escape when RCC become resistant to TKI and mTORi.
In summary, this study revealed that TPM1 functions as a tumor suppressor primarily by inhibiting cell proliferation, angiogenesis and metastasis in RCC. This observation corroborated our hypothesis based on our previous studies. TPM1 is a potential therapeutic target for advanced RCC.
Abbreviations
TPM1: tropomyosin-1; RCC: renal cell carcinoma; MVD: microvessel density; IHC: immunohistochemistry; VEGF: vascular endothelial growth factor; CD34: cluster of differentiation 34; MMP-9: matrix metalloproteinases 9; ccRCC: clear cell renal cell carcinoma; TKIs: tyrosine kinase inhibitors; mTORi: mammalian target of rapamycin inhibitors; VHL: von Hippel-Lindau; HIF: hypoxia-inducible transcription factor; TSG: tumor suppressor gene; OE: over expression; OE-NC: over-expression negative control; KD: knock-down; KD-NC: knock-down negative control; ANOVA: analysis of variance; PDCD4: programmed cell death 4; AHC: 4'-acetoamido-4-hydroxychalcone; HUVECs: human umbilical vein endothelial cells; EMT: epithelial-mesenchymal transition; PD-1: programmed death 1; PD-L1: programmed death ligand 1.
Acknowledgements
This work was supported by the 8th Youth Development Program of the First Hospital, Jilin University (grant number JDYY82017015).
Author Contributions
Conception and design of experiments: Jin Wang. Implementation of experiments: Chao Tang. Data collection: Chao Tang and Chao Yang. Data analysis and visualization: Jin Wang and Chao Yang. Writing original drafts: Chao Tang and Qi Zheng. Review and modification: Jin Wang and Yuchuan Hou. Supervision: Jin Wang and Yuchuan Hou. Funding acquisition: Yuchuan Hou.
Availability of data and materials
All relevant data of the study were already included in the manuscript.
Ethics approval and consent
This study was approved by the Ethics Committee of the First Hospital, Jilin University. Animal experiments were conducted according to the guidelines and rules.
Competing Interests
The authors have declared that no competing interest exists.
References
1. Siegel RL, Miller KD, Jemal A. Cancer statistics, 2016. CA Cancer J Clin. 2016;66(1):7-30
2. Chen W, Zheng R, Zhang S. et al. Cancer incidence and mortality in China, 2013. Cancer Lett. 2017;401:63-71
3. Barata PC, Rini BI. Treatment of renal cell carcinoma: Current status and future directions. CA Cancer J Clin. 2017;67(6):507-524
4. Siska PJ, Beckermann KE, Rathmell WK, Haake SM. Strategies to overcome therapeutic resistance in renal cell carcinoma. Urol Oncol. 2017;35(3):102-110
5. Perry SV. Vertebrate tropomyosin: distribution, properties and function. J Muscle Res Cell Motil. 2001;22(1):5-49
6. Gunning P, O'Neill G, Hardeman E. Tropomyosin-based regulation of the actin cytoskeleton in time and space. Physiol Rev. 2008;88(1):1-35
7. Bharadwaj S, Prasad GL. Tropomyosin-1, a novel suppressor of cellular transformation is downregulated by promoter methylation in cancer cells. Cancer Lett. 2002;183(2):205-213
8. Ku BM, Ryu HW, Lee YK. et al. 4 '-Acetoamido-4-hydroxychalcone, a chalcone derivative, inhibits glioma growth and invasion through regulation of the tropomyosin 1 gene. Biochem Biophys Res Commun. 2010;402(3):525-530
9. Yang W, Wang X, Zheng W. et al. Genetic and epigenetic alterations are involved in the regulation of TPM1 in cholangiocarcinoma. Int J Oncol. 2013;42(2):690-698
10. Pan H, Gu L, Liu B. et al. Tropomyosin-1 acts as a potential tumor suppressor in human oral squamous cell carcinoma. PLoS One. 2017;12(2):e0168900
11. Zhu SM, Si ML, Wu HL, Mo YY. MicroRNA-21 targets the tumor suppressor gene tropomyosin 1 (TPM1). J Biol Chem. 2007;282(19):14328-14336
12. Gagat M, Grzanka D, Izdebska M, Grzanka A. Effect of L-homocysteine on endothelial cell-cell junctions following F-actin stabilization through tropomyosin-1 overexpression. Int J Mol Med. 2013;32(1):115-129
13. Wang J, Guan J, Lu Z. et al. Clinical and tumor significance of tropomyosin-1 expression levels in renal cell carcinoma. Oncol Rep. 2015;33(3):1326-1334
14. Tang C, Wang J, Wei Q. et al. Tropomyosin-1 promotes cancer cell apoptosis via p53-mediated mitochondrial pathway in renal cell carcinoma. Oncol Lett. 2018;15(5):7060-7068
15. Lv L, Huang F, Mao H. et al. MicroRNA-21 is overexpressed in renal cell carcinoma. Int J Biol Markers. 2013;28(2):201-207
16. Jiang R, Zhang C, Liu G. et al. MicroRNA-107 Promotes Proliferation, Migration, and Invasion of Osteosarcoma Cells by Targeting Tropomyosin 1. Oncol Res. 2017;25(8):1409-1419
17. Weigand JE, Boeckel JN, Gellert P, Dimmeler S. Hypoxia-induced alternative splicing in endothelial cells. PLoS One. 2012;7(8):e42697
18. Chen CC, Hsia CW, Ho CW. et al. Hypoxia and Hyperoxia Differentially Control Proliferation of Rat Neural Crest Stem Cells via Distinct Regulatory Pathways of the HIF1 alpha-CXCR4 and TP53-TPM1 Proteins. Dev Dynam. 2017;246(3):162-185
19. Dimova I, Popivanov G, Djonov V. Angiogenesis in cancer - general pathways and their therapeutic implications. J Buon. 2014;19(1):15-21
20. Zhu S, Wu H, Wu F. et al. MicroRNA-21 targets tumor suppressor genes in invasion and metastasis. Cell Res. 2008;18(3):350-359
21. Mikami S, Oya M, Mizuno R. et al. Recent advances in renal cell carcinoma from a pathological point of view. Pathol Int. 2016;66(9):481-490
22. Matoba R, Morizane Y, Shiode Y. et al. Suppressive effect of AMP-activated protein kinase on the epithelial-mesenchymal transition in retinal pigment epithelial cells. PLoS One. 2017;12(7):e0181481
23. Du HQ, Wang Y, Jiang Y. et al. Silencing of the TPM1 gene induces radioresistance of glioma U251 cells. Oncol Rep. 2015;33(6):2807-2814
24. Posadas EM, Limvorasak S, Figlin RA. Targeted therapies for renal cell carcinoma. Nat Rev Nephrol. 2017;13(8):496-511
25. Duran I, Lambea J, Maroto P. et al. Resistance to Targeted Therapies in Renal Cancer: The Importance of Changing the Mechanism of Action. Target Oncol. 2017;12(1):19-35
Author contact
![]() Corresponding author: Yuchuan Hou, Department of Urology, the First Hospital of Jilin University, 71 Xinmin Street, Changchun 130021, Jilin, China. Tel: +86-0431-81875808; Fax: +86-0431-85654528; E-mail: hou63com.
Corresponding author: Yuchuan Hou, Department of Urology, the First Hospital of Jilin University, 71 Xinmin Street, Changchun 130021, Jilin, China. Tel: +86-0431-81875808; Fax: +86-0431-85654528; E-mail: hou63com.
Citation styles
APA
Wang, J., Tang, C., Yang, C., Zheng, Q., Hou, Y. (2019). Tropomyosin-1 Functions as a Tumor Suppressor with Respect to Cell Proliferation, Angiogenesis and Metastasis in Renal Cell Carcinoma. Journal of Cancer, 10(10), 2220-2228. https://doi.org/10.7150/jca.28261.
ACS
Wang, J.; Tang, C.; Yang, C.; Zheng, Q.; Hou, Y. Tropomyosin-1 Functions as a Tumor Suppressor with Respect to Cell Proliferation, Angiogenesis and Metastasis in Renal Cell Carcinoma. J. Cancer 2019, 10 (10), 2220-2228. DOI: 10.7150/jca.28261.
NLM
Wang J, Tang C, Yang C, Zheng Q, Hou Y. Tropomyosin-1 Functions as a Tumor Suppressor with Respect to Cell Proliferation, Angiogenesis and Metastasis in Renal Cell Carcinoma. J Cancer 2019; 10(10):2220-2228. doi:10.7150/jca.28261. https://www.jcancer.org/v10p2220.htm
CSE
Wang J, Tang C, Yang C, Zheng Q, Hou Y. 2019. Tropomyosin-1 Functions as a Tumor Suppressor with Respect to Cell Proliferation, Angiogenesis and Metastasis in Renal Cell Carcinoma. J Cancer. 10(10):2220-2228.
This is an open access article distributed under the terms of the Creative Commons Attribution (CC BY-NC) license (https://creativecommons.org/licenses/by-nc/4.0/). See http://ivyspring.com/terms for full terms and conditions.