Journal of Cancer
ISSN: 1837-9664
3.2
Impact Factor
ISSN: 1837-9664

 Global reach, higher impact
J Cancer 2019; 10(3):697-707. doi:10.7150/jca.28494 This issue Cite
Research Paper
Multi-omics Perspective on the Tumor Microenvironment based on PD-L1 and CD8 T-Cell Infiltration in Urothelial Cancer
Siteng Chen*, Ning Zhang*, Jialiang Shao, Tao Wang, Xiang Wang ![]()
Department of Urology, Shanghai General Hospital, Shanghai Jiao Tong University School of Medicine, Shanghai, China
*Equal contributors and co-first authors
Received 2018-7-13; Accepted 2018-11-7; Published 2019-1-1
Citation:
Chen S, Zhang N, Shao J, Wang T, Wang X. Multi-omics Perspective on the Tumor Microenvironment based on PD-L1 and CD8 T-Cell Infiltration in Urothelial Cancer. J Cancer 2019; 10(3):697-707. doi:10.7150/jca.28494. https://www.jcancer.org/v10p0697.htm
Other stylesAbstract
Objectives: We carried out an integrated analysis based on multiple-dimensional types of data from cohorts of bladder cancer patients to identify multi-omics perspective (genomics and transcriptomics) on the tumor microenvironment on the bases of the programmed cell death 1 ligand (PD-L1) and CD8 T-cell infiltration in urothelial carcinoma.
Methods: Multiple-dimensional types of data, including clinical, genomic and transcriptomic data of 408 bladder cancer patients were retrieved from the Cancer Genome Atlas database. Based on the median values of PD-L1 and CD8A, the tumor samples were grouped into four tumor microenvironment immune types (TMIT). The RNA sequencing profiles, somatic mutation and PD-L1 amplification data of bladder cancer were analyzed by different TMITs.
Results: Our research demonstrated that 36.8% of the evaluated bladder cancer belonged to TMIT I (high PD-L1/high CD8A). TIMT subtypes were not significantly associated with overall survival or disease free survival in urothelial cancer. TMIT I facilitates CD8+ T-cell infiltration and activates T-effector and interferon gamma (IFN-γ) associated gene signature. The number of somatic mutations, cytolytic activity, IFN-γ mRNA expression and TIGIT mRNA expression in TMIT I was remarkably higher than those in other TMIT groups. Our results showed a high rate of C>T transversion and a high rate of transition/transversion (Ti/Tv) in TMIT I bladder tumors. The RB1 mutation was significantly associated with TMIT I bladder cancer and be significantly co-occurring with the TP53 mutation. However, FGFR3 mutation and TP53 mutation were mutually exclusive in TMIT II bladder tumors. More importantly, different amino acid changes by FGFR3/RB1 mutations were also found between TMIT I and TMIT II bladder cancer, such as amino acid changes in “Immunoglobulin I-set domain (260-356)”and “Protein tyrosine kinase (472-748)”. We also detected 9 genes as significantly cancer-associated genes in TMIT I bladder cancer, of which, RAD51C has been reported to play an important role in DNA damage responses. Further analysis concentrated on the potential molecular mechanism found that TMIT I was significantly associated with anti-tumor immune-related signaling pathway, and kataegis was present on chromosome 21 in TMIT I bladder tumors.
Conclusions: The classification of bladder cancer into four TMITs on the bases of the PD-L1 expression and the CD8+ CTLs statuses is an appropriate approach for bladder tumor immunotherapy. TMIT I (high PD-L1/high CD8A) is significantly correlated with more somatic mutation burden, and facilitates CD8+ T-cell infiltration and activates T-effector and IFN-γ associated gene signature. Alteration landscape for somatic variants was different between TMIT I and TMIT II (low PD-L1/low CD8A).
Keywords: Bladder cancer, PD-L1, Immunotherapy, TMIT, TIGIT, kataegis
Introduction
Recent attempts of immune checkpoint inhibitors that target the programmed cell death 1 (PD-1) and PD-1 ligand (PD-L1) have revealed robust antitumor activity with a favorable safety profile in the treatment of recurrent advanced urothelial carcinoma [1, 2]. However, the response rates are relatively low, and there are still no reliable predictive biomarkers of clinical benefits of anti-PD-1/PD-L1 therapies in bladder carcinoma to date.
Encouragingly, recent studies have prominently highlighted that PD-L1 expression [3], tumor mutational load [4], and the intensity of CD8+ T-cell infiltrates [5] could be potential biomarkers of clinical benefits of anti-PD-1/PD-L1 therapies. Furthermore, the classification of carcinoma into four different types on the bases of the CD8+ cytotoxic T cells (CTL) statuses and the expression of PD-L1 has been proposed recently [6]. Consistent with previous observations, cancers with the presence of CD8+ CTLs and high level of PD-L1 expression belong to tumor microenvironment immune type (TMIT) I, which was proved to be the potential predictive biomarker of clinical response to PD-L1/PD-1 immunotherapy [7]. However, this novel notion has not been verified by a bladder cancer genomics profiles.
Here, we carry out an integrated analysis on the bases of multiple-dimensional types of data, including clinical, genomic and transcriptomic data from cohorts of bladder cancer patients to identify multi-omics perspective on the tumor microenvironment on the bases of CD8 T-Cell infiltration and PD-L1 expression in urothelial carcinoma.
Materials and Methods
Demographic, clinical and pathological data
The Cancer Genome Atlas (TCGA) cohort was retrieved from the online data repository. A total of 408 bladder cancer samples were recruited in TCGA series with gene mutation data, mRNA expression profiles, and gene copy number alteration data. Key variables, including clinical and demographic information, were provided in Table 1.
Somatic variants data, mRNA expression profiling, and gene copy number alteration analysis
Analysis of RNA sequencing data from 408 bladder cancers was retrieved from the TCGA database. Experimental procedures, including RNA sequencing, quality control, mRNA library reading and further quantification of gene expression have been reported previously [8]. The cytolytic activity was defined as the geometric mean value of granzyme and perforin1 in each sample [9]. Mutation annotation format (MAF) of the 408 bladder cancers, which was used to store somatic variants detected, were also downloaded from the TCGA database. We used the package of “maftools” to summarize, analyze, annotate and visualize MAF files in an efficient manner [10]. Mutation spectrum for each tumor was evaluated as the percentage of six possible single nucleotide changes among single nucleotide substitutions as previously reported [11]. The predicted neoantigen number was referenced in a previous report by Chan-Young Ock [6]. Gene copy number alteration (CNA) analysis was based on CNA data from the TCGA database. Affymetrix SNP6.0 arrays were used to assess somatic CNAs and putative copy-number called in 408 cases determined using GISTIC 2.0. Values as previously described [8].
Table 1
Demographic, clinical and pathological information of TCGA cohort.
| TCGA Cohort | ||
|---|---|---|
| No. of patients | 408 | |
| Age | year | |
| Mean | 75.0 | |
| Range | 40~98 | |
| Gender | n(%) | |
| Male | 301(73.8) | |
| Female | 107(26.2) | |
| Stage | n(%) | |
| I | 2(0.5) | |
| II | 130(31.9) | |
| III | 140(34.3) | |
| Ⅳ | 134(32.8) | |
| Unknown | 2(0.5) | |
| TMIT types | n(%) | |
| I | 150(36.8) | |
| II | 150(36.8) | |
| III | 54(13.2) | |
| Ⅳ | 54(13.2) | |
| FGFR3 | n(%) | |
| Mutation | 60(14.7) | |
| Wild type | 348(85.3) | |
| RB1 | n(%) | |
| Mutation | 71(17.4) | |
| Wild type | 337 (82.6) | |
| Mutation burden | x±σ | 356.9±384.7 |
| mRNA expression | x±σ | |
| CD8A | 3.1±5.8 | |
| PD-L1 | 3.1±5.1 | |
| IFN-γ | 0.6±1.5 | |
| Cytolytic activity | x±σ | 6.6±11.8 |
| Neoantigen number | x±σ | 45.8±42.8 |
The cytolytic activity of each sample was calculated using the value of the geometric mean of granzyme and perforin1. The predicted neoantigen number was referenced in a previous report by Chan-Young Ock. TCGA, the Cancer Genome Atlas; TMIT, tumor microenvironment immune type; x±σ, mean ± standard deviation.
All of the 408 bladder cancer samples belonged to four TMITs as follows: type I, with expressions level of PD-L1 and CD8A higher than their median values, respectively; type II, with expressions level of PD-L1 and CD8A lower than their median values, respectively; type III, with higher PD-L1 expression and lower CD8A expression in contrast to their median values, respectively; and type IV, with lower PD-L1 expression and higher CD8A expression in contrast to their median values, respectively [7].
Gene set enrichment analysis
We also performed “Gene Set Enrichment Analysis (GSEA)” based on the molecular signatures database C5 BP: GO biological process collection [12], to associate the signature of genes with the TMIT I bladder tumors. False discovery rate (FDR) was calculated to effectively control false positives proportion. The normalized enrichment score (NES) was regarded as the primary statistic for examining GSEA enrichment results. The significance threshold was set at FDR < 0.0001.
Statistical analysis
In our study, the categorical variable was analyzed as a percentage and compared by a Pearson's Chi-square test. The continuous variable was analyzed using either a two-tailed Student's t-test or a one-way analysis of variance. The significant relationship between two continuous variables, such as the cytolytic activity, the expression level of interferon gamma (IFN-γ) mRNA and CD8A mRNA, was calculated by linear regression analysis. We also performed logistic regression analyses to determine the potential statistically significant relationship between genomic characteristics and the prediction of TMIT I. Statistical Package for Social Sciences 24.0 software (SPSS Inc., Chicago, IL, USA) was performed for statistical analysis. P values less than 0.05 were considered significant.
Results
A total number of 408 bladder cancer samples, included in the TCGA cohort, were grouped into four TMITs based on the expression levels of CD8A and PD-L1. As shown in Fig. 1a, 36.8% of the evaluated bladder tumors belonged to TMIT I, with a high proportion of CD8+ CTLs and high expression level of PD-L1. The proportions of TMIT II, III, and IV were 36.8%, 13.2%, and 13.2%, respectively. TIMT subtypes were not significantly associated with overall survival (OS) or disease free survival (DFS) in urothelial cancer (Fig. S1). The detailed clinical, pathological and molecular characteristics for the four TMIT types of the tumor samples were shown in Table 2.
Fig 1
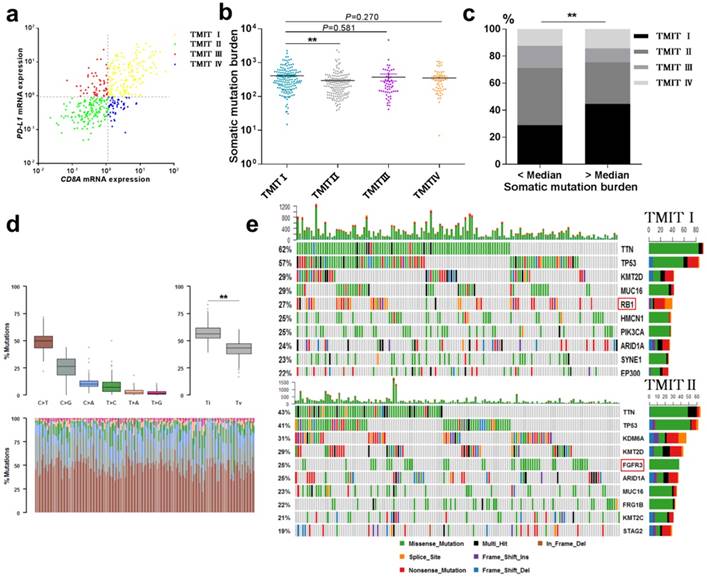
Landscape of TMIT, mutational signatures and mutations. (a) Scatter plot for the distribution of TMITs. (b) Comparation of somatic mutation burden between different TMITs. (c) Comparation of the proportion of TMIT I according to somatic mutation burden. (d) Boxplot for classification of somatic variants in 150 TMIT I bladder tumors. (e) Alteration landscape for 150 TMIT I bladder tumors and 150 TMIT II bladder tumors. TMIT, tumor microenvironment immune type; Ti, transition; Tv, transversion; ***, P < 0.001; **, P < 0.01; *, P < 0.05.
Table 2
Clinical, pathological, and molecular characteristics of urothelial cancer according to tumor microenvironment immune types based on PD-L1 and CD8 T-Cell infiltration
| TMIT I | TMIT II | P | TMIT III | P | TMIT Ⅳ | P | |
|---|---|---|---|---|---|---|---|
| No. | 150 | 150 | 54 | 54 | |||
| Age | 72.19±18.15 | 73.01±16.74 | 0.683 | 67.37±24.83 | 0.195 | 70.80±19.29 | 0.632 |
| Gender | 0.514 | 0.517 | 0.86 | ||||
| Male | 107(71.3%) | 113(75.3%) | 41(75.9%) | 40(74.1%) | |||
| Female | 43(28.7%) | 37(24.7%) | 13(24.1%) | 14(25.9%) | |||
| Stage | |||||||
| I | 0 | 1(0.7%) | / | 1(1.9%) | / | 0 | / |
| II | 46(30.7%) | 51(34.0%) | 0.511 | 16(29.6%) | 0.948 | 17(31.5%) | 0.912 |
| III | 58(38.7%) | 49(32.7%) | 0.297 | 16(29.6%) | 0.270 | 17(31.5%) | 0.348 |
| Ⅳ | 46(30.7%) | 48(32.0%) | 0.773 | 20(37.0%) | 0.345 | 20(37.0%) | 0.391 |
| High grade | 148(99.3%) | 135(90.0%) | *** | 48(92.3%) | * | 53(98.1%) | 0.462 |
| FGFR3-mut | 8(5.3%) | 38(25.3%) | *** | 4(7.4%) | 0.522 | 10(18.5%) | ** |
| RB1-mut | 40(26.7%) | 14(9.0%) | *** | 10(18.5%) | 0.233 | 7(13.0%) | * |
| Mutation burden | 412.23±354.62 | 297.01±312.47 | ** | 372.81±645.67 | 0.581 | 353.48±269.44 | 0.27 |
| PD-L1 CNA | |||||||
| Amplication | 57(38.0%) | 15(10.0%) | *** | 11(20.4%) | * | 3(5.6%) | *** |
| Deletion | 36(24.0%) | 84(56.0%) | *** | 18(33.3%) | 0.158 | 36(66.7%) | *** |
| mRNA expression | |||||||
| CD8A | 7.06±8.05 | 0.42±0.29 | *** | 0.63±0.31 | *** | 2.36±1.41 | *** |
| PD-L1 | 6.65±6.68 | 0.39±0.22 | *** | 3.09±3.72 | *** | 0.54±0.22 | *** |
| IFN-γ | 1.53±2.17 | 0.04±0.06 | *** | 0.01±0.10 | *** | 0.23±0.25 | *** |
| TIGIT | 2.04±1.78 | 0.28±0.30 | *** | 0.37±0.28 | *** | 0.84±0.62 | *** |
| Cytolytic activity | 14.23±15.58 | 1.69±6.13 | *** | 2.16±2.75 | *** | 3.49±2.41 | *** |
| Neoantigen number | 51.86±48.52 | 38.93±30.44 | 0.146 | 36.38±0.28 | 0.267 | 50.21±41.78 | 0.895 |
The cytolytic activity of each sample was calculated using the value of the geometric mean of granzyme and perforin1. The predicted neoantigen number was referenced in a previous report by Chan-Young Ock. TCGA, the Cancer Genome Atlas; TMIT, tumor microenvironment immune type; mut, mutation; P: P value compared to TMIT I; CNA, copy number alteration; x±σ, mean ± standard deviation; ***, P < 0.001; **, P < 0.01; *, P < 0.05.
High somatic mutation burden were correlated with TMIT I
The total mutation count and neoantigen have been reported to be associated with the immunotherapy to tumors [9, 13]. Here, we performed a linear regression analysis to explore the correlation between somatic mutation burden and predicted neoantigen in bladder cancer. Notably, a statistically significant correlation between the somatic mutation burden and the number of neoantigens was found (R2=0.767, P<0.0001, Fig. S2). More importantly, TMIT I group had a remarkable higher somatic mutation burden compared with the TMIT II tumors (412.2 vs.297.0; P < 0.01, Fig. 1b). Bladder tumors with more somatic mutation burden (higher than the median value) were accompanied with the higher proportion of TMIT I, compared with those with fewer mutations (44.6% vs.28.9%; P < 0.01; Fig. 1c).
Alteration landscape for somatic variants was different between TMIT I (high PD-L1/high CD8A) and TMIT II (low PD-L1/low CD8A)
We sought to explore whether TMIT I was associated with specific tumor mutation spectrum. Our results showed a high rate of C>T transversion and a high rate of transition/transversion (Ti/Tv) in TMIT I bladder tumors (Fig. 1d). Alteration landscape for 150 TMIT I bladder tumors and 150 TMIT II bladder tumors were shown in Fig. 1e. Seven genes were mutated in >25% of samples in TMIT I: TTN (62%), TP53 (57%), KMT2D (29%), MUC16 (29%), RB1 (27%), HMCN1 (25%), and PIK3CA (25%). While six genes were mutated in >25% of samples in TMIT II: TTN (43%), TP53 (41%), KDM6A (31%), KMT2D (29%), FGFR3 (25%) and ARID1A (25%). Specifically, a higher rate of FGFR3 mutation in TMIT II bladder tumors and a higher rate of RB1 mutation in TMIT I bladder tumors were found.
Interestingly, the vast majority of tumors with FGFR3 mutation were classified as TMIT II (low PD-L1/low CD8A), which was totally opposed to TMIT I (high PD-L1/high CD8A) (Fig. 2a). Similarly, the proportion of TMIT I in FGFR3 mutated tumors was statistical significantly lower than that in FGFR3 wild-type group (13.3% vs.40.8%; P < 0.001; Fig. S3a), consistent with the distribution of FGFR3 mutations in the scatter plot. However, the high proportion of tumors with RB1 mutation were grouped into TMIT I (Fig. 2c), and the proportion of TMIT I in RB1 mutated tumors was statistically significantly higher than that in RB1 wild-type group (56.3% vs. 32.6%; P < 0.001; Fig. S3b).
In consideration of the actual discovery that FGFR3/RB1 mutations were significantly correlated different between TMIT I and TMIT II bladder tumors, our study next to explore whether there were different amino acid changes by FGFR3/RB1 mutations between TMIT I and TMIT II bladder cancer. Our labelling points revealed that there were different amino acid changes in “Immunoglobulin I-set domain (260-356) ”and “Protein tyrosine kinase (472-748)” by FGFR3 mutation between TMIT I and TMIT II bladder tumors (Fig. 2b, Table 3). We also found different amino acid changes in “Retinoblastoma-associated protein A domain (373-573)”, “Retinoblastoma-associated protein B domain (645 - 766)” and “Rb C-terminal domain (768 - 927)” by RB1 mutation between these two subgroups (Fig. 2d, Table 3).
Many disease-causing genes in cancer are co-occurring or show strong exclusiveness in their mutation pattern. We next explored the potential different somatic interactions between TMIT I and TMIT II bladder tumors (Fig. 3a). The results demonstrated that in TMIT I bladder tumors, RB1 mutation and TP53 mutation were found to be significantly co-occurring (P < 0.05).While in TMIT II bladder tumors, FGFR3 mutation was proved to be significantly associated with STAG2 mutation and KDM6A mutation (P < 0.05). More importantly, FGFR3 mutation and TP53 mutation were mutually exclusive in TMIT II bladder tumors (P < 0.05).
Most of the variants in cancer-causing genes are enriched at few specific loci. To detect such cancer-associated genes, we performed a function called “oncodrive”, based on oncodriveCLUST algorithm originally implemented in Python framework [10, 14]. On the TMIT I cohort, oncodrive was able to detect 9 genes as significantly disease-associated genes, including RAD51C and PLK3. While on the TMIT II cohort, we detect 6 genes as significantly disease-associated genes, including FGFR3 and KRAS (Fig. 3b, Table 3).
Fig 2
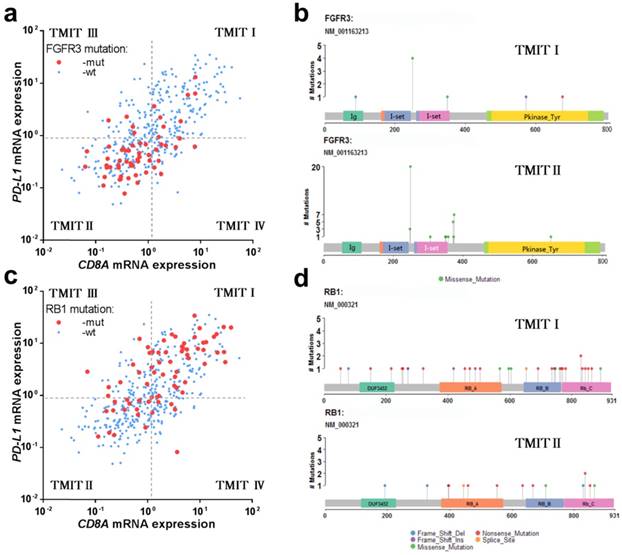
FGFR3 mutation and RB1 mutation in different TMITs of bladder tumors. (a) Scatter plot for the distribution of FGFR3 mutation between different TMITs. (b) Labelling points for the comparation of amino acid changes by FGFR3 mutation in TMIT I and TMIT II bladder tumors. (c) Scatter plot for the distribution of RB1 mutation between different TMITs. (d) Labelling points for the comparation of amino acid changes by RB1 mutation in TMIT I and TMIT II bladder tumors. TMIT, tumor microenvironment immune type; wt, wide type; mut, mutation; Ig, Immunoglobulin domain; I-set, Immunoglobulin I-set domain; Pkinase_Tyr, Protein tyrosine kinase.
Table 3
Different amino acid changes and related cancer-driver genes detected in TMIT I and TMIT II bladder tumors.
| TMIT I | Mutant gene (%) | Different amino acid changes | Related cancer-driver genes |
|---|---|---|---|
| I | RB1 (26.7%) | Retinoblastoma-associated protein A domain (373-573) Retinoblastoma-associated protein B domain (645 - 766) Rb C-terminal domain (768 - 927) | ZNF878,RGPD8,EEF1B2,KRTAP1-5,RXRA,GNA13,RAD51C, KRTAP4-11,PLK3 |
| II | FGFR3 (25.3%) | Immunoglobulin I-set domain (260-356) Protein tyrosine kinase (472-748) | ZNF814,FGFR3,POTEM,KRAS,RGPD8, RHOA |
Fig 3
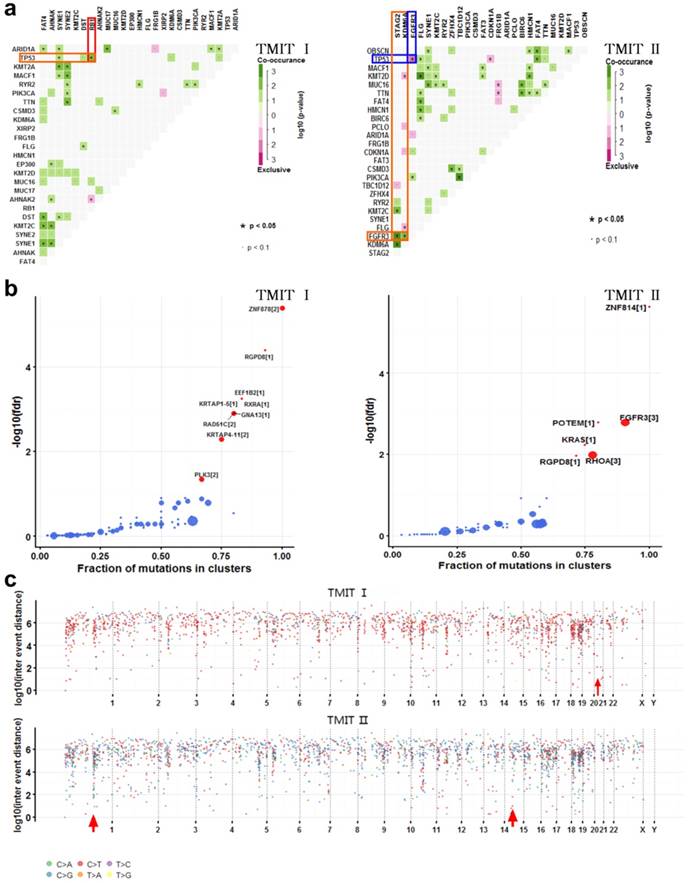
Comparation of somatic interactions, cancer driver genes and genomic loci with localized hyper-mutations between TMIT I and TMIT II bladder tumors. (a) Heatmap of mutually exclusive or co-occurring set of genes in the mutation pattern of TMIT I and TMIT II bladder tumors. (b) Detecting cancer driver genes based on positional clustering in TMIT I and TMIT II bladder tumors. Each dot represents a gene and size of the dot represents number clusters (mentioned inside square brackets) within which, a fraction (X-axis) of total variants are accumulated. (c) Rainfall plots for the genomic loci with localized hyper-mutations by inter variant distance on a linear genomic scale. Each dot represented a single nucleotide variants (SNV) and were color coded according to six substitution classes. Arrowheads indicated clusters of hyper mutated genomic regions called as “kataegis”. TMIT, tumor microenvironment immune type.
Table 4
Hyper mutated genomic regions detected in TMIT I and TMIT II bladder tumors.
| TMIT | Chromosome | Start Position | End Position | nMuts | Avg inter-mutation dist | Size | C > A | C > G | C > T | T > C | T > A | T > G |
|---|---|---|---|---|---|---|---|---|---|---|---|---|
| Ⅰ | 21 | 16339706 | 43867289 | 15 | 1966256 | 27527583 | NA | 7 | 8 | NA | NA | NA |
| Ⅱ | 1 | 150689682 | 152283878 | 25 | 66424.83 | 1594196 | 5 | 13 | 6 | 1 | NA | NA |
| 15 | 41859720 | 42442033 | 6 | 116462.6 | 582313 | NA | 4 | 2 | NA | NA | NA |
nMuts, number of mutations; Avg inter-mutation dist, average inter-mutation distance
Fig 4
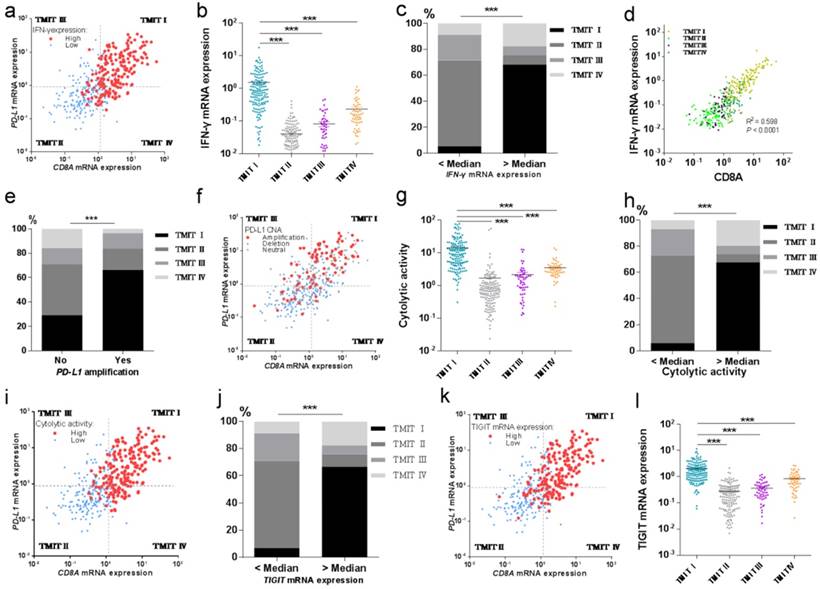
TMIT I was significantly correlated with immune-associated gene signature. (a) Scatter plot for the distribution of IFN-γ mRNA expression between different TMITs. (b) Comparation of IFN-γ mRNA expression between different TMITs. (c) Comparation of the proportion of TMIT I according to IFN-γ mRNA expression. (d) Significant correlation between IFN-γ mRNA expression and CD8A mRNA expression. (e) Comparation of the proportion of TMIT I according to PD-L1 amplification. (f) Scatter plot for the distribution of PD-L1 amplification between different TMITs. (g) Comparation of cytolytic activity between different TMITs. (h) Comparation of the proportion of TMIT I according to cytolytic activity. (i) Scatter plot for the distribution of cytolytic activity between different TMITs. (j) Comparation of the proportion of TMIT I according to cytolytic activity. (k) Scatter plot for the distribution of TIGIT mRNA expression between different TMITs. (l) Comparation of TIGIT mRNA expression between different TMITs. Cytolytic activity is calculated by the geometric mean of granzyme and perforin1. TMIT, tumor microenvironment immune type; ***, P < 0.001; **, P < 0.01; *, P < 0.05.
Cancer genomes have been reported to be characterized by hypermutated genomic regions called as “kataegis” [15]. We next explored the clusters of mutations in kataegis in both TMIT I and TMIT II cohorts. Rainfall plots for the genomic loci with localized hyper-mutations indicated that kataegis was present on chromosome 21 in TMIT I bladder tumors. However, kataegis was present on chromosomes 1 and 15 in TMIT II bladder tumors (Fig. 3c, Table 4).
TMIT I facilitates CD8+ T-cell infiltration and activates T-effector and IFN-γ associated gene signature
Then we tried to explore the potential relationship between TMIT I and CD8+ T-cell infiltration and IFN-γ associated gene signatures of the bladder cancer. And the results revealed that high proportions of tumors with high IFN-γ mRNA expression or high cytolytic activity were grouped into TMIT I, compared with other TMIT groups (Fig. 4a and Fig. 4i). Linear regression analysis found that IFN-γ mRNA expression was statistically significantly correlated with the CD8A mRNA expression (R2=0.598, P<0.0001, Fig. 4d). More importantly, both of the IFN-γ mRNA expression and the cytolytic activity were strikingly higher in TMIT I tumors than other TMIT groups (P < 0.001; Fig. 4b and Fig. 4g).
To verify the correction between IFN-γ mRNA expression and TMIT, the proportion of TMIT I was compared based on IFN-γ mRNA expression. We found that bladder tumors with a higher expression of IFN-γ mRNA had a remarkably higher proportion of TMIT I (68.1% vs.5.4%; P < 0.001; Fig. 4c). Similarly, bladder tumors with a higher cytolytic activity than the median value had a notably higher proportion of TMIT I, compared with those with lower cytolytic activity (67.6% vs.5.9%; P < 0.001; Fig. 4h).
Next, we sought to find the relationship between PD-L1 amplification and TMIT by CNA analysis based on the TCGA database. The proportion of PD-L1 amplification in bladder cancers was 21.1% (86/408). The proportion of TMIT I in the tumors with PD-L1 amplification was statistically higher than that in the control group (66.3% vs.29.2%; P < 0.001; Fig. 4e). Remarkably, scatter plot for the distribution of PD-L1 amplification demonstrated that almost all of the bladder cancers with PD-L1 amplification were classified as TMIT I, compared with other TMIT groups (Fig. 4f), which was consistent with observations in Fig. 4e.
We next explored the potential relationship of TIGIT mRNA expression and TMIT I in bladder cancer. Scatter plot for the distribution of TIGIT mRNA expression revealed that a high proportion of tumors with high TIGIT mRNA expression were grouped into TMIT I, compared with other TMIT groups (Fig. 4k). Bladder cancer with TIGIT mRNA expression higher than the median value had a remarkably higher proportion of TMIT I (66.7% vs. 6.9%; P < 0.0001; Fig. S4), compared with those with the fewer expression of TIGIT mRNA. More importantly, the expression of TIGIT mRNA was remarkably higher in TMIT I tumors than other TMIT groups (P < 0.001; Fig. 4l).
Finally, logistic regression analyses were performed to determine the potential statistically significant relationship between genomic characteristics and the prediction of TMIT I. The results revealed that high cytolytic activity, PD-L1 amplification, high IFN-γ mRNA expression and high TIGIT mRNA expression were independently correlated with TMIT I (Table 5).
TMIT I was significantly associated with anti-tumor immune-related signaling pathway
To explore the potential molecular mechanisms of TMIT I accounting for their effects on anti-PD-1/PD-L1 therapy in bladder cancer, GSEA was performed to associate the signature of genes with the TMIT I bladder tumors. The GSEA results demonstrated remarkable enrichment of signatures relating to anti-tumor immune responses, for example, the cytokine-mediated signaling pathway, IFN-γ mediated signaling pathway, activation of the immune response and MHC I -dependent antigen processing and presentation (Fig. 5).
Discussion
Based on the notion that effective anti-tumor immunity requires an appropriate tumor immune microenvironment, several studies have recently suggested the classification of tumors into four different types on the bases of PD-L1 expression and CD8+ CTLs statuses [6, 7, 16]. However, the underlying biology process of tumor immune microenvironment has not been fully understood until recent studies, which have shown the presence of the tumor infiltrates lymphocytes (TIL) and mutational burden are correlated with T-effector signature and immunogenic features, supporting the clinical benefits from PD-1/PD-L1 immunotherapy [11, 17, 18]. Our study was designed to identify multi-omics perspective (genomics and transcriptomics) on the tumor microenvironment on the bases of CD8 T-Cell infiltration and PD-L1 in urothelial carcinoma, and to address why TMIT I could be the potential predictive biomarker for clinical response to PD-1/PD-L1 immunotherapy from multi-omics. Our results suggested that TMIT I was proved to be correlated with high somatic mutation burden, and facilitate CD8+ T-cell infiltration and activate T-effector and IFN-γ associated gene signature. However, we did not find significantly association between TIMT subtypes and OS or DFS in urothelial cancer, which was similar to previous study in colorectal carcinomas [16]. The possible reason may be that TIMT subtypes are useful biomarkers for predicting response to PD-1 blockade. However, the urothelial cancer patients recruited in our study from the TCGA cohort did not received PD-1 blockade immunotherapy. So future clinical investigations and validations in urothelial cancer patients receiving PD-1 blockade immunotherapy are still needed.
Table 5
Logistic regression analysis for predicting tumor microenvironment immune type I according to clinical characteristics
| Univariate analysis | Multivariate analysis | |||||
|---|---|---|---|---|---|---|
| OR (95% CI) | P value | OR (95% CI) | P value | |||
| Age | 1.003(0.984~1.022) | 0.760 | / | / | ||
| Gender | 0.821(0.522~1.291) | 0.393 | / | / | ||
| Number of mutations | ≥Median | 1.979(1.314~2.981) | 0.001 | 1.055 (0.548~2.031) | 0.874 | |
| Cytolytic activity | ≥Median | 33.455(17.416~64.264) | 5.73E-26 | 5.599 (2.335~13.422) | 1.13E-04 | |
| PD-L1 amplification | Yes | 4.179(2.555~6.836) | 1.23E-08 | 11.454 (4.288~30.599) | 1.00E-06 | |
| IFN-γ mRNA expression TIGIT mRNA expression | ≥Median | 35.520(19.100~73.704) | 6.79E-26 | 10.806 (4.453~26.224) | 1.42E-07 | |
| ≥Median | 27.143(14.661~50.251) | 8.20E-26 | 6.296 (2.702~14.671) | 2.00E-05 | ||
OR, odds ratio; CI, confidence interval.
Fig 5
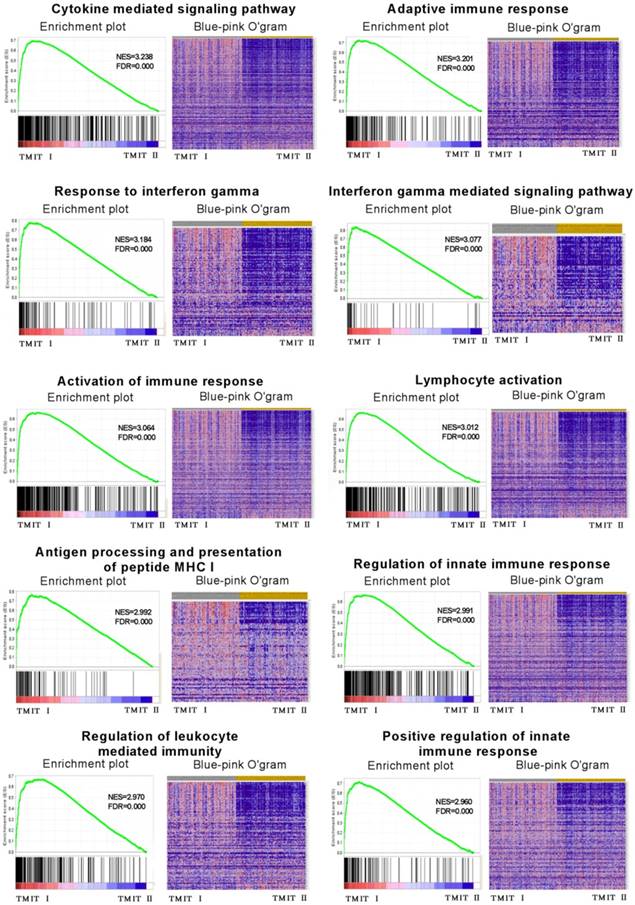
GSEA revealed that TMIT I was significantly associated with some immune-related signaling pathway. The enrichment plot was used for providing a graphical view of the enrichment score for a gene set. The heatmap (Blue-Pink O' Gram) showed the expression of clustered-genes in the leading edge subsets, where the range of colors (red, pink, light blue, dark blue) showed the range of expression values (high, moderate, low, lowest). GSEA, gene set enrichment analysis; TMIT, tumor microenvironment immune type; NSE, normalized enrichment score; FDR, false discovery rate.
The presence of neoantigen and somatic mutation burden have been proved to be associated with immunogenic features of carcinoma [9, 13]. The number of somatic mutation was considered to correlate with the chance of response to PD-1/PD-L1 blocking therapies. Here, in the TCGA cohort of bladder cancer, our linear regression analysis also found a statistically significant correlation between somatic mutation burden and the number of neoantigens. Strikingly, TMIT I group had a notably higher somatic mutation burden compared with the TMIT II tumors, indicating a more effective response to PD-1/PD-L1 blocking therapies in TMIT I bladder tumors.
Previous studies have prominently highlighted the important role of PD-L1 in immune tolerance. Urothelial carcinoma patients with PD-L1-positive cancers have a higher rate of clinical response compared to PD-L1-negative tumors [19]. In this study, the vast majority of tumors with PD-L1 amplification were classified as TMIT I. More importantly, the proportion of TMIT I in the tumors with PD-L1 amplification was remarkably higher than that in the control group without PD-L1 amplification, which indicated the potential synergistic effects of TMIT I tumors on activating PD-L1 expression. Maybe the PD-L1 amplification directly contributes to the high PD-L1 expression, which needs further validation.
The PD-L1 expression has been proved to be controlled by inflammatory signaling, produced by soluble factors from immune cells. Of those factors, IFN-γ has recently been described as the most prominent soluble inducer of PD-L1 [20]. In this study, we found the significant association between high IFN-γ mRNA expression and TMIT I. The IFN-γ mRNA expression were significantly higher in TMIT I tumors (high PD-L1 mRNA expression) than other TMIT groups, indicating potential synergistic effects on activating PD-L1 expression by IFN-γ signaling.
As the limelight novel immune checkpoint receptor target, TIGIT has been proved to be involved in mediating T cell exhaustion in tumors [21]. Blockade of TIGIT could prevent natural killer (NK) cell exhaustion and promote NK cell-dependent tumor immunity [22]. Here, we represent the first report to demonstrate the perspective of TIGIT in bladder tumor. More importantly, TIGIT mRNA expression was strikingly higher in TMIT I bladder cancer than other TMIT groups. This result is of importance because it revealed that the classification of tumors into four TMITs might be an important method for cancer immunotherapy based on other immune checkpoint inhibitors except for PD-1/PD-L1, such as TIGIT, which was associated with the dysfunction of NK cells.
Recently TP53 mutation has been considered to show significant clinical benefit to PD-1 inhibitors by altering a group of genes involved in cell-cycle regulating, DNA replication and damage repair [11]. In this study, we were surprised to found that RB1 mutation was significantly associated with TMIT I bladder cancer, and be significantly co-occurring with TP53 mutation, which could significantly activate T-effector and IFN-γ signature. However, the FGFR3 mutation was negatively correlated with TMIT I subgroup. FGFR3 and TP53 were mutually exclusive in TMIT II bladder tumors. More importantly, different amino acid changes by FGFR3/RB1 mutations were also found between TMIT I and TMIT II bladder cancer (Fig.2b, Fig.2d), such as amino acid changes in “Immunoglobulin I-set domain (260-356)”and “Protein tyrosine kinase (472-748)”, which were consistent with our GSEA observations that TMIT I was significantly associated with anti-tumor immune-related signaling pathway, including the cytokine-mediated signaling pathway, IFN-γ mediated signaling pathway and MHC I -dependent antigen processing and presentation, thereby affecting anti-tumor immune response in bladder tumors.
We detected 9 genes as significantly cancer-associated genes in TMIT I (high PD-L1/high CD8A) bladder cancer, of which, RAD51C has been reported to play an important role in DNA damage responses [23]. Remarkably, RAD51C is necessary for phosphorylation of CHK2 by ATM, which is important for checkpoint activation and acting as a favorable agent for PD-1/PD-L1 blockade therapy [24]. We also discovered different clusters of mutations in kataegis between TMIT I and TMIT II bladder tumors. Previous studies have highlighted that kataegis was characterized by clusters of C>T or C>G mutations, which were substantially enriched at TpCpN trinucleotides and on the same DNA strand [15]. It was a pity that future studies were still needed to uncover potential mechanisms that account for the different kataegis between TMIT I and TMIT II bladder tumors.
Our study has some limitations. For example, the cutoff values of CD8A and PD-L1 have not been assessed accurately. Furthermore, there were no clinical data of patients in the TCGA cohort received PD-1 blockade immunotherapy to demonstrate the real value of TMITs for response to PD-1 blockade immunotherapy in urothelial cancer directly. However, our study has some novel approaches compared to previous studies [6, 16]. Firstly, this study is ponderable since we firstly evaluated TMITs of bladder tumors based on multi-omics data. Secondly, we preliminarily investigated the underlining biology process of TMITs and found that BR1 mutation in TMIT I subset and FGFR3 mutation in TMIT II subset might play important roles in predicting clinical response to PD-L1/PD-1 immunotherapy. And thirdly, we represented the first report to demonstrate the perspective of TIGIT in bladder tumor, which could prevent NK cell exhaustion and promote NK cell-dependent tumor immunity.
Conclusion
In summary, our study provided a multi-omics perspective on the tumor microenvironment on the bases of CD8 T-Cell infiltration and PD-L1 in urothelial carcinoma. The classification of bladder cancer into four TMITs on the bases of the PD-L1 expression and the CD8+ CTLs statuses is an appropriate approach for bladder tumor immunotherapy. There was not significantly association between TIMT subtypes and OS or DFS in urothelial cancer. TMIT I (high PD-L1/high CD8A) is significantly correlated with more somatic mutation burden, and facilitates CD8+ T-cell infiltration and activates T-effector and IFN-γ associated gene signature. Alteration landscape for somatic variants was different between TMIT I and TMIT II (low PD-L1/low CD8A).
Abbreviations
TCGA: The Cancer Genome Atlas; PD-1: programmed cell death 1; PD-L1: PD-1 ligand; CTL: cytotoxic T cells; TMIT: tumor microenvironment immune type; MAF: mutation annotation format; CAN: copy number alteration; GSEA: Gene Set Enrichment Analysis; FDR: false discovery rate; NES: normalized enrichment score; Ti/Tv: transition/transversion; IFN-γ: interferon gamma; TIL: tumor infiltrates lymphocytes.
Supplementary Material
Supplementary figures.
Acknowledgements
This work was supported by the National Natural Science Foundation of China (81570607) and the three-year action plan for promoting clinical skills and clinical innovation in municipal hospitals of Shanghai Shenkang (16CR2003A).
Competing Interests
The authors have declared that no competing interest exists.
References
1. Plimack ER, Bellmunt J, Gupta S, Berger R, Chow LQ, Juco J. et al. Safety and activity of pembrolizumab in patients with locally advanced or metastatic urothelial cancer (KEYNOTE-012): a non-randomised, open-label, phase 1b study. The Lancet Oncology. 2017;18(2):212-220
2. Bellmunt J, de Wit R, Vaughn DJ, Fradet Y, Lee JL, Fong L. et al. Pembrolizumab as Second-Line Therapy for Advanced Urothelial Carcinoma. The New England journal of medicine. 2017;376(11):1015-1026
3. Herbst RS, Soria JC, Kowanetz M, Fine GD, Hamid O, Gordon MS. et al. Predictive correlates of response to the anti-PD-L1 antibody MPDL3280A in cancer patients. Nature. 2014;515(7528):563-567
4. Rizvi NA, Hellmann MD, Snyder A, Kvistborg P, Makarov V, Havel JJ. et al. Cancer immunology. Mutational landscape determines sensitivity to PD-1 blockade in non-small cell lung cancer. Science. 2015;348(6230):124-128
5. Tang H, Wang Y, Chlewicki LK, Zhang Y, Guo J, Liang W. et al. Facilitating T Cell Infiltration in Tumor Microenvironment Overcomes Resistance to PD-L1 Blockade. Cancer cell. 2016;29(3):285-296
6. Ock CY, Keam B, Kim S, Lee JS, Kim M, Kim TM. et al. Pan-Cancer Immunogenomic Perspective on the Tumor Microenvironment Based on PD-L1 and CD8 T-Cell Infiltration. Clinical cancer research. 2016;22(9):2261-2270
7. Teng MW, Ngiow SF, Ribas A, Smyth MJ. Classifying Cancers Based on T-cell Infiltration and PD-L1. Cancer research. 2015;75(11):2139-2145
8. Cancer Genome Atlas Research Network. Comprehensive molecular characterization of urothelial bladder carcinoma. Nature. 2014;507(7492):315-322
9. Rooney MS, Shukla SA, Wu CJ, Getz G, Hacohen N. Molecular and genetic properties of tumors associated with local immune cytolytic activity. Cell. 2015;160(1-2):48-61
10. Mayakonda A, Koeffler HP. Maftools: Efficient analysis, visualization and summarization of MAF files from large-scale cohort based cancer studies. bioRxiv. 2016 doi: http://dx.doi.org/10.1101/052662
11. Dong ZY, Zhong WZ, Zhang XC, Su J, Xie Z, Liu SY. et al. Potential Predictive Value of TP53 and KRAS Mutation Status for Response to PD-1 Blockade Immunotherapy in Lung Adenocarcinoma. Clinical cancer research. 2017;23(12):3012-3024
12. Subramanian A, Tamayo P, Mootha VK, Mukherjee S, Ebert BL, Gillette MA. et al. Gene set enrichment analysis: a knowledge-based approach for interpreting genome-wide expression profiles. Proceedings of the National Academy of Sciences of the United States of America. 2005;102(43):15545-15550
13. Schumacher TN, Schreiber RD. Neoantigens in cancer immunotherapy. Science. 2015;348(6230):69-74
14. Tamborero D, Gonzalez-Perez A, Lopez-Bigas N. OncodriveCLUST: exploiting the positional clustering of somatic mutations to identify cancer genes. Bioinformatics. 2013;29(18):2238-2244
15. Alexandrov LB, Nik-Zainal S, Wedge DC, Aparicio SA, Behjati S, Biankin AV. et al. Signatures of mutational processes in human cancer. Nature. 2013;500(7463):415-421
16. Hamada T, Soong TR, Masugi Y, Kosumi K, Nowak JA, da Silva A. et al. TIME (Tumor Immunity in the MicroEnvironment) classification based on tumor CD274 (PD-L1) expression status and tumor-infiltrating lymphocytes in colorectal carcinomas. Oncoimmunology. 2018;7(7):e1442999
17. Masugi Y, Nishihara R, Yang J, Mima K, da Silva A, Shi Y. et al. Tumour CD274 (PD-L1) expression and T cells in colorectal cancer. Gut. 2017;66(8):1463-1473
18. Shukuya T, Carbone DP. Predictive Markers for the Efficacy of Anti-PD-1/PD-L1 Antibodies in Lung Cancer. Journal of thoracic oncology. 2016;11(7):976-988
19. Rosenberg JE, Hoffman-Censits J, Powles T, van der Heijden MS, Balar AV, Necchi A. et al. Atezolizumab in patients with locally advanced and metastatic urothelial carcinoma who have progressed following treatment with platinum-based chemotherapy: a single-arm, multicentre, phase 2 trial. Lancet. 2016;387(10031):1909-1920
20. Sun C, Mezzadra R, Schumacher TN. Regulation and Function of the PD-L1 Checkpoint. Immunity. 2018;48(3):434-452
21. Dougall WC, Kurtulus S, Smyth MJ, Anderson AC. TIGIT and CD96: new checkpoint receptor targets for cancer immunotherapy. Immunological reviews. 2017;276(1):112-120
22. Zhang Q, Bi J, Zheng X, Chen Y, Wang H, Wu W. et al. Blockade of the checkpoint receptor TIGIT prevents NK cell exhaustion and elicits potent anti-tumor immunity. Nature immunology. 2018;19(7):723-732
23. Somyajit K, Subramanya S, Nagaraju G. RAD51C: a novel cancer susceptibility gene is linked to Fanconi anemia and breast cancer. Carcinogenesis. 2010;31(12):2031-2038
24. Badie S, Liao C, Thanasoula M, Barber P, Hill MA, Tarsounas M. RAD51C facilitates checkpoint signaling by promoting CHK2 phosphorylation. The Journal of cell biology. 2009;185(4):587-600
Author contact
![]() Corresponding author: Xiang Wang, Department of Urology, Shanghai General Hospital, Shanghai Jiao Tong University School of Medicine, Shanghai, China. E-mail: seanw_hscom (XW), Tel: 86-21-52888279
Corresponding author: Xiang Wang, Department of Urology, Shanghai General Hospital, Shanghai Jiao Tong University School of Medicine, Shanghai, China. E-mail: seanw_hscom (XW), Tel: 86-21-52888279
Citation styles
APA
Chen, S., Zhang, N., Shao, J., Wang, T., Wang, X. (2019). Multi-omics Perspective on the Tumor Microenvironment based on PD-L1 and CD8 T-Cell Infiltration in Urothelial Cancer. Journal of Cancer, 10(3), 697-707. https://doi.org/10.7150/jca.28494.
ACS
Chen, S.; Zhang, N.; Shao, J.; Wang, T.; Wang, X. Multi-omics Perspective on the Tumor Microenvironment based on PD-L1 and CD8 T-Cell Infiltration in Urothelial Cancer. J. Cancer 2019, 10 (3), 697-707. DOI: 10.7150/jca.28494.
NLM
Chen S, Zhang N, Shao J, Wang T, Wang X. Multi-omics Perspective on the Tumor Microenvironment based on PD-L1 and CD8 T-Cell Infiltration in Urothelial Cancer. J Cancer 2019; 10(3):697-707. doi:10.7150/jca.28494. https://www.jcancer.org/v10p0697.htm
CSE
Chen S, Zhang N, Shao J, Wang T, Wang X. 2019. Multi-omics Perspective on the Tumor Microenvironment based on PD-L1 and CD8 T-Cell Infiltration in Urothelial Cancer. J Cancer. 10(3):697-707.
This is an open access article distributed under the terms of the Creative Commons Attribution (CC BY-NC) license (https://creativecommons.org/licenses/by-nc/4.0/). See http://ivyspring.com/terms for full terms and conditions.