Journal of Cancer
ISSN: 1837-9664
3.2
Impact Factor
ISSN: 1837-9664

 Global reach, higher impact
J Cancer 2018; 9(24):4586-4595. doi:10.7150/jca.27672 This issue Cite
Research Paper
Overexpression of FNDC1 in Gastric Cancer and its Prognostic Significance
Jun Ren*, Gengming Niu*, Xin Wang, Tao Song, Zhiqing Hu, Chongwei Ke ![]()
Department of General Surgery, Shanghai Fifth People's Hospital, Fudan University, Shanghai, China
*These authors contributed equally to this work
Received 2018-6-5; Accepted 2018-9-10; Published 2018-11-13
Citation:
Ren J, Niu G, Wang X, Song T, Hu Z, Ke C. Overexpression of FNDC1 in Gastric Cancer and its Prognostic Significance. J Cancer 2018; 9(24):4586-4595. doi:10.7150/jca.27672. https://www.jcancer.org/v09p4586.htm
Other stylesAbstract
Objectives: The aims of this study were to compare the expression of fibronectin type III domain containing 1 (FNDC1) in gastric cancer (GC) and normal gastric tissue, to explore the prognostic significance of FNDC1 expression in patients with gastric adenocarcinoma, and to analyze FNDC1-related signaling pathways.
Methods: The expression level of FNDC1 was initially predicted using the Oncomine and Cancer Genome Atlas databases. A Kaplan-Meier plotter database was mined to examine the clinical prognostic significance of FNDC1 mRNA in patients with GC. Subsequently, immunohistochemistry was used to measure FNDC1 protein expression levels in tissue from 90 cases of GC and paired adjacent normal tissue. Kaplan-Meier univariate and Cox multivariate survival analyses were used to determine the prognostic role of FNDC1 expression.
Results: Bioinformatic data indicated that FNDC1 mRNA expression levels were significantly highly expressed in GC compared with normal gastric tissue (all P < 0.05), and patients with GC with high FNDC1 mRNA expression levels had remarkably lower overall survival (all P < 0.01). Immunohistochemical results revealed that expression levels of FNDC1 protein were significantly increased in GC compared with normal gastric tissue (P < 0.001). Additionally, Kaplan-Meier univariate and Cox multivariate survival analyses indicated that increased expression of FNDC1 was an independent predictor of poor prognosis in patients with GC (all P < 0.05).
Conclusions: FNDC1 was highly expressed in GC, and high expression of FNDC1 was an independent predictor of poor prognosis in patients with GC. FNDC1 co-expressed genes were largely enriched in extracellular matrix-receptor interactions, which are closely related to tumor metastasis.
Keywords: stomach neoplasms, prognosis, bioinformatics, FNDC1
Introduction
Gastric cancer (GC) is the fifth most common malignant tumor of the digestive tract and the third most common cause of cancer-related death worldwide[1, 2]. Most patients with GC are diagnosed at advanced stages of the disease, and thus have lost the best opportunities for treatment[3]. Despite gradual declines in the incidence of and mortality from GC in recent years, the overall prognosis of GC has not improved significantly[4]. Thus, exploring highly specific and sensitive biomarkers and identifying new molecular targets may not only help clinicians predict prognosis, but also help clarify the mechanism underlying gastric tumorigenesis, which has profound significance for the development of new drug targets.
Fibronectin type III domain containing 1 (FNDC1) is a protein-coding and disease-related gene, also known as AGS8, FNDC2, or MEL4B, which contains the conserved fibronectin type III domain of fibronectin (FN)[5-7]. FN is an important type of extracellular matrix (ECM) protein and a well-known regulator of tumorigenesis that is involved in cell proliferation, migration, and invasion in several human tumors[8-10]. Liu et al.[11] reported that FN may play a critical role in the modulation of cell proliferation and invasion via mTOR signaling activation in gallbladder cancer progression. Moreover, Vizoso and colleagues[12] found that breast cancer cells with distant metastases frequently expressed intracellular FN, and that FN expression by tumor cells was associated strongly with matrix metalloprotease expression by stromal mononuclear inflammatory cells, which may represent crosstalk that is of prognostic relevance in breast cancer. However, a limited number of studies have examined the function of FNDC1. Although reports have described the potential role of FNDC1 in inflammation and hypoxia-induced apoptosis of cardiomyocytes[13, 14], the expression levels of FNDC1 in malignant tumors, especially in GC, have not been well defined.
Therefore, in the present study, the Cancer Genome Atlas (TCGA) and Oncomine databases were used to compare the expression levels of FNDC1 mRNA in GC and normal gastric tissue. In addition, the Kaplan-Meier plotter database was used to evaluate the prognostic significance of FNDC1 expression in patients with GC. Moreover, a tissue microarray (TMA) was used to examine the expression level of FNDC1 protein in 90 GC cases, and its prognostic value was further investigated using Kaplan-Meier and Cox survival analyses.
Materials and Methods
Bioinformatic mining methods
The cancer-related public databases Oncomine and TCGA were used to predict the expression levels of FNDC1 in GC and normal gastric tissue. In the Oncomine database, we entered the gene name “FNDC1” and chose the differential gene analysis module (GC versus normal) to retrieve the results. Expression of FNDC1 between primary GC and normal gastric tissue was also reviewed using the GEPIA browser (http://gepia.cancer-pku.cn/), which is an online tool for the analysis of data provided by TCGA and the GTEx projects[15]. The association between FNDC1 expression and overall survival (OS) was analyzed by data mining in the Kaplan-Meier plotter database (http://kmplot.com), which is an online database that enables validation of survival-associated GC biomarkers using transcriptomic data from 1065 patients[16]. The median FNDC1 expression was used as the cutoff. Hazard ratios with 95% confidence intervals and log-rank P values were calculated.
KEGG pathway analysis using the cBioPortal database
The genes co-expressed with FNDC1 in GC (absolute Pearson's r ≥ 0.5) were identified using the cBioPortal database (http://www.cbioportal.org/). Then, the co-expressed genes were loaded into ClueGo in Cytoscape for analysis of Kyoto Encyclopedia of Genes and Genomes (KEGG) pathways[17]. Only pathways with P values ≤ 0.05 were included.
Table 1
Relationship between FNDC1 levels and clinicopathological parameters of GC patients.
| Clinicopathological parameters | Cases(N) | FNDC1 expression level | χ2 | P value | |
|---|---|---|---|---|---|
| Low | High | ||||
| Age at surgery (years) | |||||
| <60 | 27 | 9 | 18 | ||
| ≥60 | 63 | 16 | 47 | 0.593 | 0.441 |
| Gender | |||||
| Female | 22 | 10 | 12 | ||
| Male | 68 | 15 | 53 | 4.535 | 0.033 |
| Tumor location | |||||
| Antrum | 38 | 11 | 27 | ||
| Other sites | 52 | 14 | 38 | 0.045 | 0.832 |
| Tumor size (cm) | |||||
| <5 | 36 | 13 | 23 | ||
| ≥5 | 53 | 12 | 41 | 1.926 | 0.165 |
| Histological differentiation | |||||
| Well | 29 | 8 | 21 | ||
| Moderate/poor | 61 | 17 | 44 | 0.001 | 0.978 |
| Neural/vascular invasion | |||||
| No | 72 | 19 | 53 | ||
| Yes | 18 | 6 | 12 | 0.346 | 0.556 |
| Lymph node metastasis (n) | |||||
| <3 | 38 | 14 | 24 | ||
| ≥3 | 52 | 11 | 41 | 2.694 | 0.101 |
| TNM stage | |||||
| I-II | 36 | 16 | 20 | ||
| III-IV | 54 | 9 | 45 | 8.308 | 0.004 |
GC tissue and patient clinical information
A human TMA (cat no. HStmA180Su09) containing paired tumor and normal tissue samples from 90 cases was purchased from Shanghai Outdo Biotech Co., Ltd. (Shanghai, China). Detailed clinical characteristics, including patient age and sex, tumor size, histologic differentiation, and TNM stage, are shown in Table 1. All patients with GC received radical surgery between December 2009 and June 2010, with ultimate follow-up through June 2016. Patients who underwent chemotherapy or radiotherapy before the surgery were excluded from the study.
Immunohistochemistry and interpretation of the results
Immunohistochemical staining was performed according to the manufacturer's protocol to examine the expression levels of FNDC1 in GC and matched normal tissue. An FNDC1 rabbit polyclonal antibody was purchased from Absin Corporation (abs127634a; Absin, China) and used at a dilution of 1:500. Two pathologists independently evaluated immunostaining of each tissue section in a double-blind manner. The immunoreactive score (IRS) for each slice was calculated by multiplying the staining intensity in four gradations (0, negative; 1, weak; 2, moderate; 3, strong) with the percentage of positive cells in five gradations (0, negative; 1, < 10%; 2, 10%-50%; 3, 51%-80%; 4, > 80%), each specimen was measured in three different magnification fields[18]. IRS ranged from 0 to 12, with IRS > 4 indicating high FNDC1 expression and IRS ≤ 4 indicating low FNDC1 expression.
Figure 1
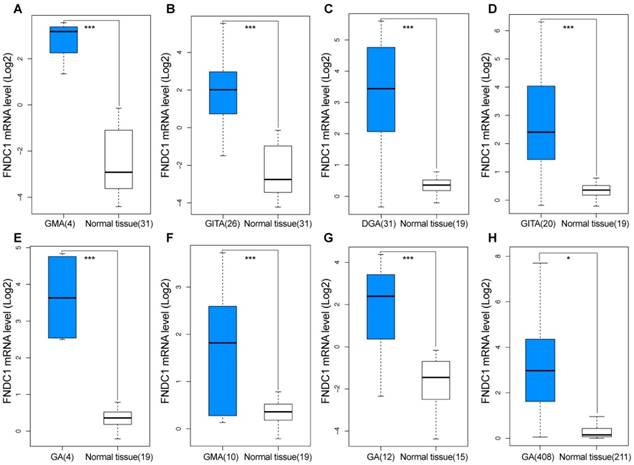
Overexpression of FNDC1 in gastric cancer predicted using GEO and TCGA data. FNDC1 mRNA levels of GC versus normal gastric tissue in (A, B) DErrico Gastric (GEO: GSE13911), (C-F) Cho Gastric (GEO: GSE13861), (G) Wang Gastric (GEO: GSE19826), and (H) TCGA and GTEx databases. *P < 0.05, **P < 0.01, ***P < 0.001. DGA, diffuse gastric adenocarcinoma; GMA, gastric mixed adenocarcinoma; GITA, gastric intestinal type adenocarcinoma; GA, gastric adenocarcinoma.
Statistical analysis
The SPSS 24.0 software (SPSS, Inc., Chicago, IL, USA) was used to analyze the experimental data. Quantitative data were presented as means ± standard deviations. The differential expression levels of FNDC1 mRNA between the GC group and the normal tissue group from TCGA and Oncomine databases were analyzed using the independent-samples t test. The chi-squared test was performed to analyze the relationship between FNDC1 expression level and clinicopathological parameters. IRS scores of FNDC1 staining in tumor and adjacent non-tumor gastric tissues were compared by Wilcoxon rank-sum test. Kaplan-Meier survival analyses were performed using the log-rank test, and a Cox regression model was established for a multivariate survival analysis to determine prognostic factors using variables that were significant in the univariate analysis. P values < 0.05 were considered to indicate statistical significance.
Results
Overexpression of FNDC1 mRNA and protein levels in GC
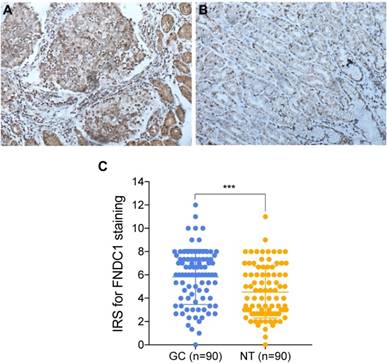
TCGA and Oncomine database data were used to examine the differential expression levels of FNDC1 mRNA between GC and normal gastric tissue. The FNDC1 mRNA expression level was dramatically higher in GC tissue than in normal gastric tissue (all P < 0.05, Figure 1A-H). To confirm the predictive results, immunohistochemical assays were performed to examine FNDC1 protein levels in 90 cases of GC with paired adjacent tissue (Figure 2A, B). The mean ± standard deviation IRS scores of FNDC1 in cancerous tissue and adjacent normal tissue were 5.822 ± 2.368 and 4.526 ± 2.219, respectively. The IRS scores of FNDC1 in tumors were much higher than those in adjacent non-tumor gastric tissues (P < 0.001; Figure 2C and Supplementary Table S1-S2), indicating that the expression level of FNDC1 protein was significantly higher in GC tissues than in paired normal tissues.
Relationships between FNDC1 and clinicopathological parameters of patients with GC
Relationships between FNDC1 protein expression and clinicopathological parameters of patients with GC (age, sex, tumor site, tumor size, histological grade, neural/vascular invasion, lymph node metastasis, and TNM stage) were investigated. The differential expression level of FNDC1 protein (low versus high) was associated significantly with sex and TNM stage in patients with GC (all P < 0.05; Table 1).
Figure 2
FNDC1 immunoreactivity was higher in gastric cancer tissues than in adjacent normal tissues. (A) Representative high expression of FNDC1 in GC tissue (HE, 200 ); (B) Representative low expression of FNDC1 in matched adjacent normal tissue (HE, 200
 ). (C) The IRS in tumor tissues were statistically higher than that in adjacent normal tissues. ***P < 0.001. IRS, immunoreactive score; GC, gastric cancer; NT, normal tissue; HE, hematoxylin and eosin.
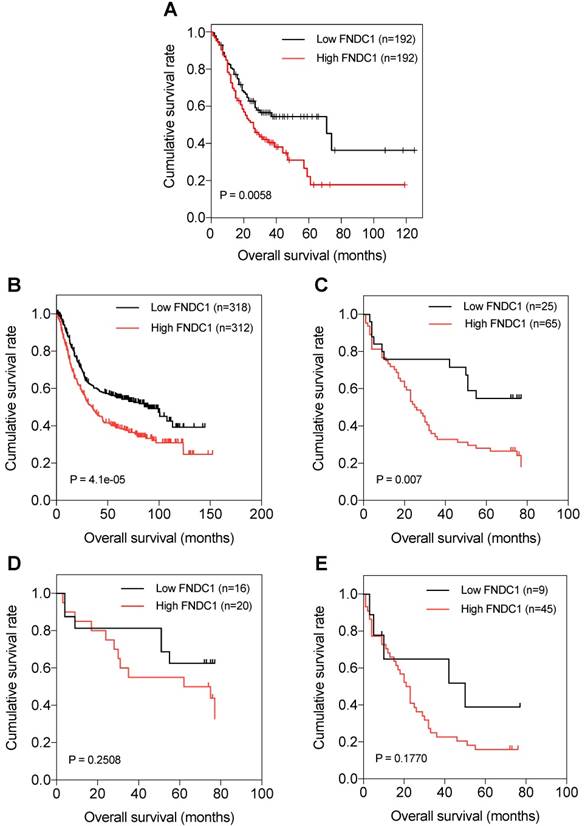
Figure 3
Kaplan-Meier curves of OS of patients with gastric adenocarcinoma based on FNDC1 mRNA and protein expression (low versus high). (A) Relationship between FNDC1 mRNA expression level and OS of patients with GC based on TCGA data. (B) Relationship between FNDC1 mRNA expression level and OS of patients with GC based on GEO data (GSE22377, GSE14210, GSE51105). (C) Relationship between FNDC1 protein expression level and OS of patients with GC based on immunohistochemical staining. (D) Relationship between FNDC1 protein expression level and OS of GC stage I-II. (E) Relationship between FNDC1 protein expression level and OS of GC stage III-IV. OS, overall survival; GC, gastric cancer.
High FNDC1 expression is associated with poor OS of patients with GC
The prognostic significance of FNDC1 expression levels in patients with GC was investigated. Through data mining in TCGA database and the Kaplan-Meier plotter, we found that OS was significantly lower among patients with GC with high expression of FNDC1 mRNA than among those with low expression, using the median as the cutoff value (all P < 0.01; Figure 3A, B). As FNDC1 is a protein-coding gene, to confirm the predictive results, we also analyzed the immunohistochemical staining results and found that OS was significantly lower among patients with GC with high expression of FNDC1 protein than among those with low expression (P = 0.007; Figure 3C). As shown in Table 1, the differential expression level of FNDC1 protein (low versus high) was significantly associated with TNM stage, so we further investigated the relationship between FNDC1 protein expression level and OS of GC patients stratified by clinical stage, but found no statistical significance (P = 0.2508 for stage I-II, Figure 3D; P = 0.1770 for stage III-IV, Figure 3E). In addition, a Cox univariate survival analysis revealed that FNDC1 expression, tumor location, tumor size, lymph node metastasis, and TNM stage were significant parameters affecting the survival time of patients with GC (Table 2). These five significant factors were subsequently substituted into the multivariate Cox survival analysis, which indicated that high FNDC1 expression level and large tumor size were independent predictors of unfavorable prognosis in patients with GC (all P < 0.05; Table 3).
Table 2
Cox univariate survival analysis of FNDC1 and other clinicopathological parameters in GC patients.
| Clinicopathological parameters | Mean survival time (months) | 95% CI | P value |
|---|---|---|---|
| FNDC1 expression | |||
| Low | 54.053 | 42.469-65.636 | 0.006 |
| High | 34.522 | 27.582-41.461 | |
| Age (years) | |||
| <60 | 49.119 | 37.251-60.986 | 0.081 |
| ≥60 | 35.719 | 28.607-42.831 | |
| Gender | |||
| Female | 42.182 | 28.761-55.603 | 0.521 |
| Male | 38.984 | 31.985-45.983 | |
| Tumor location | |||
| Antrum | 46.184 | 35.984-56.384 | 0.043 |
| Other sites | 34.978 | 27.396-42.561 | |
| Tumor size (cm) | |||
| <5 | 54.435 | 44.577-64.294 | 0.000 |
| ≥5 | 28.918 | 22.085-35.751 | |
| Lymph node metastasis (n) | |||
| <3 | 51.588 | 41.985-61.190 | 0.002 |
| ≥3 | 30.963 | 23.591-38.335 | |
| Neural/vascular invasion | |||
| No | 41.345 | 34.489-48.202 | 0.517 |
| Yes | 33.374 | 18.867-47.881 | |
| Histological differentiation | |||
| Well | 48.069 | 37.481-58.657 | 0.133 |
| Moderate/poor | 35.780 | 28.274-43.286 | |
| TNM stage | |||
| I-II | 54.287 | 44.729-63.845 | 0.000 |
| III-IV | 29.908 | 22.781-37.036 |
Table 3
Cox multivariate analysis of FNDC1 and other clinicopathological parameters in GC patients.
| Covariates | HR | 95% CI for HR | P value |
|---|---|---|---|
| FNDC1 expression level (low vs. high) | 2.143 | 1.069-4.297 | 0.032 |
| Tumor location (antrum vs. other sites) | 1.452 | 0.841-2.508 | 0.181 |
| Tumor size (<5 vs. ≥5 cm) | 2.259 | 1.129-4.522 | 0.021 |
| Lymph node metastasis (<3 vs. ≥3) | 1.212 | 0.515-2.853 | 0.660 |
| TNM stage (I-II vs. III-IV) | 1.232 | 0.492-3.086 | 0.656 |
KEGG pathway analysis of FNDC1 and its co-expressed genes in TCGA-STAD
Data mining using cBioPortal for TCGA was used to identify 1212 genes significantly co-expressed with FNDC1. A total of 265 genes were selected by setting absolute Pearson's r ≥ 0.5 as a threshold. Then, the genes were subjected to enrichment analysis with the KEGG pathways; we found that the genes were enriched in the following: steroid hormone biosynthesis, malaria, proteoglycans in cancer, Wnt signaling pathway, protein digestion and absorption, hedgehog signaling pathway, hippo signaling pathway, basal cell carcinoma, PI3K-Akt signaling pathway, focal adhesion, ECM-receptor interaction, relaxin signaling pathway, AGE-RAGE signaling pathway in diabetic complications, amoebiasis, human papillomavirus infection, and small cell lung cancer (Figure 4A-C; Table 4). The most significant pathway was ECM-receptor interaction (P = 3.93E-12; Table 4).
Figure 4
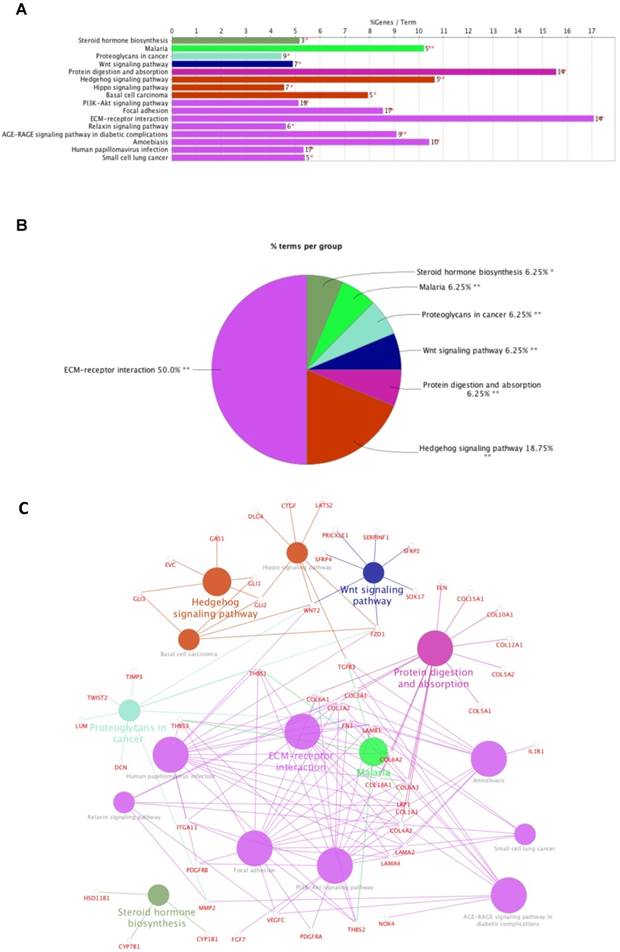
Enrichment of FNDC1 and its co-expressed genes in KEGG pathways. (A) Bar chart and (B) pie chart of the enrichment of FNDC1 and its co-expressed genes in KEGG pathways. (C) The network of FNDC1 and its co-expressed genes in KEGG pathways.
Table 4
KEGG pathway analysis of FNDC1 and its co-expressed genes in TCGA-STAD.
| GOID | GOTerm | Term PValue | Group PValue | % Associated Genes | Nr. Genes | Associated Genes Found |
|---|---|---|---|---|---|---|
| 00140 | Steroid hormone biosynthesis | 4.62E-02 | 4.62E-02 | 5.17 | 3.00 | [CYP1B1, CYP7B1, HSD11B1] |
| 05144 | Malaria | 5.46E-04 | 5.46E-04 | 10.20 | 5.00 | [LRP1, TGFB3, THBS1, THBS2, THBS3] |
| 05205 | Proteoglycans in cancer | 1.94E-03 | 1.94E-03 | 4.43 | 9.00 | [DCN, FN1, FZD1, LUM, MMP2, THBS1, TIMP3, TWIST2, WNT2] |
| 04310 | Wnt signaling pathway | 3.60E-03 | 3.60E-03 | 4.90 | 7.00 | [FZD1, PRICKLE1, SERPINF1, SFRP2, SFRP4, SOX17, WNT2] |
| 04974 | Protein digestion and absorption | 1.47E-11 | 1.47E-11 | 15.56 | 14.00 | [COL10A1, COL12A1, COL15A1, COL18A1, COL1A1, COL1A2, COL3A1, COL4A2, COL5A1, COL5A2, COL6A1, COL6A2, COL6A3, ELN] |
| 04340 | Hedgehog signaling pathway | 4.49E-04 | 9.75E-05 | 10.64 | 5.00 | [EVC, GAS1, GLI1, GLI2, GLI3] |
| 04390 | Hippo signaling pathway | 5.40E-03 | 9.75E-05 | 4.55 | 7.00 | [CTGF, DLG4, FZD1, GLI2, LATS2, TGFB3, WNT2] |
| 05217 | Basal cell carcinoma | 1.73E-03 | 9.75E-05 | 7.94 | 5.00 | [FZD1, GLI1, GLI2, GLI3, WNT2] |
| 04151 | PI3K-Akt signaling pathway | 1.21E-06 | 4.05E-05 | 5.13 | 18.00 | [COL1A1, COL1A2, COL4A2, COL6A1, COL6A2, COL6A3, FGF7, FN1, ITGA11, LAMA2, LAMA4, LAMB1, PDGFRA, PDGFRB, THBS1, THBS2, THBS3, VEGFC] |
| 04510 | Focal adhesion | 1.42E-09 | 4.05E-05 | 8.54 | 17.00 | [COL1A1, COL1A2, COL4A2, COL6A1, COL6A2, COL6A3, FN1, ITGA11, LAMA2, LAMA4, LAMB1, PDGFRA, PDGFRB, THBS1, THBS2, THBS3, VEGFC] |
| 04512 | ECM-receptor interaction | 3.93E-12 | 4.05E-05 | 17.07 | 14.00 | [COL1A1, COL1A2, COL4A2, COL6A1, COL6A2, COL6A3, FN1, ITGA11, LAMA2, LAMA4, LAMB1, THBS1, THBS2, THBS3] |
| 04926 | Relaxin signaling pathway | 9.17E-03 | 4.05E-05 | 4.62 | 6.00 | [COL1A1, COL1A2, COL3A1, COL4A2, MMP2, VEGFC] |
| 04933 | AGE-RAGE signaling pathway in diabetic complications | 8.17E-06 | 4.05E-05 | 9.09 | 9.00 | [COL1A1, COL1A2, COL3A1, COL4A2, FN1, MMP2, NOX4, TGFB3, VEGFC] |
| 05146 | Amoebiasis | 7.05E-07 | 4.05E-05 | 10.42 | 10.00 | [COL1A1, COL1A2, COL3A1, COL4A2, FN1, IL1R1, LAMA2, LAMA4, LAMB1, TGFB3] |
| 05165 | Human papillomavirus infection | 1.47E-06 | 4.05E-05 | 5.33 | 17.00 | [COL1A1, COL1A2, COL4A2, COL6A1, COL6A2, COL6A3, FN1, FZD1, ITGA11, LAMA2, LAMA4, LAMB1, PDGFRB, THBS1, THBS2, THBS3, WNT2] |
| 05222 | Small cell lung cancer | 9.22E-03 | 4.05E-05 | 5.38 | 5.00 | [COL4A2, FN1, LAMA2, LAMA4, LAMB1] |
Discussion
The FNDC1 gene is located in the 6q25.3 human chromosomal region, and was first identified as a differentially expressed mRNA from human dermal fibroblasts. The biological function of FNDC1 has yet to be well defined, and the majority of studies concerning FNDC1 have shown it may play an important role in inflammation. The minor (T) allele of SNP rs2392989 was reported to confer a higher risk of acute otitis media and to be correlated with higher expression of FNDC1[6]. In addition, FNDC1 expression in the mouse middle ear was upregulated upon lipopolysaccharide treatment, which is known to be a potent inducer of inflammation through stimulation of transforming growth factor- , tumor necrosis factor-
 , and interleukin-1 signaling[19]. To date, the only functional study of FNDC1 in human cancer was reported by Das and colleagues[5]. They discovered that miR-1207-3p was significantly under-expressed in prostate cancer (PCa) cell lines in comparison with normal prostate epithelial cells, and that increased expression of microRNA-1207-3p significantly inhibited proliferation and migration, and induced apoptosis of PCa cells via direct targeting of FNDC1. They also revealed significant overexpression of FNDC1, fibronectin (FN1), and the androgen receptor in human PCa cell lines and tissue, which was correlated positively with aggressive PCa. However, the expression level of FNDC1 and its potential clinical significance in GC have not been well defined.
In the current study, we first used bioinformatics to predict the high expression of FNDC1 in gastric adenocarcinoma tissue compared with normal gastric tissue using the Oncomine and TCGA public databases. Then, immunohistochemistry was used to verify that FNDC1 protein expression levels were significantly higher in the GC tissue group compared with the normal tissue group. These results were consistent with those of bioinformatic predictions and suggested that FNDC1 acts as an oncogene by promoting the development of gastric adenocarcinoma. Subsequently, the clinical prognostic significance of FNDC1 gene expression levels in patients with GC was examined. First, differential expression levels of FNDC1 protein were associated significantly with sex and TNM stage in patients with GC. Moreover, a Kaplan-Meier univariate survival analysis showed that, compared with those with low FNDC1 mRNA and protein expression levels, patients with GC with high FNDC1 expression levels had remarkably shorter OS. A multivariate Cox analysis showed that high expression of FNDC1 and advanced TNM stage were independent predictors of unfavorable prognosis in patients with GC. Our results also showed that the genes co-expressed with FNDC1 in GC were most enriched in ECM-receptor interactions. It is well known that the complex interactions between tumor cells and the ECM may play important roles in tumor metastasis, including cell differentiation, migration, cytoskeletal reorganization, and morphological transition[20, 21]. According to previous reports[22, 23], FN is considered a key element in ECM components and plays an important role in cancer cell proliferation, differentiation, and migration. As FNDC1 contains the conserved fibronectin type III domain of FN, we inferred that FNDC1 may play an important role in human cancer tumorigenesis. All of these findings indicate that FNDC1 was over-expressed in GC tissue and that high levels of FNDC1 expression could indicate poor prognosis for patients with GC. Thus, this gene may be a key target involved in the growth and metastasis of GC.
However, this study is not without limitations. First, the cases used were collected non-sequentially, which may have resulted in selection bias and influenced the final statistical results. Next, tissue from only 90 cases was used in this study, which was a small sample. In addition, some clinicopathological data associated with GC, such as disease-free survival, were not included. Lastly, although KEGG pathway analysis indicated that the genes co-expressed with FNDC1 were enriched in ECM-receptor interactions, the detailed underlying molecular mechanisms have not been determined. The above limitations should be addressed in future studies.
Conclusions
In conclusion, our study revealed that FNDC1 was highly expressed in GC, and overexpression of FNDC1 was an independent predictor of reduced prognosis in patients with GC. FNDC1 co-expressed genes are largely enriched in ECM-receptor interactions, which are related to tumor metastasis. FNDC1 may be a potential prognostic biomarker and therapeutic target for GC in the future.
Supplementary Material
Supplementary tables.
Acknowledgements
We greatly appreciate the technological help from the department of pathology (Shanghai Fifth People's Hospital, Fudan University, Shanghai, China) for the IHC staining and data analysis. We also sincerely thank Dr. Jun Hou (Department of Pathology, Zhongshan Hospital, Fudan University, Shanghai, China) for his kind help in pathology.
Funding Statement
This work was supported by Shanghai Fifth People's Hospital (Institutional Grant for Newly Imported Talents 2016WYRC01); Shanghai Minhang District Health and Family Planning Commission (Research Fund 2016MW03); Shanghai Minhang District Science and Technology Commission (Natural Science Fund 2017MHZ02); Key Medical Specialty funded by The Fifth People's Hospital of Shanghai, Fudan University (NO. 2017WYZDZK01); and Great Discipline Construction Project from the Medical System of Shanghai Minhang District. (NO. 2017MWDXK01).
Competing Interests
The authors have declared that no competing interest exists.
References
1. Siegel RL, Miller KD, Jemal A. Cancer statistics, 2015. CA Cancer J Clin. 2015;65:5-29
2. Chen W, Zheng R, Baade PD, Zhang S, Zeng H, Bray F. et al. Cancer statistics in China, 2015. CA Cancer J Clin. 2016;66:115-32
3. Karimi P, Islami F, Anandasabapathy S, Freedman ND, Kamangar F. Gastric cancer: descriptive epidemiology, risk factors, screening, and prevention. Cancer epidemiology, biomarkers & prevention: a publication of the American Association for Cancer Research, cosponsored by the American Society of Preventive Oncology. 2014;23:700-13
4. Chon SH, Berlth F, Plum PS, Herbold T, Alakus H, Kleinert R. et al. Gastric cancer treatment in the world: Germany. Translational gastroenterology and hepatology. 2017;2:53
5. Das DK, Naidoo M, Ilboudo A, Park JY, Ali T, Krampis K. et al. miR-1207-3p regulates the androgen receptor in prostate cancer via FNDC1/fibronectin. Experimental cell research. 2016;348:190-200
6. van Ingen G, Li J, Goedegebure A, Pandey R, Li YR, March ME. et al. Genome-wide association study for acute otitis media in children identifies FNDC1 as disease contributing gene. Nature communications. 2016;7:12792
7. Pankov R, Yamada KM. Fibronectin at a glance. Journal of cell science. 2002;115:3861-3
8. Waalkes S, Atschekzei F, Kramer MW, Hennenlotter J, Vetter G, Becker JU. et al. Fibronectin 1 mRNA expression correlates with advanced disease in renal cancer. BMC cancer. 2010;10:503
9. Jia D, Yan M, Wang X, Hao X, Liang L, Liu L. et al. Development of a highly metastatic model that reveals a crucial role of fibronectin in lung cancer cell migration and invasion. BMC cancer. 2010;10:364
10. Gao M, Craig D, Lequin O, Campbell ID, Vogel V, Schulten K. Structure and functional significance of mechanically unfolded fibronectin type III1 intermediates. Proceedings of the National Academy of Sciences of the United States of America. 2003;100:14784-9
11. Cao Y, Liu X, Lu W, Chen Y, Wu X, Li M. et al. Fibronectin promotes cell proliferation and invasion through mTOR signaling pathway activation in gallbladder cancer. Cancer letters. 2015;360:141-50
12. Fernandez-Garcia B, Eiro N, Marin L, Gonzalez-Reyes S, Gonzalez LO, Lamelas ML. et al. Expression and prognostic significance of fibronectin and matrix metalloproteases in breast cancer metastasis. Histopathology. 2014;64:512-22
13. Sato M, Jiao Q, Honda T, Kurotani R, Toyota E, Okumura S. et al. Activator of G protein signaling 8 (AGS8) is required for hypoxia-induced apoptosis of cardiomyocytes: role of G betagamma and connexin 43 (CX43). The Journal of biological chemistry. 2009;284:31431-40
14. Sato M, Cismowski MJ, Toyota E, Smrcka AV, Lucchesi PA, Chilian WM. et al. Identification of a receptor-independent activator of G protein signaling (AGS8) in ischemic heart and its interaction with Gbetagamma. Proceedings of the National Academy of Sciences of the United States of America. 2006;103:797-802
15. Tang Z, Li C, Kang B, Gao G, Li C, Zhang Z. GEPIA: a web server for cancer and normal gene expression profiling and interactive analyses. Nucleic acids research. 2017;45:W98-w102
16. Szasz AM, Lanczky A, Nagy A, Forster S, Hark K, Green JE. et al. Cross-validation of survival associated biomarkers in gastric cancer using transcriptomic data of 1,065 patients. Oncotarget. 2016;7:49322-33
17. Bindea G, Galon J, Mlecnik B. CluePedia Cytoscape plugin: pathway insights using integrated experimental and in silico data. Bioinformatics (Oxford, England). 2013;29:661-3
18. Specht E, Kaemmerer D, Sanger J, Wirtz RM, Schulz S, Lupp A. Comparison of immunoreactive score, HER2/neu score and H score for the immunohistochemical evaluation of somatostatin receptors in bronchopulmonary neuroendocrine neoplasms. Histopathology. 2015;67:368-77
19. Chen Y, Kam CS, Liu FQ, Liu Y, Lui VC, Lamb JR. et al. LPS-induced up-regulation of TGF-beta receptor 1 is associated with TNF-alpha expression in human monocyte-derived macrophages. Journal of leukocyte biology. 2008;83:1165-73
20. Gilkes DM, Semenza GL, Wirtz D. Hypoxia and the extracellular matrix: drivers of tumour metastasis. Nature reviews Cancer. 2014;14:430-9
21. Bonnans C, Chou J, Werb Z. Remodelling the extracellular matrix in development and disease. Nature reviews Molecular cell biology. 2014;15:786-801
22. McKenzie AJ, Hicks SR, Svec KV, Naughton H, Edmunds ZL, Howe AK. The mechanical microenvironment regulates ovarian cancer cell morphology, migration, and spheroid disaggregation. Scientific reports. 2018;8:7228
23. Jeong J, Keum S, Kim D, You E, Ko P, Lee J. et al. Spindle pole body component 25 homolog expressed by ECM stiffening is required for lung cancer cell proliferation. Biochemical and biophysical research communications. 2018;500:937-43
Author contact
![]() Corresponding author: Dr. Chongwei Ke, Department of General Surgery, Affiliated Shanghai Fifth People's Hospital, Fudan University, 801 Heqing Road, Shanghai, 200240, P. R. China. Tel: (86) 021-64308151; Fax: (86) 021-64308151; E-mail: dr_kecwcom
Corresponding author: Dr. Chongwei Ke, Department of General Surgery, Affiliated Shanghai Fifth People's Hospital, Fudan University, 801 Heqing Road, Shanghai, 200240, P. R. China. Tel: (86) 021-64308151; Fax: (86) 021-64308151; E-mail: dr_kecwcom
Citation styles
APA
Ren, J., Niu, G., Wang, X., Song, T., Hu, Z., Ke, C. (2018). Overexpression of FNDC1 in Gastric Cancer and its Prognostic Significance. Journal of Cancer, 9(24), 4586-4595. https://doi.org/10.7150/jca.27672.
ACS
Ren, J.; Niu, G.; Wang, X.; Song, T.; Hu, Z.; Ke, C. Overexpression of FNDC1 in Gastric Cancer and its Prognostic Significance. J. Cancer 2018, 9 (24), 4586-4595. DOI: 10.7150/jca.27672.
NLM
Ren J, Niu G, Wang X, Song T, Hu Z, Ke C. Overexpression of FNDC1 in Gastric Cancer and its Prognostic Significance. J Cancer 2018; 9(24):4586-4595. doi:10.7150/jca.27672. https://www.jcancer.org/v09p4586.htm
CSE
Ren J, Niu G, Wang X, Song T, Hu Z, Ke C. 2018. Overexpression of FNDC1 in Gastric Cancer and its Prognostic Significance. J Cancer. 9(24):4586-4595.
This is an open access article distributed under the terms of the Creative Commons Attribution (CC BY-NC) license (https://creativecommons.org/licenses/by-nc/4.0/). See http://ivyspring.com/terms for full terms and conditions.