Journal of Cancer
ISSN: 1837-9664
3.2
Impact Factor
ISSN: 1837-9664

 Global reach, higher impact
J Cancer 2018; 9(23):4382-4390. doi:10.7150/jca.27344 This issue Cite
Research Paper
A Nomogram Based on a TRUS Five-Grade Scoring System for the Prediction of Prostate Cancer and High Grade Prostate Cancer at Initial TRUS-Guided Biopsy
Shao Wei Xie1*, Yan Qing Wang2*, Bai Jun Dong2, Jian Guo Xia1, Hong Li Li1, Shi Jun Zhang1, Feng Hua Li1 ![]() , Wei Xue2
, Wei Xue2 ![]()
1. Department of Ultrasound, Renji Hospital, School of Medicine, Shanghai Jiao Tong University, Shanghai, China;
2. Department of Urology, Renji Hospital, School of Medicine, Shanghai Jiao Tong University, Shanghai, China.
*The first two authors contributed equally to the manuscript.
Received 2018-5-18; Accepted 2018-8-17; Published 2018-10-22
Citation:
Xie SW, Wang YQ, Dong BJ, Xia JG, Li HL, Zhang SJ, Li FH, Xue W. A Nomogram Based on a TRUS Five-Grade Scoring System for the Prediction of Prostate Cancer and High Grade Prostate Cancer at Initial TRUS-Guided Biopsy. J Cancer 2018; 9(23):4382-4390. doi:10.7150/jca.27344. https://www.jcancer.org/v09p4382.htm
Other stylesAbstract
Purpose: To evaluate the efficacy of transrectal ultrasound five-grade scoring system (TRUS-5) in predicting prostate cancer (PCa) and high grade PCa (HGPCa), compared with TRUS two-grade scoring system (TRUS-2), and establish a TRUS-5 based nomogram for the prediction of PCa and HGPCa at initial biopsy (IPBx).
Methods: Data were collected from 862 men who underwent initial TRUS-guided 12-core prostate biopsy. Age, prostate-specific antigen (PSA), percent free PSA, digital rectal examination (DRE), prostate volume (PV), PSA density (PSAD) and TRUS findings were included in the analysis. For TRUS-5, the probability of PCa was quantified on a scale from 1 (benign) to 5 (malignant). TRUS-2 used the grades “normal” and “suspicious”. After univariate and multivariate logistic regression analyses, nomogram models were developed and internally validated based on independent predictors to predict the probability of PCa and HGPCa.
Results: Overall PCa was detected in 42% (362/862) with 26.22% (226/862) showing HGPCa. TRUS-5 significantly outperformed TRUS-2 for the risk prediction of PCa and HGPCa (area under the receiver operating characteristic curve [AUC]: 0.787 vs. 0.694 for PCa, 0.841 vs. 0.713 for HGPCa, P<0.05). The TRUS-5 based nomogram showed higher AUCs (0.905 for PCa, 0.903 for HGPCa) than PSA alone, clinical base model, the TRUS-2 based model, and other predictive models (P<0.05).
Conclusions: TRUS-5 represents a better imaging predictor than TRUS-2 for PCa and HGPCa. Our TRUS-5 based nomogram models performed well for the prediction of PCa and HGPCa at IPBx, which may help to make the decision to biopsy.
Keywords: prostate cancer, biopsy, ultraonography, nomograms
Introduction
Prostate cancer (PCa) has become one of the most common solid malignancies in men in western countries [1]. In recent years, the number of men diagnosed with PCa has been increasing in Asian countries. PCa is diagnosed by pathological examination of tissue collected usually through an ultrasound-guided biopsy. Various biopsy-related complications may occur, including pain, hematuria, rectal bleeding, acute urinary retention, urinary tract infection, etc. [2-4]. It has been reported that 1% of patients suffer sepsis or severe hemorrhage and 5% develop urinary tract infections following prostate biopsy, serious problems that can increase health care costs[5-6]. Furthermore, the wide use of prostate biopsy has increased the detection of low-risk PCa, which exerts little influence on survival or quality of life but lead to unnecessary and excessive examination or treatment [7-8]. Thus, the decisions to perform biopsy must be carefully made to reduce unnecessary biopsies.
Traditionally, the decision to biopsy is based on clinical, laboratory and imaging parameters, including serum prostate-specific antigen (PSA) levels, digital rectal examination (DRE) and imaging findings (e.g. prostate volume [PV], PSA density [PSAD], or suspicious lesions), separately or in different combinations. However, these are not accurate enough to predict the biopsy results. Therefore, to improve risk prediction and to reduce unnecessary biopsies without delaying diagnosis and treatment of significant PCa, different predictive models such as nomograms have been developed. In general, these predictive nomograms have been shown to perform as well as or even exceed the experienced clinical experts [9]. The prebiopsy nomograms were often established comprising several predictors: family history, age, PSA and its derivatives, PV, DRE, transrectal ultrasound (TRUS) findings, and novel biomarkers such as prostate cancer antigen 3(PCA3) [10-16]. Currently abnormal imaging finding on TRUS is a predictor for PCa at initial biopsy (IPBx) [10, 12-16]. However, TRUS findings in these studies were classified as “normal” or “suspicious” and the results are mixed [10, 12-16]. This may relate to radiologist dependence, variability in imaging descriptions and reports, and insufficient interdisciplinary communications. Likert-like five-grade scoring systems may improve the clinical management of TRUS for PCa prediction [17]. To our knowledge, there is no nomogram to evaluate the risk of PCa using a TRUS five-grade scoring system (TRUS-5). For this purpose, this study was to evaluate the efficacy of TRUS-5 in predicting PCa and high grade PCa (HGPCa), compared with a TRUS two-grade scoring system (TRUS-2), with the goal of establishing the TRUS-5 based nomogram for the prediction of PCa and HGPCa in a real world population undergoing IPBx.
Materials and methods
Study population
This study was approved by the Ethics Committee of our hospital and written informed consents were obtained from all patients. In the period from Nov 2015 to Feb 2017, 955 consecutive patients who underwent initial TRUS-guided 12-core prostate biopsies at our hospital were enrolled. Inclusion criteria were: PSA>10 ng/ml or PSA 4-10 ng/ml with a percent free PSA <16% or PSAD > 0.15 ng/ml2, and/or suspicious findings on DRE, and/or abnormal TRUS findings. A total of 93 patients were excluded: 45 patients with a PSA level >100 ng/ml, and 48 patients with incomplete information for nomogram calculation. Therefore, the final analysis examined 862 patients.
Clinical variable evaluation
Age, PSA, percent free PSA, DRE findings, PV, PSAD and TRUS findings at diagnosis were collected as potential predictive factors. Serum PSA level and percent free PSA were done before DRE and TRUS. The DRE findings were classified as “normal” or “abnormal”, including any prostatic nodule, or induration. The PV was routinely measured during TRUS and calculated using the ellipsoid formula: volume (ml) = 0.52× transverse diameter (cm) × anteroposterior diameter (cm) × craniocaudal diameter (cm). PSAD was defined as the PSA value divided by the PV. Before biopsy, all patients underwent gray-scale and power Doppler imaging examinations. A MyLab 90 scanner (Esaote SpA, Genoa, Italy) with a 3-9-MHz EC1123 probe was used in this study. All ultrasonographic examinations were performed by an experienced investigator (S.W.X). The imaging settings were optimized for each patient.
Image analysis
All images were independently analyzed by 2 experienced investigators(J.G.X and H.L.L), blinded to clinical information; in case they did not agree on the evaluation results, the opinion of a third investigator(F.H.L) was requested, and a consensus was reached. Investigators gave their comments, using the following criteria according to our clinical experience and previous studies [17-18].
TRUS-5
Gray-scale
- Benign (homogeneous hyperechogenicity of the peripheral zone (PZ) and intermediate echogenicity of the transition zone (TZ)).
- Probably benign (minimal heterogeneity, linear or wedge-shaped hypoechogenicity in the PZ; circumscribed hypoechoic or heterogeneous encapsulated nodule[s] in the TZ).
- Indeterminate (contour asymmetry; ill-defined echotexture abnormality or non-circumscribed, rounded, moderate hypoechogenicity in the PZ; heterogeneous echogenicity with obscured margins in the TZ; includes others that do not qualify as 2, 4, or 5).
- Probably malignant (focal contour bulge; focal ill-defined borders between the PZ and TZ; circumscribed, homogenous moderate hypoechoic mass confined to the prostate [<1.5 cm in greatest dimension] with/without microcalcifications in PZ; lenticular or non-circumscribed, homogeneous, moderately hypoechoic [<1.5 cm in greatest dimension] in TZ).
- Malignant (obvious focal contour bulge or definite extraprostatic extension/ invasive behavior; diffusely ill-defined borders between the PZ and TZ; focal hypoechoic mass[es] [≥1.5 cm in greatest dimension] with/without microcalcifications in the PZ; diffuse hypoechoic in PZ with/without ill-defined borders between the PZ and TZ; lenticular or non-circumscribed, homogeneous, moderately hypoechogenic [≥1.5 cm in greatest dimension] in the TZ).
Doppler imaging
- Benign (capsular and periurethral flow only).
- Probably benign (symmetric radial flow from capsular branches).
- Indeterminate (subtle asymmetric/increased flow pattern in the PZ).
- Probably malignant (definite asymmetric/ increased flow in the PZ).
- Malignant (focal asymmetric/increased flow with disorganized pattern).
The TRUS images for each score are shown in Figures 1 and 2.
The higher score from gray-scale and Doppler imaging was considered as the final score for each patient.
TRUS-2
Abnormal TRUS findings were as follows: Gray-scale: (1) focal hypoechogenicity in the PZ; (2) diffuse hypoechogenicity in the PZ with/without ill-defined borders between the PZ and TZ; (3) focal contour bulge or definite extraprostatic extension/ invasive behavior; (4) lenticular or non-circumscribed, homogeneous, moderately hypoechogenicity in the TZ; (5) focally or diffusely ill-defined borders between the PZ and TZ. Doppler imaging: asymmetric/ increased flow in prostate.
TRUS-guided biopsy
A TRUS-guided transperineal 12-core biopsy was performed for each patient with an 18-gauge biopsy needle by 2 investigators (S.W.X and B.J.D). If there was no suspicious TRUS finding, all specimens were obtained randomly, six from each side (four sites from the PZ, one site from the TZ, one site from the anterior horn). When any suspicious findings were found on TRUS images, the specimens from the corresponding sites were taken from suspicious areas, and the remaining specimens were obtained randomly.
Pathologic Analysis
All specimens were examined by a pathologist. For specimens with PCa, the definitive Gleason score was the highest score observed from all positive specimens. HGPCa was defined as Gleason score ≥7.
Figure 1
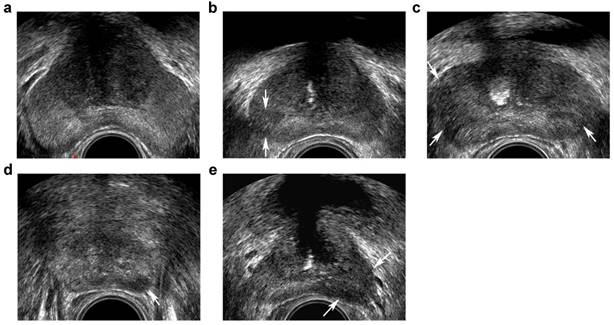
Transrectal ultrasound five-grade scoring system on gray-scale imaging. a, benign: homogeneous hyperechoic of the peripheral zone (PZ)and intermediate echoic of the transition zone (TZ); b, probably benign: minimal heterogeneity, wedge-shaped hypoechoic (arrows) in PZ; c, indeterminate: contour asymmetry, ill-defined echotexture abnormality (arrows) in PZ; d, probably malignant: circumscribed, homogenous moderate hypoechoic mass confined to prostate (<1.5 cm in greatest dimension) (arrow) in PZ; e, malignant: focal hypoechoic mass (≥1.5 cm in greatest dimension) (arrows) in PZ.
Figure 2
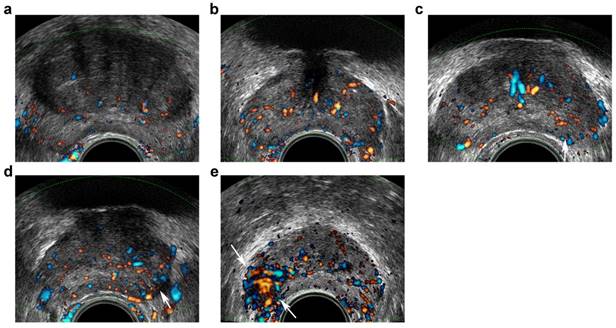
Transrectal ultrasound five-grade scoring system on Doppler imaging. a, benign: capsular and periurethral flow only; b, probably benign: symmetric radial flow from capsular branches; c, indeterminate: subtle asymmetric/increased flow pattern in peripheral zone (PZ) (arrow); d, probably malignant: c definite asymmetric/increased flow in PZ (arrow); e, malignant: focal asymmetric/increased flow with disorganized pattern (arrows).
Statistical analysis
Statistical analyses were performed using SPSS 19.0 (SPSS Inc., Chicago, IL, USA) and R version 3.3.1 (http://www.r-project.org/). All tests were two-sided. P <0.05 was considered statistically significant. A kappa value was computed to evaluate the interobserver consensus and agreement. For categorical variables, chi-squared tests were applied for the parameters reported as count with percentage, while Wilcoxon signed rank tests were applied for continuous variables, the results shown as median with interquartile ranges (IQRs). To determine which factors were independent predictors of PCa and HGPCa, univariate and stepwise multivariate logistic regression analyses were used. PSAD did not enter into the multivariate logistic regression analyses as PSAD was made up of PSA and PV. The area under the receiver operator characteristic curve (AUC) was used to quantify the accuracy estimates of every variable and predictive model for the presence of PCa and HGPCa.
The independent predictors (age, PSA, percent free PSA, DRE, PV and TRUS-5 for PCa; age, PSA, DRE, PV and TRUS-5 for HGPCa) were used to construct nomogram models to predict the probability of PCa and HGPCa. The nomograms were internally validated and predictive accuracy calculated using Harrell's concordance index on 1000 bootstrapped re-samples. Calibration plots were also generated to assess the discrimination capacity of the nomograms.
Results
Overall PCa was detected in 42% (362/862). The Gleason score was ≥7 in 226 patients (62.4%) and < 7 in 136 patients (37.6%). The median (IQR) Gleason score was 7 (6-7). The median (IQR) age was 67 (62-73) y, and the median (IQR) PSA was 10.98 (7.42-17.65) ng/ml. The rates of PCa correlated with TRUS-5 1-2/3/4/5 were 18.56 % (72/388), 38.89 % (77/198), 66.01 % (101/153) and 91.05 % (112/123), respectively. The rates of HGPCa in relation to TRUS-5 1-2/3/4/5 were 6.44 % (25/388), 16.16 % (32/198), 43.79 % (67/153), and 82.93 % (102/123), respectively. The kappa value for agreement between the two investigators was 0.762.
At univariate analysis, patient age (71 vs. 65 y, P < 0.001), PSA levels (13.43 vs. 9.75 ng/ml, P < 0.001), percent free PSA (10.13 vs. 14.6 %, P < 0.001), PV (33.58 vs. 50.81 ml, P < 0.001), PSAD (0.43 vs. 0.19 ng/ml2, P < 0.001), percentage of abnormal DRE findings (60.22% vs. 28.00%, P < 0.001), percentage of abnormal TRUS-2 (75.97% vs. 37.20%, P < 0.001), percentage of high TRUS-5 (P < 0.001) were statistically significant predictors of PCa at biopsy (Table 1). Similarly, statistically significant relationships were found between HGPCa and other patients for patient age (71 vs. 66 y, P < 0.001), PSA levels (15.95 vs. 9.93 ng/ml, P < 0.001), percent free PSA (9.52 vs. 13.93 %, P < 0.001), PV (32.30 vs. 46.63 ml, P < 0.001), PSAD (0.52 vs. 0.21 ng/ml2, P < 0.001), percentage of abnormal DRE findings (68.14% vs. 32.08%, P < 0.001), percentage of abnormal TRUS-2 (84.96% vs. 42.30%, P < 0.001), percentage of high TRUS-5 (P < 0.001) (Table 2).
Multivariate logistic regression models (includeing TRUS-2 but not TRUS-5) showed that age, PSA, percent free PSA, DRE findings, PV and TRUS-2 achieved independent predictor status for PCa and HGPCa (all P < 0.05, Table 3). While multivariate logistic regression models (including TRUS-5 but not TRUS-2) showed that age, PSA, DRE findings, PV and TRUS-5 were independent predictors for PCa and HGPCa, and percent free PSA was an independent predictor for PCa but not for HGPCa (all P < 0.05, Table 4).
ROC curve analysis for each predictors and models are presented in Table 5 and Figure 3. TRUS-5 was a better imaging predictor for PCa and HGPCa than TRUS-2 (AUC: 0.787 vs. 0.694 for PCa, 0.841 vs. 0.713 for HGPCa, P < 0.05). The AUC of TRUS-5 based model in predicting PCa was 0.905, which was higher than that of PSA alone (0.672) or clinical base model (predictive model 1) (0.883) or the TRUS-2 based model (0.888) (P < 0.05). The AUC of the TRUS-5 based model for predicting HGPCa was 0.903, which was higher than that of PSA alone (0.718) or the clinical base model (0.85) or the TRUS-2 based model (0.868) (P < 0.05).
Base on the above findings, TRUS-5-based nomograms were built using the six risk factors (age, PSA, percent free PSA, DRE findings, PV, and TRUS-5) for overall PCa (Figure 4) and five risk factors (age, PSA, DRE findings, PV and TRUS-5) for HGPCa (Figure 5). The predictive accuracy (concordance index) of TRUS-5 based nomogram models was 0.901 for PCa and 0.894 for HGPCa in the internal validation. Our nomogram models for the prediction of PCa and HGPCa showed excellent calibration (Figure 6).
Table 1
Baseline clinical and demographic characteristics at initial biopsy
| Characteristics | Total (n =862) | Negative biopsy (n =500) | Positive biopsy (n =362) | OR(95% CI) | p value |
|---|---|---|---|---|---|
| Age*, years | 67(62-73) | 65(60-69) | 71(66-76) | 1.131(1.106-1.157) | <0.001 |
| PSA*, ng/ml | 10.98(7.42-17.65) | 9.75(6.67-14.29) | 13.43(9.19-28.62) | 1.047(1.035-1.060) | <0.001 |
| percent free PSA * | 12.72(9.00-17.74) | 14.60(10.85-20.00) | 10.13(7.54-14.13) | 0.947(0.930-0.965) | <0.001 |
| PV*, ml | 41.87(30.73-58.49) | 50.81(37.35-67.96) | 33.58(26.04-44.11) | 0.957(0.948-0.965) | <0.001 |
| PSAD*, ng/ml2 | 0.25(0.15-0.45) | 0.19(0.13-0.29) | 0.43(0.26-0.78) | 39.474(19.257-80.917) | <0.001 |
| DRE, n (%) | <0.001 | ||||
| Normal | 504(58.47) | 360(72.00) | 144(39.78) | 1 | |
| Abnormal | 358(41.53) | 140(28.00) | 218(60.22) | 3.893(2.921-5.187) | |
| TRUS-2, n (%) | <0.001 | ||||
| Normal | 401(46.52) | 314(62.80) | 87(24.03) | 1 | |
| Abnormal | 461(53.48) | 186(37.20) | 275(75.97) | 5.336(3.947-7.215) | |
| TRUS-5, n (%) | |||||
| 1-2 | 388(45.01) | 316(63.20) | 72(19.89) | 1 | |
| 3 | 198(22.97) | 121(24.20) | 77(21.27) | 2.793(1.903-4.099) | <0.001 |
| 4 | 153(17.75) | 52(10.40) | 101(27.90) | 8.525(5.594-12.990) | <0.001 |
| 5 | 123(14.27) | 11(2.20) | 112(30.94) | 44.687(22.864-87.337) | <0.001 |
Abbreviations: PCa, prostate cancer; OR, odds ratio; PSA, prostate-specific antigen; PV, prostate volume; PSAD, PSA density; DRE, digital rectal examination; TRUS-2, transrectal ultrasound two-grade scoring system; TRUS-5, transrectal ultrasound five-grade scoring system. *Continuous variables are shown as the median value and interquartile range.
Table 2
Clinical and demographic characteristics of patients with no/low Grade PCa and HGPCa at initial biopsy
| Characteristics | No or Low Grade PCa (n =636) | HGPCa (n =226) | OR(95% CI) | p value |
|---|---|---|---|---|
| Age*, years | 66(61-71) | 71(66-77) | 1.099(1.074-1.124) | <0.001 |
| PSA*, ng/ml | 9.93(6.87-14.75) | 15.95(10.40-34.50) | 1.050(1.039-1.062) | <0.001 |
| percent free PSA * | 13.93(10.02-19.00) | 9.52(7.23-13.15) | 0.950(0.931-0.970) | <0.001 |
| PV*, ml | 46.63(34.25-63.44) | 32.30(25.45-41.92) | 0.963(0.953-0.972) | <0.001 |
| PSAD*, ng/ml2 | 0.21(0.14-0.33) | 0.52(0.30-1.06) | 12.339(7.548-20.173) | <0.001 |
| DRE, n (%) | <0.001 | |||
| Normal | 432(67.92) | 72(31.86) | 1 | |
| Abnormal | 204(32.08) | 154(68.14) | 4.529(3.271-6.273) | |
| TRUS-2, n (%) | <0.001 | |||
| Normal | 367(57.70) | 34(15.04) | 1 | |
| Abnormal | 269(42.30) | 192(84.96) | 7.704(5.179-11.462) | |
| TRUS-5, n (%) | ||||
| 1-2 | 363(57.08) | 25(11.06) | 1 | |
| 3 | 166(26.10) | 32(14.16) | 2.799(1.608-4.873) | <0.001 |
| 4 | 86(13.52) | 67(29.65) | 11.312(6.752-18.951) | <0.001 |
| 5 | 21(3.30) | 102(45.13) | 70.526(37.926-131.148) | <0.001 |
Abbreviations: PCa, prostate cancer; HGPCa, high-grade prostate cancer; OR, odds ratio; PSA, prostate-specific antigen; PV, prostate volume; PSAD, PSA density; DRE, digital rectal examination; TRUS-2, transrectal ultrasound two-grade scoring system; TRUS-5, transrectal ultrasound five-grade scoring system. *Continuous variables are shown as the median value and interquartile range.
Table 3
Multivariate analyses of predictors associated with PCa and HGPCa with TRUS-2 at initial biopsy
| Characteristics | Adjusted OR (95% CI) for PCa | p value | Adjusted OR (95% CI) for HGPCa | p value |
|---|---|---|---|---|
| Age | 1.161(1.127-1.196) | <0.001 | 1.082(1.053-1.111) | <0.001 |
| PSA | 1.043(1.026-1.059) | <0.001 | 1.039(1.026-1.053) | <0.001 |
| percent free PSA | 0.959(0.937-0.983) | 0.001 | 0.973(0.949-0.999) | 0.040 |
| PV | 0.951(0.940-0.961) | <0.001 | 0.967(0.955-0.978) | <0.001 |
| DRE | 2.127(1.468-3.082) | <0.001 | 2.399(1.632-3.525) | <0.001 |
| TRUS-2 | 2.235(1.529-3.269) | <0.001 | 3.438(2.201-5.371) | <0.001 |
Abbreviations: PCa, prostate cancer; HGPCa, high-grade prostate cancer; TRUS-2, transrectal ultrasound two-grade scoring system; OR, odds ratio; PSA, prostate-specific antigen; PV, prostate volume; DRE, digital rectal examination.
Table 4
Multivariate analyses of predictors associated with PCa and HGPCa with TRUS-5 at initial biopsy
| Characteristics | Adjusted OR (95% CI) for PCa | p value | Adjusted OR (95% CI) for HGPCa | p value |
|---|---|---|---|---|
| Age | 1.165(1.129-1.203) | <0.001 | 1.079(1.048-1.110) | <0.001 |
| PSA | 1.034(1.017-1.051) | <0.001 | 1.033(1.019-1.048) | <0.001 |
| percent free PSA | 0.962(0.939-0.986) | 0.002 | 0.093 | |
| PV | 0.952(0.940-0.963) | <0.001 | 0.966(0.954-0.977) | <0.001 |
| DRE | 1.593(1.073-2.366) | 0.021 | 1.682(1.099-2.574) | 0.017 |
| TRUS-5 | ||||
| 1-2 | 1 | 1 | ||
| 3 | 1.270(0.791-2.041) | 0.323 | 1.387(0.755-2.550) | 0.292 |
| 4 | 4.052(2.441-6.727) | <0.001 | 5.691(3.248-9.971) | <0.001 |
| 5 | 13.675(6.200-30.164) | <0.001 | 22.800(11.459-45.368) | <0.001 |
Abbreviations: PCa, prostate cancer; HGPCa, high-grade prostate cancer; TRUS-5, transrectal ultrasound five-grade scoring system; PSA, prostate-specific antigen; PV, prostate volume; DRE, digital rectal examination.
Discussion
In the present study, we evaluated the efficacy of TRUS-5 in predicting PCa and HGPCa, compared with TRUS-2 which is a common predictor for PCa at IPBx. The most important finding was that TRUS-5 outperformed TRUS-2 for the risk prediction of PCa and HGPCa at IPBx, which demonstrated that TRUS-5 was a better imaging predictor than TRUS-2. Furthermore, we developed nomogram models combining age, PSA, percent free PSA, DRE findings, PV, and TRUS-5, which can be easily used in clinical practice. The predictive accuracy of this nomogram was 0.901 for PCa and 0.894 for HGPCa in the internal validation.
Figure 3
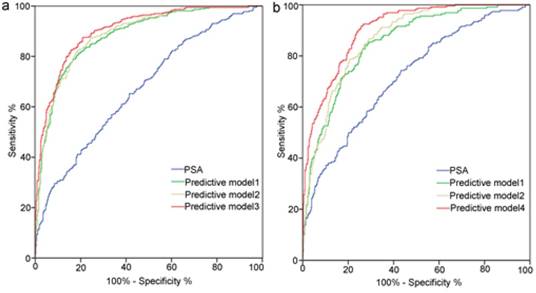
Receiver operating characteristic curves analysis for the prediction of prostate cancer (a) and high-grade prostate cancer (b) at initial biopsy. Abbreviations: Predictive model 1, age+ PSA+ percent free PSA +PV+DRE; Predictive model 2, Predictive model 1+TRUS-2; Predictive model 3, Predictive model 1+TRUS-5; Predictive model 4, age+PSA+PV+DRE+TRUS-5; PSA, prostate-specific antigen; PV, prostate volume; PSAD, PSA density; DRE, digital rectal examination; TRUS-2, transrectal ultrasound two -grade scoring system; TRUS-5, transrectal ultrasound five-grade scoring system.
Imaging plays an increasingly important role in the detection, staging, therapy, active surveillance, and recurrence monitoring of PCa. Currently, for initial detection of PCa, major imaging modalities include TRUS, multiparametric magnetic resonance imaging (mpMRI), and mpMRI-TRUS fusion imaging. As significant progress has been made in recent years, mpMRI has been shown to be a valuable tool for the detection and characterization of PCa. There were higher rates of HGPCa and lower rates of insignificant cancers detected with mpMRI-targeted cores as compared to TRUS alone. However, mpMRI-targeted biopsy improved the detection of significant PCa in men with a previous negative biopsy, rather than in men with an IPBx [19]. From the above-mentioned analysis and high cost of mpMRI, TRUS variables would be more practical for the IPBx predictor due to the accessibility, lower medical cost, noninvasiveness, improved resolution than before as well as the guidance for systematic biopsies.
Although numerous previous studies have evaluated the value of TRUS findings in predicting the probability of PCa at IPBx, the results are mixed. Some studies demonstrated that TRUS finding was an independent predictor for PCa [10, 12, 16], and the accuracy of the nomogram for PCa prediction was improved when adding the TRUS finding [16], conversely, the others showed that the TRUS finding was not an independent predictor for PCa [13, 14, 15]. The high dependence on the radiologists' experience, indecisive and confusing descriptions and reports, and the lack of interdisciplinary communications may be the main problems. The Prostate Imaging Reporting and Data System (PI-RADS) for mpMRI [18, 20] has become a wide accepted method for assessment with mpMRI, and can be used to address these problems. It and other structured systems are designed to promote global standardization and diminish variation in the acquisition, interpretation, and reporting of imaging examination, which facilitate clear communication and comprehension of imaging results as well as enhance multi-center clinical cooperation [18, 20]. In the present study, based on the PI-RADS for mpMRI [18], the previous study of a five-point subjective scale for TRUS imaging [17] and our clinical experience, we developed a five-grade scoring systems for conventional TRUS imaging. We evaluated and compared the efficacy of TRUS-5 and TRUS-2 in predicting the risk of PCa, and demonstrated that TRUS-5 was a better imaging predictor for PCa and HGPCa at IPBx than TRUS-2 (AUC: 0.787 vs. 0.694 for PCa, 0.841 vs. 0.713 for HGPCa). In addition, the predictive accuracy of TRUS-5 based models was higher than TRUS-2 based models, also indicating that TRUS-5 was a more accurate predictor for PCa and HGPCa.
Traditionally, a high PSA level or suspicious findings in either DRE or prostate imaging triggered the decision for a prostate biopsy. However, all have serious limitations: PSA is a gland-specific, not a cancer-specific biomarker [21]. An increased PSA level is not always diagnostic of PCa, and a normal PSA level cannot exclude PCa [20]. DRE is subjective and only evaluates the posterior part of the prostate, resulting in number of missed cancers. Conventional TRUS imaging has limited ability for PCa detection. Researchers have demonstrated that as many as 60% of morphologically suspicious US findings are proved to be benign [22] and 21%-47% of tumors may be missed at IPBx [23, 24]. To obtain more precise estimation of risk, several prediction models have been developed based on statistical models, such as nomograms. When compared to other prediction models, nomograms provide superior individualized disease-related risk estimations and represent the most accurate and discriminating tools for predicting outcomes in patients with PCa [25]. In view of these, we established a nomogram included six commonly used independent predictors (age, PSA, percent free PSA, PV, DRE and TRUS-5). We found that the AUC of our newly developed nomogram was 0.905 for overall PCa, which was higher than that of PSA (0.672) alone or the clinical base model (0.883) or TRUS-2 based model (0.888). In the internal validation, our nomogram showed better predictive accuracy (0.901) compared to previous nomograms developed among the Chinese population (0.848 reported by Tang et al., and 0.888 reported by Kuo et al.). [12, 13]
Table 5
Comparison of nomogram and other predictors using ROC analysis
| Characteristics | AUC (95% CI) for PCa | Characteristics | AUC (95% CI) for HGPCa |
|---|---|---|---|
| Age | 0.731(0.698-0.765) | Age | 0.685(0.645-0.724) |
| PSA | 0.672(0.636-0.708) | PSA | 0.718(0.679-0.757) |
| percent free PSA | 0.354(0.316-0.391) | percent free PSA | 0.363(0.322-0.404) |
| PV | 0.256(0.223-0.289) | PV | 0.289(0.249-0.328) |
| PSAD | 0.796(0.766-0.826) | PSAD | 0.809(0.776-0.842) |
| DRE | 0.661(0.624-0.698) | DRE | 0.680(0.639-0.721) |
| TRUS-2 | 0.694(0.658-0.729) | TRUS-2 | 0.713(0.676-0.750) |
| TRUS-5 | 0.787(0.756-0.819) | TRUS-5 | 0.841(0.809-0.874) |
| Predictive model 1 | 0.883(0.860-0.905) | Predictive model 1 | 0.850(0.823-0.8787) |
| Predictive model 2 | 0.888(0.867-0.910) | Predictive model 2 | 0.868(0.844-0.892) |
| Predictive model 3 | 0.905(0.885-0.925) | Predictive model 4 | 0.903(0.883-0.924) |
Abbreviations: AUC, area under the receiver operating characteristic curve; PCa, prostate cancer; HGPCa, high-grade prostate cancer; OR, odds ratio; PSA, prostate-specific antigen; PV, prostate volume; PSAD, PSA density; DRE, digital rectal examination; TRUS-2, transrectal ultrasound two -grade scoring system; TRUS-5, transrectal ultrasound five-grade scoring system; Predictive model 1, age+PSA+percent free PSA +PV+DRE; Predictive model 2, Predictive model 1+TRUS-2; Predictive model 3, Predictive model 1+TRUS-5; Predictive model 4, age+PSA+PV+DRE+TRUS-5.
Figure 4
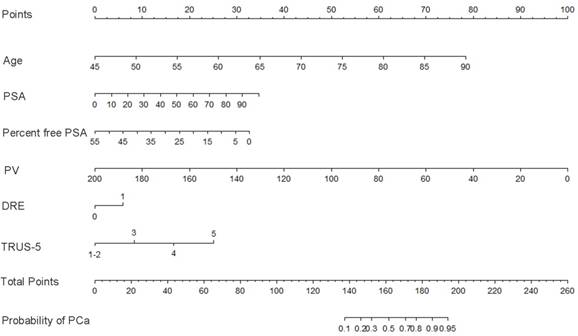
Nomogram predicting the probability of overall prostate cancer at initial biopsy. Abbreviations: PSA, prostate-specific antigen; PV, prostate volume; DRE, digital rectal examination; TRUS-5, transrectal ultrasound five-grade scoring system.
Figure 5
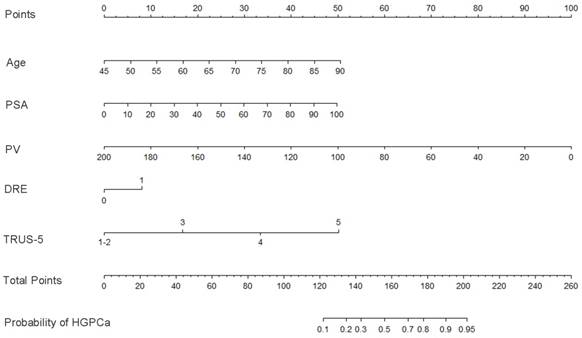
Nomogram predicting the probability of high-grade prostate cancer at initial biopsy. Abbreviations: PSA, prostate-specific antigen; PV, prostate volume; DRE, digital rectal examination; TRUS-5, transrectal ultrasound five-grade scoring system.
Nowadays, for PCa patients with a Gleason score < 7, active surveillance has become a significant management strategy. However, the present wide application of prostate biopsy based on PSA screening increased the detection of clinically indolent cancers and led to unnecessary and excessive examination or treatment. Several studies have shown that nomograms integrating the currently used independent predictors or adding a novel biomarker such as PCA3 may support clinicians to better identify men at risk of HGPCa [10, 11]. In this study, we developed a nomogram using age, PSA, DRE findings, PV, and the new independent predictor TRUS-5 to predict the possibility of HGPCa. The outcomes revealed that obviously greater AUC (0.903) was obtained for the model than PSA (0.718) alone or the clinical base model (0.85) or the TRUS-2 based model (0.868). In the internal validation, our nomogram showed better predictive accuracy (0.894) compared to previous nomograms (0.831 reported by Li et al., and 0.768 reported by Elshafei et al.) [10, 11].
Despite these encouraging findings, some limitations exist in our study. First, the subjects were enrolled from an unscreened cohort in a single institution and the PSA level and positive DRE findings would be higher than that of routine screening patients, which may lead to biased results. However, our nomogram reflects a large unscreened population which currently represents the majority of PCa diagnoses in China. Second, our nomograms were internally validated and had not been used on an external dataset. Our nomograms should be tested and verified by using prospectively-collected data from multiple centers. Third, the IPBx was used as the end point of this study. Although the sample size of this study is large, false negative biopsy rate cannot be avoided.
In summary, TRUS-5 is a better imaging predictor than TRUS-2 for PCa and HGPCa, and we suggest adding TRUS-5 but not TRUS-2 to the nomogram models. Our study represents the first effort to develop TRUS-5 based nomograms and to improve the prediction of PCa and HGPCa at IPBx, which may help to make the decision of whether to biopsy. Further external validation of the nomogram is required to test its validity in other populations.
Figure 6
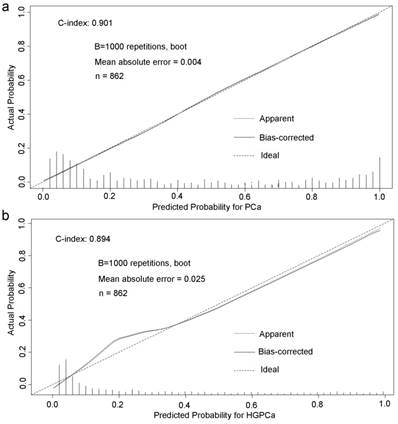
Predicted probability for prostate cancer (a) and high-grade prostate cancer (b) at initial biopsy.
Abbreviations
TRUS, transrectal ultrasound; TRUS-5, transrectal ultrasound five-grade scoring system; PCa, prostate cancer; HGPCa, high-grade prostate cancer; TRUS-2, transrectal ultrasound two-grade scoring system; IPBx, initial biopsy; PSA, prostate-specific antigen; DRE, digital rectal examination; PV, prostate volume; PSAD, PSA density; AUC, area under the receiver operating characteristic curve; PCA3, prostate cancer antigen 3; PZ, peripheral zone; TZ, transition zone; IQRs, interquartile ranges; mpMRI, multiparametric magnetic resonance imaging; PI-RADS, Prostate Imaging Reporting and Data System.
Acknowledgements
We thank Wen Qi Yang, MD, in the Department of Ultrasound for assistance.
This work was supported by National Natural Science Foundation of China (grant number: 81571678, 81572536, 81672850); the fund of cultivating scientific research seed plan of Renji Hospital, School of Medicine, Shanghai Jiao Tong University, Shanghai, China (grant number: RJZZ14-012); Science and Technology Commission of Shanghai Municipality (grant number: 14140901700, 15411966300, 16411969800); and Clinical and auxiliary departments ability construction project of Shanghai shen-kang hospital development center (grant number: SHDC22015003).
Competing Interests
The authors have declared that no competing interest exists.
References
1. Torre LA, Bray F, Siegel RL, Ferlay J, Lortet-Tieulent J, Jemal A. Global cancer statistics, 2012. CA Cancer J Clin. 2015;65(2):87-108
2. Loeb S, van den Heuvel S, Zhu X, Bangma CH, Schröder FH, Roobol MJ. Infectious complications and hospital admissions after prostate biopsy in a European randomized trial. Eur Urol. 2012;61(6):1110-4
3. Loeb S, Carter HB, Berndt SI, Ricker W, Schaeffer EM. Complications after prostate biopsy: data from SEER-Medicare. J Urol. 2011;186(5):1830-4
4. Nam RK, Saskin R, Lee Y. et al. Increasing hospital admission rates for urological complications after transrectal ultrasound guided prostate biopsy. J Urol. 2010;183(3):963-8
5. Anastasiadis E, van der Meulen J, Emberton M. Hospital admissions after transrectal ultrasound-guided biopsy of the prostate in men diagnosed with prostate cancer: a database analysis in England. Int J Urol. 2015;22(2):181-6
6. Rodriguez LV, Terris Mk. Risks and complications of transrectal ultrasound guided prostate needle biopsy: a prospective study and review of the literatura. J Urol. 1998;160(6 Pt 1):2115-20
7. Loeb S, Bjurlin MA, Nicholson J. et al. Overdiagnosis and overtreatment of prostate cancer. Eur Urol. 2014;65(6):1046-55
8. Ploussard G, Epstein JI, Montironi R. et al. The contemporary concept of significant versus insignificant prostate cancer. Eur Urol. 2011;60(2):291-303
9. Karakiewicz PI, Benayoun S, Kattan MW. et al. Development and validation of a nomogram predicting the outcome of prostate biopsy based on patient age, digital rectal examination and serum prostate specific antigen. J Urol. 2005;173(6):1930-1934
10. Li X, Pan Y, Huang Y. et al. Developing a model for forecasting Gleason score ≥7 in potential prostate cancer patients to reduce unnecessary prostate biopsies. Int Urol Nephrol. 2016;48(4):535-40
11. Elshafei A, Chevli KK, Moussa AS. et al. PCA3-based nomogram for predicting prostate cancer and high grade cancer on initial transrectal guided biopsy. Prostate. 2015;75(16):1951-7
12. Kuo SC, Hung SH, Wang HY. et al. Chinese nomogram to predict probability of positive initial prostate biopsy: a study in Taiwan region. Asian J Androl. 2013;15(6):780-4
13. Tang P, Chen H, Uhlman M. et al. A nomogram based on age, prostate-specific antigen level, prostate volume and digital rectal examination for predicting risk of prostate cancer. Asian J Androl. 2013;15(1):129-33
14. Nicolaiew N, Ploussard G, Chun FK. et al. Prediction of the risk of harboring prostate cancer by a prebiopsy nomogram based on extended biopsy protocol. Urol Int. 2013;90(3):306-11
15. Cavadas V, Osório L, Sabell F, Teves F, Branco F, Silva-Ramos M. Prostate cancer prevention trial and European randomized study of screening for prostate cancer risk calculators: a performance comparison in a contemporary screened cohort. Eur Urol. 2010;58(4):551-8
16. Kawakami S, Numao N, Okubo Y. et al. Development, validation, and head-to-head comparison of logistic regression-based nomograms and artificial neural network models predicting prostate cancer on initial extended biopsy. Eur Urol. 2008;54(3):601-11
17. Halpern EJ, Ramey JR, Strup SE, Frauscher F, McCue P, Gomella LG. Detection of prostate carcinoma with contrast-enhanced sonography using intermittent harmonic imaging. Cancer. 2005;104(11):2373-83
18. Weinreb JC, Barentsz JO, Choyke PL. et al. PI-RADS Prostate Imaging - Reporting and Data System: 2015, Version 2. Eur Urol. 2016;69(1):16-40
19. Schoots IG, Roobol MJ, Nieboer D, Bangma CH, Steyerberg EW, Hunink MG. Magnetic resonance imaging-targeted biopsy may enhance the diagnostic accuracy of significant prostate cancer detection compared to standard transrectal ultrasound-guided biopsy: a systematic review and meta-analysis. Eur Urol. 2015;68(3):438-50
20. Barentsz JO, Richenberg J, Clements R. et al. ESUR prostate MR guidelines 2012. Eur Radiol. 2012;22(4):746-57
21. Botchorishvili G, Matikainen MP, Lilja H. Early prostate-specific antigen changes and the diagnosis and prognosis of prostate cancer. Curr Opin Urol. 2009;19(3):221-6
22. Loch T, Eppelmann U, Lehmann J, Wullich B, Loch A, Stöckle M. Transrectal ultrasound guided biopsy of the prostate: random sextant versus biopsies of sonomorphologically suspicious lesions. World J Urol. 2004;22(5):357-60
23. Singh H, Canto EI, Shariat SF. et al. Predictors of prostate cancer after initial negative systematic 12 core biopsy. J Urol. 2004;171(5):1850-4
24. Taira AV, Merrick GS, Galbreath RW. et al. Performance of transperineal template-guided mapping biopsy in detecting prostate cancer in the initial and repeat biopsy setting. Prostate Cancer Prostatic Dis. 2010;13(1):71-7
25. Shariat SF, Karakiewicz PI, Suardi N, Kattan MW. Comparison of nomograms with other methods for predicting outcomes in prostate cancer: a critical analysis of the literature. Clin Cancer Res. 2008;14(14):4400-7
Author contact
![]() Corresponding authors: Feng Hua Li, Department of Ultrasound, Renji Hospital, School of Medicine, Shanghai Jiao Tong University, 160 Pujian Rd, 200127 Shanghai, China. E-mail: fenghuali61com. Phone number: 86-021-68383396 or Wei Xue, Department of Urology, Renji Hospital, School of Medicine, Shanghai Jiao Tong University, 160 Pujian Rd, 200127 Shanghai, China. E-mail: xueweicom. Phone number: 86-021-68383716.
Corresponding authors: Feng Hua Li, Department of Ultrasound, Renji Hospital, School of Medicine, Shanghai Jiao Tong University, 160 Pujian Rd, 200127 Shanghai, China. E-mail: fenghuali61com. Phone number: 86-021-68383396 or Wei Xue, Department of Urology, Renji Hospital, School of Medicine, Shanghai Jiao Tong University, 160 Pujian Rd, 200127 Shanghai, China. E-mail: xueweicom. Phone number: 86-021-68383716.
Citation styles
APA
Xie, S.W., Wang, Y.Q., Dong, B.J., Xia, J.G., Li, H.L., Zhang, S.J., Li, F.H., Xue, W. (2018). A Nomogram Based on a TRUS Five-Grade Scoring System for the Prediction of Prostate Cancer and High Grade Prostate Cancer at Initial TRUS-Guided Biopsy. Journal of Cancer, 9(23), 4382-4390. https://doi.org/10.7150/jca.27344.
ACS
Xie, S.W.; Wang, Y.Q.; Dong, B.J.; Xia, J.G.; Li, H.L.; Zhang, S.J.; Li, F.H.; Xue, W. A Nomogram Based on a TRUS Five-Grade Scoring System for the Prediction of Prostate Cancer and High Grade Prostate Cancer at Initial TRUS-Guided Biopsy. J. Cancer 2018, 9 (23), 4382-4390. DOI: 10.7150/jca.27344.
NLM
Xie SW, Wang YQ, Dong BJ, Xia JG, Li HL, Zhang SJ, Li FH, Xue W. A Nomogram Based on a TRUS Five-Grade Scoring System for the Prediction of Prostate Cancer and High Grade Prostate Cancer at Initial TRUS-Guided Biopsy. J Cancer 2018; 9(23):4382-4390. doi:10.7150/jca.27344. https://www.jcancer.org/v09p4382.htm
CSE
Xie SW, Wang YQ, Dong BJ, Xia JG, Li HL, Zhang SJ, Li FH, Xue W. 2018. A Nomogram Based on a TRUS Five-Grade Scoring System for the Prediction of Prostate Cancer and High Grade Prostate Cancer at Initial TRUS-Guided Biopsy. J Cancer. 9(23):4382-4390.
This is an open access article distributed under the terms of the Creative Commons Attribution (CC BY-NC) license (https://creativecommons.org/licenses/by-nc/4.0/). See http://ivyspring.com/terms for full terms and conditions.