Journal of Cancer
ISSN: 1837-9664
3.2
Impact Factor
ISSN: 1837-9664

 Global reach, higher impact
J Cancer 2018; 9(22):4099-4107. doi:10.7150/jca.27408 This issue Cite
Research Paper
Immunoscore System for Predicting Clinical Outcome of Metastatic Renal Cell Carcinoma Patients Treated with Tyrosine Kinase Inhibitors
Jia-Xi Yao*, Xiang Chen*, Wei Xi, Yan-Jun Zhu, Hang Wang, Xiao-Yi Hu ![]() , Jian-Ming Guo
, Jian-Ming Guo ![]()
Department of Urology, Zhongshan Hospital, Fudan University, Shanghai 200032, China.
*Jia-Xi Yao and Xiang Chen contributed equally to the work.
Received 2018-5-22; Accepted 2018-8-28; Published 2018-10-18
Citation:
Yao JX, Chen X, Xi W, Zhu YJ, Wang H, Hu XY, Guo JM. Immunoscore System for Predicting Clinical Outcome of Metastatic Renal Cell Carcinoma Patients Treated with Tyrosine Kinase Inhibitors. J Cancer 2018; 9(22):4099-4107. doi:10.7150/jca.27408. https://www.jcancer.org/v09p4099.htm
Other stylesAbstract
We conducted this study to determine whether immunoscore system (IS) predicts survival in patients with metastatic renal cell carcinoma (mRCC). A total of 218 mRCC patients treated with sunitinib or sorafenib in Zhongshan Hospital, Fudan University were recruited during 2007-2017, retrospectively. CD8, CD4, Treg, PD-1 and PD-L1 expression were evaluated by immunohistochemical staining of paraffin embedded slide. Kaplan-Meier method and COX regression model were used in survival analyses. Multivariate analyses demonstrated that expressions of CD8, Treg, PD-1 and stromal PD-L1 (sPD-L1) expressions were independent predictive factors for OS, thus IS was established containing these four immunological factors. Subsequent analysis revealed that performance of IS provided good differentiation of OS and PFS. Besides, multivariate analysis identified IS as an independent prognostic factor for OS (p<0.001) and PFS (p=0.002). IS, compared with International mRCC Database Consortium (IMDC) risk model, and provided better prediction ability for OS. Results suggested that IS was a powerful prognostic factor for OS and PFS in patients with mRCC treated with tyrosine kinase inhibitors. And IS can be used as essential supplement to IMDC for outcome prediction in mRCC patients.
Keywords: immunoscore system, renal cell carcinoma, tyrosine kinase inhibitors, prognostic factor
Introduction
American Cancer Society's most recent estimates in kidney cancer for 2016 reveals approximately 62,700 new cases and about 14,240 deaths[1]. Despite of the progress for treatment of metastatic renal cell carcinoma (mRCC) during the past two decades, the current 5-year survival rate of patients with metastatic disease was still low (8%)[2]. Tyrosine kinase inhibitors (TKI), targeting vascular endothelial growth factor (VEGF) signaling, such as sunitinib, sorafenib, and pazopanib, currently play central roles in the treatment of patients with mRCC[3]. TKIs offer superior efficacy and improved tolerability compared with cytokine-based therapy. However, most patients develop resistance to first-line targeted treatments and finally lead to disease progression.
Thus, it is important to identify novel markers to provide patients with individualized risk directed therapies with mRCC[4]. This new understanding of antitumor immune response provides the rationale of using immune checkpoint to predict clinical outcome. Multiple models for predicting outcome of mRCC patients to targeted therapies have been reported[5, 6]. However, conventional model provided no information of immunological features of mRCC. Therefore, immunological predictors for clinical outcome of mRCC patients was still under requirement [7, 8].
In this research, to establish a functional Immunoscore system (IS), 218 patients with mRCC treated with TKIs as first-line systemic treatment were studied and evaluated with IS. And IS was found to be a promising model evaluating prognosis of mRCC patients.
Methods
Patient selection and evaluation
A total of 218 patients with mRCC who received VEGF-TKI as first-line treatment were recruited from 2007 to 2017, retrospectively, in Zhongshan Hospital. Informed consent was acquired and the study design was approved by the research ethics committee of our institution. All patients have been diagnosed with mRCC based on pathological and medical imaging evidence. Paraffin tissue sections were collected for all patients. The slides were reassessed by a urologic pathologist blind to patient outcomes. The pathologic features including histologic subtype, tumor size, tumor classification, and nuclear grade were evaluated. The histological subtypes were classified according to the 2016 World Health Organization (WHO) Tumor Classification, and tumors were graded according to the 2013 International Society of Urological Pathology (ISUP) grading system[9, 10].
Baseline conditions before TKI treatment were collected, including performance status (PS), clinicopathological examinations; clinical information was acquired from the medical records. Risk classification was conducted using the International Metastatic Renal Cell Carcinoma Database Consortium (IMDC) model[5]. All patients received computed tomography evaluate response to TKI treatment according to the Revised Response Evaluation Criteria in Solid Tumors (RECIST) guidelines (version 1.1)[11].
Immunohistochemistry for immune checkpoint-associated molecules and tumor infiltrating lymphocyte cells
Tissue samples were fixed with formalin and embedded in paraffin. The sections were heated at 60℃ for 2 hours, dewaxed in xylene, and dehydrated by a gradient concentration of alcohol. After retrieving and blocking the endogenous peroxidase and nonspecific staining with 3% (v/v) hydrogen peroxide and normal goat serum, the sections were incubated with primary antibody overnight at 4℃. The slides were then incubated with HRP conjugated goat anti-mouse/rabbit IgG secondary antibody for 20 min at 37℃. Ultimately, the sections were visualized with DAB solution (DAKO, Carpinteria, CA, USA) and counterstained with haematoxylin. The amount of positively stained cells was scored independently by two pathologists blind to outcome of the patient. Primary antibodies used were: mouse anti-human CD8 (ab17147, Abcam, concentration 1:400), mouse anti-human Foxp3 (ab20034, Abcam, concentration1:100), rabbit anti-human CD4 (ab133616, Abcam, concentration1:200), mouse anti-human PD-1 (ab52587, Abcam, concentration1:100), rabbit anti-human PD-L1 (ab205921, Abcam, concentration 1:400). The PD-L1 expression on both stromal and tumor cells was calculated. The percentages of tumoral PD-L1 (tPD-L1) were assessed. The staining was scored as follows: 0, no expression or expression in < 5% tumor cells; 1, weak expression in >5% tumor cells; 2, moderate expression in >5% tumor cells; and 3, strong expression in >5% tumor cells. The samples were subsequently categorized into positive group (with scores 2 or 3) and negative group (with scores 0 or 1).
Stromal PD-L1 (sPD-L1) expression was calculated with adjusted score system as follows: absent (0), focal (1), mild (2), moderate (3), and severe (4). sPD-L1 positive and negative expression were defined with scores ranged 2 to 4 and 0 to 1, respectively. Five independent areas of each slide were examined under microscope using a virtual digital slide scanner (Aperio Technologies, Vista, CA, USA) to calculate the total counts of foxp3+ and CD8+ and CD4+ and PD-1+ tumor infiltrating lymphocyte cells (TILs). The cell counts with positive expression were measured by 2 independent investigators, a median counts for positively stained cells were used to stratify patients.
Outcome evaluation
Overall survival (OS) was defined as the time interval between the starting date of TKI treatment and the date of death or censoring of the last follow-up visit. Progression free survival (PFS) was defined as the time interval between TKI treatment initiation and the date of disease progression or censoring of the last follow up. Survival curves were generated using the Kaplan-Meier method and a log-rank test was used to assess the effect of PD-1, PD-L1, Treg, CD4 and CD8 on the OS, and the multivariate Cox proportional hazard regression model were used for survival analyses. Comparison between our prediction model and IMDC model was performed by receiver operating characteristic (ROC) analysis.
Development of immunoscore system (IS)
Following factors were included in the IS: sPD-L1, PD-1, CD8, Treg and IMDC. High expression of sPD-L1, PD-1 or Treg was calculated as 1 point; and low expression of sPD-L1, PD-1 or Treg was calculated as 0 point. Low expression of CD8 was calculated as 1 point; and high expression of CD8 was calculated as 0 point. Poor, intermediate, and favorable risk of IMDC was defined as 0, 1 and 2 points, respectively. These points were added up as immunoscore index (ranged from 0 to 6). The IS index was further stratified as low-risk (0-2 points), intermediate-risk (3-4 points) and high-risk (5-6 points) group.
Statistical Analysis
χ2 tests were used to compare categorical variables between the negative and positive groups. Univariate and multivariate analyses were done with Cox proportional hazards regression model to determine whether the IS had predictive value. Finally, time dependent ROC analysis was performed by the IS and IMDC model. The area under the curve (AUC) was used to measure prognostic or predictive accuracy. We used MedCalc for ROC curve comparison and DeLong method for p-value calculation. All analyses were conducted using SPSS, version 21.0 (SPSS, Chicago, IL). Difference with p<0.05 was considered statistically significant.
Results
Patient and tumor characteristics by expression patterns of immune checkpoint-associated molecules
The patient demographics and pathologic features listed in Table 1. The relationship between tPD-L1 expression was strongly associated with histologic type (p<0.001), tumor nucleus grading (p=0.002), sPD-L1 (p<0.001), PD-1 (p<0.001), Treg (p<0.001), and CD4 (p<0.001, Table S1). Furthermore, tPD-L1 positive was more frequently detected in Fuhrman Grade IV primary tumors (n=19, 76.00%) compared with Fuhrman Grade III (n=38, 45.24%, P<0.001) and Fuhrman Grade II tumors (n=34, 31.19%, P<0.001). The IMDC prognostic risk scores were favorable, intermediate, and poor for 21 (16.15%), 91 (70.00%), and 18 (13.85%) patients, respectively, in the sunitinib group; and 16 (18.18%), 52 (59.09%), and 20 (22.73%), respectively, in the sorafenib group. Response was assessed according to RECIST criteria, 48 (22.02%), 113(51.83%), and 57 (26.15%) had PR, SD, and PD, respectively. Objective response was observed in 48 (22.02%) patients.
sPD-L1 expression was strongly associated with tPD-L1 (p<0.001), PD-1 (p<0.001), and CD4 (p=0.001); PD-1 expression was strongly associated with Fuhrman grade (p=0.006), sPD-L1(p<0.001), tPD-L1 (p<0.001), CD8 (p=0.003), CD4 (p=0.002), and Treg (p<0.001) (Table S1).
Table 1
Clinical and pathologic characteristics of patients
| Characteristics | Patients | |
|---|---|---|
| n | % | |
| No. of patients | 218 | 100 |
| Gender | ||
| Male | 160 | 73.39 |
| Female | 58 | 26.61 |
| Age Median (IQR) | 59(52-65) | |
| ≤59 years | 104 | 47.71 |
| >59 years | 114 | 52.29 |
| Histologic type | ||
| Clear cell type | 187 | 85.78 |
| Non-clear cell type | 31 | 14.22 |
| Tumor nucleus grade | ||
| 2 | 109 | 50.00 |
| 3+4 | 109 | 50.00 |
| Initial TNM stage | ||
| Stage I+ II | 120 | 55.05 |
| Stage III+ IV | 98 | 44.95 |
| Pulmonary metastasis | ||
| Present | 134 | 61.47 |
| Absent | 84 | 38.53 |
| Clinical responses | ||
| PR | 48 | 22.02 |
| SD | 113 | 51.83 |
| PD | 57 | 26.15 |
| Metastatic organ number | ||
| 1 | 145 | 66.51 |
| ≥2 | 73 | 33.49 |
| Tumor necrosis | ||
| Present | 73 | 33.49 |
| Absent | 145 | 66.51 |
| IMDC | ||
| Favorable | 37 | 16.97 |
| Intermediate | 143 | 65.60 |
| Poor | 38 | 17.43 |
| Tumor size | ||
| ≤4 cm | 35 | 16.06 |
| >4 and ≤7 cm | 94 | 43.12 |
| >7 and ≤10 cm | 59 | 27.06 |
| >10 cm | 30 | 13.76 |
| Systemic therapy | ||
| Sunitinib | 130 | 59.63 |
| Sorafenib | 88 | 40.37 |
| tPD-L1 | ||
| Negative | 127 | 58.26 |
| Positive | 91 | 41.74 |
| sPD-L1 | ||
| Negative | 148 | 67.89 |
| Positive | 70 | 32.11 |
| PD-1 | ||
| Low | 149 | 68.35 |
| High | 69 | 31.65 |
| Treg | ||
| Low | 140 | 64.22 |
| High | 78 | 35.78 |
| CD8 | ||
| Low | 98 | 44.95 |
| High | 120 | 55.05 |
| CD4 | ||
| Low | 96 | 44.04 |
| High | 122 | 55.96 |
| IS | ||
| Low | 84 | 38.53 |
| Intermediate | 93 | 42.66 |
| High | 41 | 18.81 |
Abbreviations: IQR, interquartile range; PR, partial response; SD, stable disease; PD, progressive disease; tPD-L1, tumor cells PD-L1 expressions; sPD-L1, stromal immune cells PD-L1 expressions; IMDC, International Metastatic Renal Cell Carcinoma Database Consortium; IS, Immunoscore.
Patient and tumor characteristics by expression patterns of TILs
The relationship between TILs and patient demographics and pathologic features is listed in Table S2. CD4 expression in tumor was strongly associated with tPD-L1 (p<0.001), sPD-L1(p=0.001), PD-1 (p=0.002), CD8 (p<0.001). CD8 expression in tumor was strongly associated with PD-1 (p=0.003), and CD4 (p<0.001). Treg expression in tumor was strongly associated with gender (p=0.005), tPD-L1 (p<0.001), sPD-L1(p<0.001), PD-1 (p<0.001) (Table S2).
Prognostic significance of immune checkpoint-associated molecules expression and TILs in mRCC patients treated with TKI
tPD-L1, sPD-L1 expression and PD-1, CD4, CD8 and Treg expression in TIL were detected (Figure 1,2). tPD-L1 and sPD-L1 were positive observed in 41.74% (91 out of 218) and 32.11% (70 out of 218) of samples. High PD-1 expression was observed in 31.65% (69 out of 218), TILs with high CD4 expression in 55.96% (122 out of 218), TILs with high CD8 expression in 55.05% (120 out of 218), and TILs with high Treg expression in 35.78% (78 out of 218) samples. Patients with tPD-L1+ had significantly lower OS compared with those with tPD-L1- (p=0.041). Patients of PD-1high group had poorer OS compared with PD-1low patients (p=0.007), while patients with CD4high had better OS than CD4low TILs (p=0.013). CD8high TILs is related with better OS compared with CD8low TILs (p=0.001). Finally, Treghigh TIL patients had poorer OS compared with patients with Treglow TILs (p=0.022) (Figure 3).
Univariable and multivariable analyses of prognostic factors
Univariable and multivariable analysis were performed in clinical characteristics and immune effectors of 218 patients. Initial TNM stage, Fuhrman grade, pulmonary metastasis, IMDC, CD4, CD8, Treg, PD-1, tPD-L1 and sPD-L1 were significantly associated with OS (all with p<0.05) in univariable analysis. Multivariable analyses suggested that four immune variables (Treg, sPD-L1, PD-1, and CD8) and IMDC had independent prognostic value for OS of mRCC patients (Table 2).
The univariate PFS analysis showed that presence of pulmonary metastasis, CD8, PD-1, sPD-L1, Treg, and IMDC were significantly associated with PFS (all with p<0.05). Four immune variables (Treg, sPD-L1, PD-1, and CD8) and IMDC were independent prognostic factors for PFS of mRCC patients (Table 3).
Performance of Immunoscore System (IS)
A comprehensive IS was developed based mainly on immune factors (Treg, sPD-L1, PD-1, CD8, and IMDC) for prediction of survival of patients. Factors with association with negative outcome were counted as 1 point and IMDC counted as 0-2. The total score was added to form IS index, based on which patients were allocated into 3 groups (Figure 4). The characteristics of three IS groups were compared in Table S3. To compare the precision of IS with IMDC prognostic model, receiver operating characteristic (ROC) analysis was performed. The AUC for IS was 0.810 for 3-year mortality's prediction, superior to IMDC (0.737); and 0.849 for 5-year mortality's prediction, superior to IMDC (0.766) as well (Figure 5).
Table 2
Univariate and multivariate Cox regression analyses for OS of patients (n=218)
| Variables | Univariate | Multivariate | ||
|---|---|---|---|---|
| HR (95% CI) | p-value | HR (95% CI) | p-value | |
| Age | ||||
| >59 years vs ≤59 years | 1.190 (0.814-1.740) | 0.370 | ||
| Gender | ||||
| Male vs Female | 0.842 (0.541-1.311) | 0.447 | ||
| Histologic type | ||||
| Non-clear cell vs clear cell type | 1.367 (0.832-2.244) | 0.217 | ||
| Tumor nucleus grade | ||||
| 3+4 vs 2 | 1.366 (1.042-1.790) | 0.024 | 0.999 (0.649-1.539) | 0.997 |
| Initial TNM stage | ||||
| III+ IV vs I+ II | 1.463 (1.002-2.135) | 0.049 | 1.456 (0.956-2.217) | 0.080 |
| Tumor size | ||||
| Per 1cm increase | 1.196 (0.982-1.455) | 0.075 | ||
| Pulmonary metastasis | ||||
| Present vs Absent | 1.736 (1.149-2.622) | 0.009 | 1.464 (0.940-2.280) | 0.091 |
| Systemic therapy | ||||
| Sorafenib vs Sunitinib | 1.045 (0.696-1.568) | 0.832 | ||
| Tumor necrosis | ||||
| Present vs Absent | 1.339 (0.899-1.993) | 0.151 | ||
| Metastatic organ number | ||||
| ≥2 vs 1 | 1.091 (0.732-1.626) | 0.667 | ||
| tPD-L1 | ||||
| Positive vs Negative | 1.494 (1.011-2.210) | 0.044 | 0.874 (0.514-1.488) | 0.621 |
| sPD-L1 | ||||
| Positive vs Negative | 1.987 (1.336-2.954) | 0.001 | 1.740 (1.065-2.843) | 0.027 |
| Treg | ||||
| High vs Low | 1.573 (1.061-2.333) | 0.024 | 1.750 (1.067-2.870) | 0.027 |
| CD8 | ||||
| High vs Low | 0.543 (0.371-0.794) | 0.002 | 0.499 (0.316-0.790) | 0.003 |
| CD4 | ||||
| High vs Low | 0.626 (0.428-0.914) | 0.015 | 0.649 (0.404-1.043) | 0.074 |
| PD-1 | ||||
| High vs Low | 1.713 (1.151-2.548) | 0.008 | 1.840 (1.158-2.925) | 0.010 |
| IMDC | <0.001 | <0.001 | ||
| Favorable | 1.000 | 1.000 | ||
| Intermediate | 1.381 (0.761-2.507) | 1.599 (0.859-2.977) | ||
| Poor | 3.528 (1.828-6.810) | 3.995 (1.934-8.255) | ||
| IS | <0.001 | |||
| Low | 1.000 | |||
| Intermediate | 1.985 (1.275-3.093) | |||
| High | 3.061 (1.792-5.229) | |||
Abbreviations: tPD-L1,tumor cells PD-L1 expressions; sPD-L1, stromal immune cells PD-L1 expressions; CI, confidence interval; IMDC, International Metastatic Renal Cancer Database Consortium; OS, overall survival; IS, Immunoscore.
Figure 1
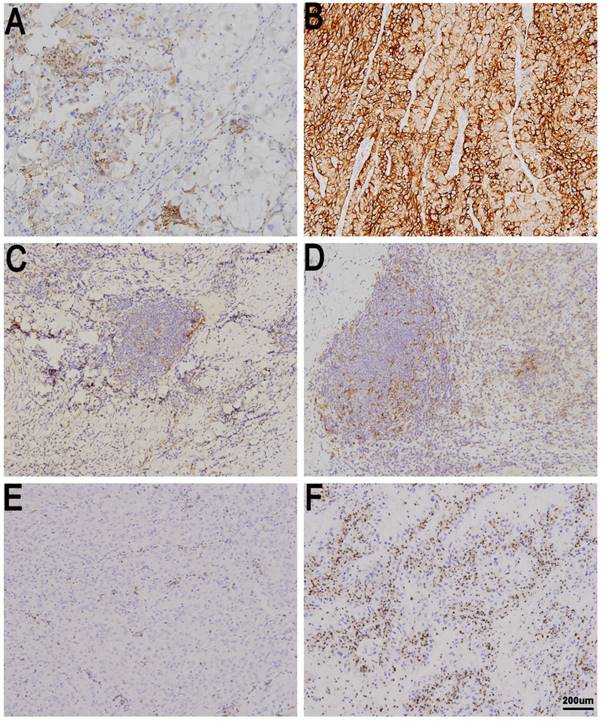
Immune checkpoint expression in metastatic renal cell carcinoma (mRCC) tissues. tPD-L1 negative (A) and positive in mRCC tissues (B). sPD-L1 negative (C) and positive in mRCC tissues (D). PD-1 low in (E) and high in mRCC tissues (F). Original magnification: ×100.
Discussion
The association between expression of immune associated molecules and prognosis of patients with mRCC has yet to be clarified[12]. Blockade of the PD-1/PD-L1 pathway with monoclonal antibodies has emerged as a new therapeutic modality for mRCC patients[13-15]. In the present research, we found that patients with high PD-L1, PD-1 and Treg expression had shorter survival than those with low expression. High expression of CD4 and CD8 was prognostic indicator for better OS.
The association between CD8+ TIL density and PD-L1 expression in mRCC patients have been studied in multiple studies[16, 17]. CD8 cytotoxic T cells is a critical component of the cellular immune system and is pivotal for cell-mediated anti-tumor immune responses[18, 19]. High expression of tumor infiltrating immune cells, especially CD8+ T cells, has been associated with more beneficial clinical outcomes in solid tumor. Former studies reported that patients with tumors consisting infiltrating CD8+ TIL tended to have better survival rate[20]. We also observed that a higher CD8+ TIL density was significantly associated with longer survival. The immune surveillance system and tumor microenvironment are thought to play an important role in tumor progression and growth and affect patients' clinical outcome. A research in patients with mRCC found that TKI targeted therapy caused a significant reduction in PD-L1 expression, but no correlation between clinical outcome and PD-L1 expression was reported[21].
Figure 2
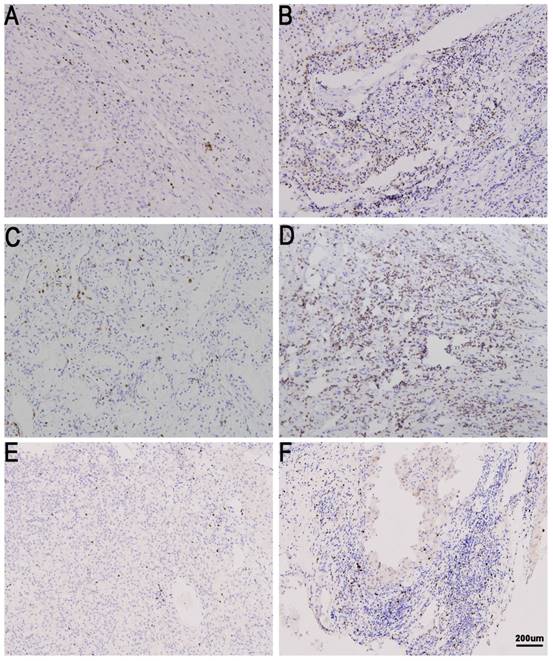
TIL expression in metastatic renal cell carcinoma (mRCC) tissues. CD8 low (A) and high in mRCC tissues (B). CD4 low (C) and high in mRCC tissues (D). Treg low (E)and high in mRCC tissues (F). Original magnification: ×100.
Figure 3
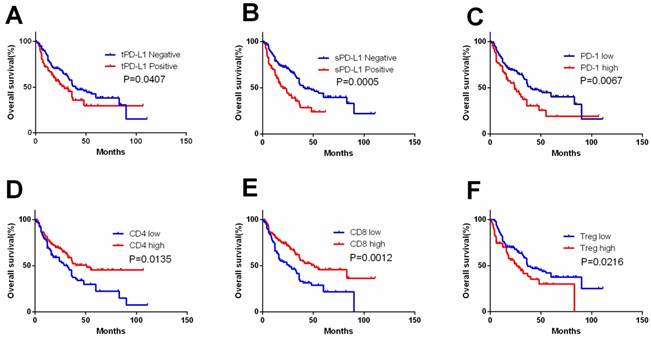
Kaplan-Meier curves according to immune check point expression level and TIL to assess prognostic value by systemic therapy in mRCC patients. Kaplan-Meier analysis of OS according to tPD-L1 expression (A), sPD-L1 expression (B), PD-1 expression (C), CD4 expression (D), CD8 expression (E), and Treg expression (F). P-value was calculated by log-rank test.
Figure 4
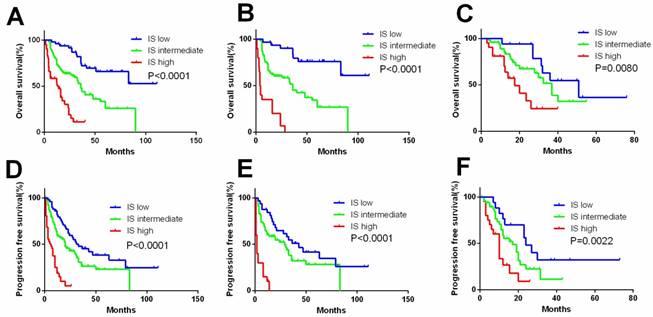
Kaplan-Meier curves according to immunoscore system (IS) in the overall and subgroup analysis to assess prognostic value by system therapy in mRCC patients. Kaplan-Meier analysis of OS and PFS according to the IS in overall patients (A, D). Kaplan-Meier analysis of OS and PFS according to the IS in sunitinib (B, E) and sorafenib group (C, F). P-value was calculated by log-rank test.
Figure 5
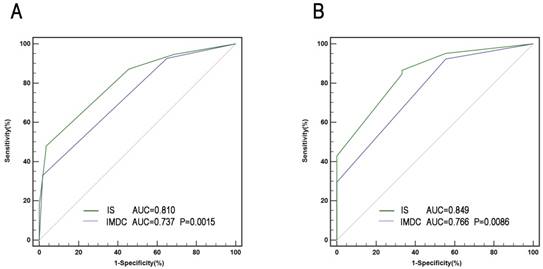
ROC analysis for predictive accuracy of overall survival (OS) using International mRCC Database Consortium (IMDC) risk criteria and IS. (A) 36-month follow-up; (B) 60 -month follow-up.
RCC is a heterogenous cancer. Accumulating evidence has suggested that extrinsic immune effectors should be considered when evaluating the tumor progression and patients' clinical outcome[22]. Immune checkpoint molecules such as PD-L1 and PD-1 play a pivotal role in cancer[23]. Programmed death-ligand 1 (PD-L1) is expressed in various immune cells and tumor cells, and is able to bind to PD-1 on T lymphocytes, thereby inhibiting their function. PD-1/PD-L1 axis is a major immunotherapeutic target for inhibition in various cancer types, and the expression pattern of PD-1/PD-L1 provided prognostic significance. Nonetheless, considering the complicated characteristics of immune response, a comprehensive immunoscore system is expected to provide more precise prognostic prediction for mRCC patients.
In the current study, we analyzed the expression of immune checkpoint-associated molecules (PD-L1 and PD-1) and TILs (CD8, CD4 and Treg) in mRCC patients treated with TKI and the association between the expression pattern of immune effectors and survival of patients. Activation of immune checkpoint pathways in tumor tissues was significantly associated with adverse clinicopathological features in patients with mRCC who received TKIs as first-line systemic therapy. Among the immune parameters evaluated in the IS, Treg, CD8 and PD-L1/PD-1 expression are significantly associated with outcome of patients.
Prognostic evaluation of patients with mRCC significantly differs from non-metastatic RCC. Traditional anatomic/pathological factors, such as TNM stage and nucleus grade provide limited prognostic indications in mRCC. Instead, hematological parameters models (MSKCC and IMDC) are proven to be useful and considered as the most dependable mRCC prognostic model to date. However, it does not provide information about the immunological features of the cancer. Separately, Treg, sPD-L1, PD-1, and CD8 had prognostic significance in mRCC. However, single factor was insufficient for accurate prognostic prediction of cancer patients. Thus, a comprehensive IS was developed based mainly on immune factors (Treg, sPD-L1, PD-1, CD8, and IMDC) for prediction of survival, and IS might provide more accurate prognostic information regardless of stage or previous systematic treatment (Figure 4).
Table 3
Univariate and multivariate Cox regression analyses for PFS of patients (n=218)
| Variables | Univariate | Multivariate | ||
|---|---|---|---|---|
| HR (95% CI) | p-value | HR (95% CI) | p-value | |
| Age | ||||
| >59 years vs ≤59 years | 1.083 (0.768-1.528) | 0.648 | ||
| Gender | ||||
| Male vs Female | 0.740 (0.496-1.104) | 0.141 | ||
| Histologic type | ||||
| Non-clear cell vs clear cell type | 1.214 (0.753-1.956) | 0.426 | ||
| Tumor nucleus grade | ||||
| 3+4 vs 2 | 1.043 (0.740-1.471) | 0.810 | ||
| Initial TNM stage | ||||
| III+ IV vs I+ II | 1.219 (0.863-1.721) | 0.260 | ||
| Tumor size | ||||
| Per 1cm increase | 1.097 (0.917-1.313) | 0.311 | ||
| Pulmonary metastasis | ||||
| Present vs Absent | 1.691 (1.169-2.445) | 0.005 | 1.409 (0.954-2.082) | 0.085 |
| Systemic therapy | ||||
| Sorafenib vs Sunitinib | 0.811 (0.565-1.163) | 0.254 | ||
| Tumor necrosis | ||||
| Present vs Absent | 1.259 (0.873-1.815) | 0.217 | ||
| Metastatic organ number | ||||
| ≥2 vs 1 | 1.002 (0.695-1.445) | 0.991 | ||
| tPD-L1 | ||||
| Positive vs Negative | 1.220 (0.849-1.753) | 0.283 | 0.767 (0.483-1.219) | 0.262 |
| sPD-L1 | ||||
| Positive vs Negative | 1.750 (1.217-2.516) | 0.003 | 1.718 (1.107-2.666) | 0.016 |
| Treg | ||||
| High vs Low | 1.928 (1.397-2.046) | 0.042 | 1.568 (1.025-2.401) | 0.038 |
| CD8 | ||||
| High vs Low | 0.645 (0.457-0.910) | 0.013 | 0.574 (0.384-0.858) | 0.007 |
| CD4 | ||||
| High vs Low | 0.738 (0.523-1.039) | 0.082 | 0.724 (0.473-1.109) | 0.138 |
| PD-1 | ||||
| High vs Low | 1.605 (1.115-2.311) | 0.011 | 1.657 (1.106-2.483) | 0.014 |
| IMDC | 0.030 | 0.044 | ||
| Favorable | 1.000 | 1.000 | ||
| Intermediate | 0.975 (0.608-1.562) | 1.083 (0.663-1.769) | ||
| Poor | 1.748 (0.992-3.079) | 1.872 (1.018-3.440) | ||
| IS | 0.002 | |||
| Low | 1.000 | |||
| Intermediate | 1.364 (0.927-2.007) | |||
| High | 2.148 (1.318-3.501) | |||
Abbreviations: tPD-L1,tumor cells PD-L1 expressions; sPD-L1, stromal immune cells PD-L1 expressions; CI, confidence interval; IMDC, International Metastatic Renal Cancer Database Consortium; PFS, progression free survival; IS, Immunoscore.
Limitations of our study should be noticed. Firstly, possible selection bias may exist due to the retrospective design of the study and limited sample volume. Secondly, some tumor samples acquired from biopsy were too small to evaluate the expression of immune checkpoint associated molecules and TILs. Thirdly, determination of PD-L1 expression via immunohistochemistry using various antibodies makes it difficult to clearly define the threshold[24]. Further researches are needed to validate our conclusion in larger sample volumes.
Conclusions
In summary, IS is a powerful independent prognostic factor for OS and PFS in patients with mRCC treated with TKI. The presented IS can be used as essential complement to IMDC for prognosis prediction in mRCC patients. However, further researches are needed to validate our conclusion in larger sample volumes, and to facilitate the search for novel therapeutic strategies for mRCC, and improve prognosis of patients with mRCC patients.
Supplementary Material
Supplementary figures and tables.
Ethics Approval
Ethical ratification was authorized by the Clinical Research Ethics Committee of Zhongshan Hospital, Fudan University (Shanghai, China) with the approval number B2016-161R and informed consent was obtained from each patient.
Acknowledgements
We thank Ms. Jun Hou and Ms. Haiying Zeng (Department of Pathology, Zhongshan Hospital, Fudan University) for pathologic review, IHC staining evaluation and technical assistance. This study was funded by grants from National Natural Science Foundation of China (81772696, 81472376).
Competing Interests
The authors have declared that no competing interest exists.
References
1. Siegel RL, Miller KD, Jemal A. et al. Cancer statistics, 2016. CA Cancer J Clin. 2016;66:7-30
2. Dabestani S, Thorstenson A, Lindblad P. et al. Renal cell carcinoma recurrences and metastases in primary non-metastatic patients: a population-based study. World J Urol. 2016;34:1081-1086
3. Srinivasan R, Ricketts CJ, Sourbier C. et al. New strategies in renal cell carcinoma: targeting the genetic and metabolic basis of disease. Clin Cancer Res. 2015;21:10-17
4. Albiges L, Choueiri T, Escudier B. et al. A systematic review of sequencing and combinations of systemic therapy in metastatic renal cancer. Eur Urol. 2015;67:100-110
5. Tanaka N, Mizuno R, Ito K. et al. External Validation of the MSKCC and IMDC Risk Models in Patients Treated with Targeted Therapy as a First-line and Subsequent Second-line Treatment: A Japanese Multi-institutional Study. European urology focus. 2016;2:303-309
6. Heng DY, Xie W, Regan MM. et al. Prognostic factors for overall survival in patients with metastatic renal cell carcinoma treated with vascular endothelial growth factor-targeted agents: results from a large, multicenter study. J Clin Oncol. 2009;27:5794-5799
7. Kawakami F, Sircar K, Rodriguez-Canales J. et al. Programmed cell death ligand 1 and tumor-infiltrating lymphocyte status in patients with renal cell carcinoma and sarcomatoid dedifferentiation. Cancer. 2017;123:4823-4831
8. Shin SJ, Jeon YK, Kim PJ. et al. Clinicopathologic Analysis of PD-L1 and PD-L2 Expression in Renal Cell Carcinoma: Association with Oncogenic Proteins Status. Ann Surg Oncol. 2016;23:694-702
9. Moch H, Cubilla AL, Humphrey PA. et al. The 2016 WHO Classification of Tumours of the Urinary System and Male Genital Organs-Part A: Renal, Penile, and Testicular Tumours. Eur Urol. 2016;70:93-105
10. Delahunt B, Cheville JC, Martignoni G. et al. The International Society of Urological Pathology (ISUP) grading system for renal cell carcinoma and other prognostic parameters. Am J Surg Pathol. 2013;37:1490-1504
11. Eisenhauer EA, Therasse P, Bogaerts J. et al. New response evaluation criteria in solid tumours: revised RECIST guideline (version 1.1). Eur J Cancer. 2009;45:228-247
12. Hara T, Miyake H, Fujisawa M. Expression pattern of immune checkpoint-associated molecules in radical nephrectomy specimens as a prognosticator in patients with metastatic renal cell carcinoma treated with tyrosine kinase inhibitors. Urol Oncol. 2017;35:363-369
13. Venur VA, Joshi M, Nepple KG. et al. Spotlight on nivolumab in the treatment of renal cell carcinoma: design, development, and place in therapy. Drug Des Devel Ther. 2017;11:1175-1182
14. Beckermann KE, Johnson DB, Sosman JA. PD-1/PD-L1 blockade in renal cell cancer. Expert Rev Clin Immunol. 2017;13:77-84
15. Albiges L, Fay AP, Xie W. et al. Efficacy of targeted therapies after PD-1/PD-L1 blockade in metastatic renal cell carcinoma. Eur J Cancer. 2015;51:2580-2586
16. Baine MK, Turcu G, Zito CR. et al. Characterization of tumor infiltrating lymphocytes in paired primary and metastatic renal cell carcinoma specimens. Oncotarget. 2015;6:24990-25002
17. George DJ, Martini JF, Staehler M. et al. Immune Biomarkers Predictive for Disease-Free Survival with Adjuvant Sunitinib in High-Risk Locoregional Renal Cell Carcinoma: From Randomized Phase III S-TRAC Study. Clin Cancer Res. 2018;24:1554-1561
18. Fridman WH, Pages F, Sautes-Fridman C. et al. The immune contexture in human tumours: impact on clinical outcome. Nat Rev Cancer. 2012;12:298-306
19. Becht E, Giraldo NA, Dieu-Nosjean MC. et al. Cancer immune contexture and immunotherapy. Curr Opin Immunol. 2016;39:7-13
20. Weiss JM, Gregory Alvord W, Quinones OA. et al. CD40 expression in renal cell carcinoma is associated with tumor apoptosis, CD8(+) T cell frequency and patient survival. Hum Immunol. 2014;75:614-620
21. Sharpe K, Stewart GD, Mackay A. et al. The effect of VEGF-targeted therapy on biomarker expression in sequential tissue from patients with metastatic clear cell renal cancer. Clin Cancer Res. 2013;19:6924-6934
22. Mlecnik B, Bindea G, Angell HK. et al. Integrative Analyses of Colorectal Cancer Show Immunoscore Is a Stronger Predictor of Patient Survival Than Microsatellite Instability. Immunity. 2016;44:698-711
23. Topalian SL, Drake CG, Pardoll DM. Immune checkpoint blockade: a common denominator approach to cancer therapy. Cancer Cell. 2015;27:450-461
24. Gandini S, Massi D, Mandala M. PD-L1 expression in cancer patients receiving anti PD-1/PD-L1 antibodies: A systematic review and meta-analysis. Crit Rev Oncol Hematol. 2016;100:88-98
Author contact
![]() Corresponding authors: Xiao-Yi Hu, Department of Urology, Zhongshan Hospital, Fudan University, Shanghai 200032, China. E-mail: hu.xiaoyish.cn or Jian-Ming Guo, Department of Urology, Zhongshan Hospital, Fudan University, Shanghai 200032, China. E-mail: guo.jianmingsh.cn.
Corresponding authors: Xiao-Yi Hu, Department of Urology, Zhongshan Hospital, Fudan University, Shanghai 200032, China. E-mail: hu.xiaoyish.cn or Jian-Ming Guo, Department of Urology, Zhongshan Hospital, Fudan University, Shanghai 200032, China. E-mail: guo.jianmingsh.cn.
Citation styles
APA
Yao, J.X., Chen, X., Xi, W., Zhu, Y.J., Wang, H., Hu, X.Y., Guo, J.M. (2018). Immunoscore System for Predicting Clinical Outcome of Metastatic Renal Cell Carcinoma Patients Treated with Tyrosine Kinase Inhibitors. Journal of Cancer, 9(22), 4099-4107. https://doi.org/10.7150/jca.27408.
ACS
Yao, J.X.; Chen, X.; Xi, W.; Zhu, Y.J.; Wang, H.; Hu, X.Y.; Guo, J.M. Immunoscore System for Predicting Clinical Outcome of Metastatic Renal Cell Carcinoma Patients Treated with Tyrosine Kinase Inhibitors. J. Cancer 2018, 9 (22), 4099-4107. DOI: 10.7150/jca.27408.
NLM
Yao JX, Chen X, Xi W, Zhu YJ, Wang H, Hu XY, Guo JM. Immunoscore System for Predicting Clinical Outcome of Metastatic Renal Cell Carcinoma Patients Treated with Tyrosine Kinase Inhibitors. J Cancer 2018; 9(22):4099-4107. doi:10.7150/jca.27408. https://www.jcancer.org/v09p4099.htm
CSE
Yao JX, Chen X, Xi W, Zhu YJ, Wang H, Hu XY, Guo JM. 2018. Immunoscore System for Predicting Clinical Outcome of Metastatic Renal Cell Carcinoma Patients Treated with Tyrosine Kinase Inhibitors. J Cancer. 9(22):4099-4107.
This is an open access article distributed under the terms of the Creative Commons Attribution (CC BY-NC) license (https://creativecommons.org/licenses/by-nc/4.0/). See http://ivyspring.com/terms for full terms and conditions.