Journal of Cancer
ISSN: 1837-9664
3.2
Impact Factor
ISSN: 1837-9664

 Global reach, higher impact
J Cancer 2018; 9(21):4072-4086. doi:10.7150/jca.26399 This issue Cite
Research Paper
Cytoplasmic SQSTM1/ P62 Accumulation Predicates a Poor Prognosis in Patients with Malignant Tumor
Linhai Zhu1*, Yiqing Wang1*, Jing He2*, Jie Tang1, Wang Lv1, Jian Hu1 ![]()
1. Department of Thoracic Surgery, The First Affiliated Hospital, School of Medicine, Zhejiang University, Hangzhou 310003, China.
2. Shandong University of Traditional Chinese Medicine, Jinan 250355, China.
* Equal Contribution
Received 2018-3-31; Accepted 2018-8-23; Published 2018-10-18
Citation:
Zhu L, Wang Y, He J, Tang J, Lv W, Hu J. Cytoplasmic SQSTM1/ P62 Accumulation Predicates a Poor Prognosis in Patients with Malignant Tumor. J Cancer 2018; 9(21):4072-4086. doi:10.7150/jca.26399. https://www.jcancer.org/v09p4072.htm
Other stylesAbstract
Aims: SQSTM1/p62, as an autophagy marker, is a key molecule involved in the autophagy process. Recent studies have demonstrated that p62 has a close relationship with tumorigenesis and progression, but the impact of p62 on patients' survival has not been comprehensively understood. Therefore, we conducted this study to assess the expression level of p62 in tumor cells and the prognostic role of p62 expression in various malignant tumors.
Methods: We searched PubMed, PubMed Central (PMC), Embase, Ovid and Web of Science databases and identified 30 eligible studies containing 14,072 patients to include in the meta-analysis. The p62 mRNA and protein expression profiles in various tumor tissues and normal tissues were presented according to the Human Protein Atlas (HPA) and the Gene Expression Profiling Interactive Analysis (GEPIA). We also tested the association between p62 mRNA level and patients' survival based on the Cancer Genome Atlas (TCGA) and the Human Protein Atlas (HPA) databases.
Results: The expression levels of p62 mRNA and protein varied in different tissues. The p62 proteins were elevated and mainly located in the cytoplasm in some types of tumor compared with the normal tissues. The pooled results indicated that p62 overexpression in tumor tissues was associated with a worse prognosis. In the subgroup analysis, a significant relationship was observed between cytoplasmic p62 accumulation and both overall survival (HR 1.53, 95% CI: 1.03-2.27, P < 0.05) and disease-specific survival (HR 1.60, 95% CI: 1.15-2.24, P < 0.01). The relationship between p62 and worse survival was more evident in early stage tumors. P62 mRNA expression had no significant effect on the patient's survival except of liver cancer.
Conclusions: The findings of this meta-analysis highlight the role of p62 as a useful prognostic biomarker for some types of tumor according to different clinicopathologic features, which may contribute to the selection of effective treatment methods for different malignant tumors.
Keywords: SQSTM1/p62, malignant tumor, prognosis
Introduction
Malignant tumors have been a major cause of death in economically developed countries and are expected to grow across the world because of the aging of the population [1]. It is estimated that 14.1 million new cancer cases and 8.2 million cancer deaths occurred in 2012 worldwide [1]. Despite significant advances in diagnosis and therapy, the prognosis of most malignant tumors is still unfavorable. The effective treatment of cancer relies heavily on better understanding the mechanism of the carcinogenesis, and discovering suitable tumor biomarkers to indicate the exact individualized therapy.
Macroautophagy (hereinafter referred to as autophagy) is a conserved programmed cell survival mechanism which refers to a basic catabolic process that delivers damaged intracellular organelles or proteins to the lysosomes for subsequent degradation and recycling of substrates in order to maintain cellular homeostasis [2]. The dysregulation of autophagy is involved in a broad spectrum of diseases, such as cancer, heart diseases and neurodegeneration diseases [3-5]. We can speculate that autophagy might play a paradoxical role in cancer according to its basic function. In early stage, autophagy may serve as a tumor suppressor by eliminating the defective organelles or toxic proteins, which may produce free radicals to cause genomic instability [6]. But in late stage, autophagy allows cancer cells to survive, invade, metastasize and evade cell death by eliminating deleterious cellular components and recycling nutrients in response to various stresses [7]. Exploiting autophagy for predictive biomarkers and anti-cancer therapeutic targets has become a field gaining ever increasing attention. However, until now, the exact role of autophagy in cancer is still unclear.
Mammalian sequestosome 1 (SQSTM1, hereinafter referred to as p62), is identified as an adaptor protein and functions in assembling protein complexes by several binding motifs [8]. Recently, p62 is considered as an indicator of functional basal autophagy [9]. P62 localizes at the autophagosomal membranes and works as an autophagy receptor through interacting with microtubule-associated protein 1 light chain 3 B (LC3B) and ubiquitinated cargoes [10]. During the process of autophagy flux, p62 itself is constantly degraded with the ubiquitinated substrates [11]. Thus, reduced p62 reflect active autophagy and conversely impaired autophagy can be indicated by an associated accumulation of p62 [12]. Exploring the role of p62 in cancer can promote a better understanding of the relationship between autophagy and cancer. However, there is still a lot of confusion about the clinical significance of p62 in most malignant tumors nowadays.
This study is conducted to investigate the differences of p62 expression level between tumor tissues and normal tissues, and the prognostic value of p62 in certain types of tumor. Ultimately, our results indicated that p62 protein elevated and mainly located in the cytoplasm in tumor cells in comparison with that in normal cells, and the cytoplasmic p62 accumulation predicated a poor prognosis in some types of malignant tumor.
Materials and methods
Search strategy
This meta-analysis was conducted based on the Preferred Reporting Items for Systematic Reviews and Meta-Analyses guidelines (PRISMA) [13]. PubMed, PubMed Central (PMC), Embase, Ovid and Web of Science databases were used for literature search. The following keywords were employed: “sequestosome 1 or SQSTM1 or p62”, “cancer or tumor or carcinoma” and “prognosis or outcome or survival”. The latest search was carried out on July 1, 2018. We also consulted the references of identified articles for all relevant studies.
Selection criteria
Eligible study was enrolled in this meta-analysis in line with the following criteria: (1) p62 expression was detected in tumor tissues; (2) the outcomes of interest were in terms of overall survival (OS), disease-free survival (DFS), progression-free survival (PFS), recurrence-free survival (RFS), metastasis-free survival (MFS) or disease-specific survival (DSS); and (3) sufficient data to estimate the hazard ratio (HR) and its 95% confidence intervals (CI) according to the p62 expression was reported. When the same patient cohort was reported in more than one study, the complete or the most recent one was selected. The exclusion criteria were following: (1) Articles without adequate survival data for extracting HRs and corresponding 95% CIs; (2) Articles in non-English; and (3) Reviews, summary of meeting, case reports, letters to the editor and non-human trials. Titles and abstracts of the identified articles were screened, and then comprehensive evaluation was carried out by viewing the full text carefully. Any disagreement was resolved via consensus.
Data extraction and quality assessment
Two reviewers independently extracted relevant information from all eligible studies. The following items were extracted: first author's name, publication year, country of origin, study recruitment years, period of follow-up, tumor type, staining pattern, age at the time of diagnosis, patients' gender, tumor stage, sample size, detection method, cutoff value and assessments of outcomes. HR and the corresponding 95% CI of the high p62 expression group versus the low one for OS, PFS, DFS or DSS were also collected as applicable. If the survival outcomes were presented by both univariate and multivariate analyses, we chose the result of multivariate analysis. For studies in which HRs was not provided explicitly, we extracted the survival estimates from the original data or Kaplan-Meier curves using the Tierney's methods [14]. The level of p62 expression in tumor tissues and normal tissues was also extracted from the articles.
The quality of each study was assessed according to the Newcastle-Ottawa Scale (NOS) [15]. The NOS evaluates a study in three domains including selection of participants, comparability of study groups and the ascertainment of outcomes with the score ranged from 0 to 9. A study achieving a score of six or more was deemed as a high quality one.
P62 mRNA and protein expression profiles in various tumor tissues and normal tissues according to the Human Protein Atlas (HPA) and the Gene Expression Profiling Interactive Analysis (GEPIA)
The p62 mRNA and protein expression in different normal human tissues were generated in the HPA project (https://www.proteinatlas.org). RNA-seq results are reported as Fragments per Kilo-base of exon per Million reads (FPKM). The score of protein expression is based on the staining intensity and fraction of stained cells and describes the level of antibody staining observed in the annotated cell types as not detected, low, medium or high.
The p62 mRNA expression profile across all tumor samples and paired normal tissues were generated in GEPIA (http://gepia.cancer-pku.cn/index.html). The RNA-seq results are reported as number of transcripts per million (TPM).
P62 mRNA expression and patient survival in various tumors according to the Cancer Genome Atlas (TCGA) and the Human Protein Atlas (HPA)
The correlation between p62 expression at the mRNA level and patients survival in various tumors was examined based on the data from TCGA database (https://cancergenome.nih.gov/). The FPKMs (number Fragments per Kilo-base of exon per Million reads) were used for quantification of p62 mRNA level.
The prognosis of patients grouped by p62 mRNA expression was examined by Kaplan-Meier survival estimators, and the survival outcomes of the two groups were compared by log-rank tests. The median and maximally separated Kaplan-Meier curves are drew by the HPA. The log-rank P values less than 0.001 in maximally separated Kaplan-Meier analysis were considered significant statistically.
Statistical analysis
The overexpression of p62 was defined according to the cutoff values provided by the original studies. Pooled HRs and 95% CIs were used to assess the relationship between p62 overexpression and prognosis of patients. Heterogeneity of HRs across the studies was evaluated using I-squared statistics [16]. I2 > 50% indicated a statistically significant heterogeneity, which allowed the use of a random-effect model. Otherwise, a fixed-effect model was applied. To explore the possible sources of heterogeneity and further investigate the relationship between the p62 overexpression and survival of patients with different clinicopathological features, subgroup analyses were adopted. We also performed sensitivity analyses by omission of each single study to evaluate stability of the results. Potential publication bias was assessed by the Begg's funnel plot and Egger's test. STATA software version 12.0 (Stata Corporation, TX, USA) was utilized in this meta-analysis. In the process of meta-analysis, P < 0.05 was considered statistically significant.
Results
Study characteristics
According to the searching strategy described in the materials and methods, 9,655 articles were initially retrieved. Among them, 9,324 were excluded by screening the titles and abstracts, and then, 296 were excluded by the full-texts. At last, 30 articles met the inclusion criteria and were included into the meta-analysis after further evaluation. In addition, 5 studies reporting mean survival time of cancer patients were listed separately. The flow chart of the study search and selection process is reported in Figure 1.
The main features of the 30 included studies are summarized in Table 1. A total of 14,072 patients from China, Germany, Japan, Korea, Norway, Switzerland, UK, and USA were diagnosed with various tumors, including breast cancer, colorectal cancer, endometrial cancer, epithelial ovarian cancer, esophageal cancer, gastric cancer, glioma, hepatocellular carcinoma, hypopharyngeal squamous cell carcinoma, lacrimal gland adenoid cystic carcinoma, melanoma, non-small cell lung cancer (NSCLC), oral squamous cell carcinoma, pancreatic cancer, prostate cancer, soft tissue sarcoma, thyroid cancer, and nasopharyngeal cancer. All of the studies were designed retrospectively and the year published ranged from 2007-2018. We selected OS, PFS and DSS as the main survival outcomes of all eligible studies for our meta-analysis. The quality of the 30 eligible studies enrolled in our meta-analysis was evaluated according to the NOS. The quality of the eligible studies ranged from 5 to 7, with a mean of 6.97. The main characteristics of another 5 studies reporting mean survival time were listed in Table 3. Four studies represented the survival time as mean with 95% CI, and 1 study reported as mean ± standard deviation (SD). The cut-off values of p62 varied in different studies.
Table 1
Main characteristics of studies included in the meta-analysis
| Author | Year | Country | Study recruitment years | Follow-up time (months) | Tumor type | Staining pattern | Age (years),mean | Gender (M/F) | Stage | Sample size (n) | Detection method | Cutoff | Outcomes | NOS score |
|---|---|---|---|---|---|---|---|---|---|---|---|---|---|---|
| Yang Q [33] | 2018 | China | NA | Median 50.86, range (12.93-72.23) | Nasopharyngeal | Whole cell | 73 (≤50); 43(>50) | 85/31 | I-II 13; III-IV 103 | 116 | IHC (Santa Cruz) | Score>3 | MFS; OS | 6 |
| Terabe T [34] | 2017 | Japan | 1997-2009 | NA | Oral | Whole cell | 38 (≤65); 33(>65) | 40/31 | I-II 37; III-IV 34 | 71 | IHC (Abcam) | >1% | RFS; DSS | 6 |
| Xu LZ [35] | 2017 | China | 1999-2008 | NA | Breast cancer | Whole cell | Median 48 | Female 369 | I 76, II 173, III 117, IV 2 | 369 | IHC (NA) | NA | OS, DFS | 8 |
| Arai A [36] | 2017 | Japan | 1997-2008 | Max 120 | Hypopharyngeal | Whole cell | Mean 65.1 range (45-81) | 47/7 | I 4; II 6; III 4; IV 40 | 54 | IHC (MBL) | NA | DFS | 5 |
| Nakayama S [37] | 2017 | Japan | 2000-2006 | Mean 69.8 (range,2-131) | Colorectal | Cytoplasm | NA | 71/47 | I-II 63; III-IV 55 | 118 | IHC (MBL) | >10% | OS | 7 |
| Niklaus M [38] | 2017 | Germany | 1993-2005 | NA | Colon | Cytoplasm | Median 66 range (25-91) | 160/132 | NA | 292 | IHC (LabForce) | Score≥1 | OS | 6 |
| Tang DY [39] | 2016 | UK | NA | NA | Melanoma | Whole cell | NA | NA | II 75 | 75 | IHC (NA) | ≥20% | DFS | 6 |
| Schlafli AM [40] | 2016 | Switzerland | 1988-2008 | NA | NSCLC | Whole cell; cytoplasm; nucleus | Median 67 range (39-83) | 343/123 | I-II | 466 | IHC (MBL) | Score>1 | OS; RFS | 7 |
| Cao QH [17] | 2016 | China | 2002-2006 | NA | Gastric | Whole cell | ≥58 174; <58 178 | 235/117 | I 41; II 83; III 192; IV 38 | 352 | IHC (MBL) | Score>8 | OS | 7 |
| Schmitz KJ [41] | 2016 | Germany | 1996-1998 | Minimum 60 | Colorectal | Cytoplasm; nucleus | Mean 68.19 range (39-91) | 66/61 | I-II 65; III-IV 62 | 126 | IHC (Santa Cruz) | NA | DSS | 8 |
| Adams O [42] | 2016 | Switzerland | 1991-2011 | NA | Esophageal | Whole cell; cytoplasm; nucleus | Median 69 range (32-89) | 100/16 | I 35; II 25; III 51; IV 5 | 116 | IHC (MBL) | Score≥1 | OS | 7 |
| Masuda GO [43] | 2016 | Japan | NA | Max 60 | Gastric | Whole cell | Median 66 range (21-88) | 290/220 | I 250; II 76; III 108; IV 76 | 510 | IHC (MBL) | >20% | OS | 8 |
| Jiang X [19] | 2015 | China | 1999-2003 | 120 | Prostate | Whole cell | Mean 69 range (52-85) | 111/0 | I-II 61; III 50 | 111 | IHC (Enzo) | Score≥4 | OS | 7 |
| Iwadate R [44] | 2015 | Japan | 1990-2007 | Median 98, range (61-235) | Endometrial | Cytoplasm | NA | 0/194 | I 143; II 12; III 32; IV 7 | 194 | IHC (Santa Cruz) | ≥10% | OS | 8 |
| Wang X [45] | 2015 | China | 2006-2009 | Mean 48.5, range (3-96.5) | NSCLC | Cytoplasm | NA | 70/34 | I-IV | 104 | IHC (Abcam) | Score≥4 | OS | 7 |
| Burdelski C [46] | 2015 | Germany | 1992-2012 | Median 36, range (1-241) | Prostate | Cytoplasm | NA | 7822/0 | pT2-pT4 | 7822 | IHC (Abcam) | NA | OS | 8 |
| Zhao M [47] | 2015 | China | 2009-2013 | 6-60 | Glioma | Cytoplasm | 47.8±16.4 | 45/30 | NA | 75 | IHC (Santa Cruz) | Score≥3 | PFS; OS | 6 |
| Liu JL [26] | 2014 | China | 2003-2008 | NA | Oral | Cytoplasm; nucleus | 55.57 ± 11.97 | 187/8 | I-IV | 195 | IHC (Abcam) | Score≥100(cytoplasm);Score≥140(nucleus) | OS; DSS; RFS | 8 |
| Ellis RA [48] | 2014 | UK | NA | 84 | Melanoma | Whole cell | NA | NA | I-IV | 121 | IHC (NA) | ≥20% | DFS; DSS; OS | 7 |
| Iwadate R [49] | 2014 | Japan | 1986-2006 | Average 59, range (1-120) | Ovarian | Cytoplasm | 107 ≤50 years, 159 >50 years | 0/266 | I 150; II 281; III-IV 69 | 266 | IHC (Santa Cruz) | ≥10% | OS | 8 |
| Jin GZ [50] | 2013 | China | 1996-2011 | Median 33, range (0.3-141) | Hepatocellular | Whole cell | 50.1 ± 10.9 | 430/70 | I 150; II 281; III-IV 69 | 500 | IHC (Sigma) | >25% | RFS; OS | 8 |
| Inui T [51] | 2013 | Japan | NA | NA | Oral | Whole cell | Median 64.8, range (27-92) | 32/22 | NA | 47 | IHC (MBL) | >20% | DSS | 5 |
| Kim SK [52] | 2013 | Korea | 2000-2008 | NA | Breast | Whole cell | 40.2 ± 12.3 | 0/204 | NA | 204 | IHC (Abcam) | Score≥2 | DFS; OS | 7 |
| Luo RZ [53] | 2013 | China | 2000-2008 | Median 112, range (15-145) | Breast | Whole cell | Median 47, range (22-79) | 0/163 | I-II 121; III 42 | 163 | IHC (Santa Cruz) | Score≥2 | DFS; OS | 7 |
| Park JM [54] | 2013 | USA | NA | NA | Colorectal | Whole cell | Median 63.5, range (26-81) | 99/79 | II 32; III 146 | 178 | IHC (MBL) | ≥50% | OS | 7 |
| Chio J [55] | 2013 | Korea | 2002-2003 | NA | Breast | Cytoplasm; nucleus | 48.6 ± 10.5 | 0/489 | NA | 489 | IHC (Abcam) | Score≥2(cytoplam);>10%(nucleus) | DFS; OS | 8 |
| Sorbye SW [56] | 2012 | Norway | 1973-2006 | NA | Soft tissue sarcomas | Whole cell | Mean 55, range (0-89) | 81/112 | NA | 187 | IHC (BD) | Score≥0.33 | DSS | 7 |
| Inoue D [57] | 2012 | Japan | 1993-1995 | Mean 54.2, range (0.5-112) | NSCLC | Cytoplasm | Mean 65.6, range (23-82) | 78/31 | I 69; II-III 40 | 109 | IHC (Progen) | >10% | DSS | 6 |
| Kim S [58] | 2012 | Korea | 2000-2005 | 59.2±27.9 | Breast cancer | Cytoplasm; nucleus | 47.3±12.1 | Female 119 | NA | 119 | IHC (Abcam) | Score≥2 | OS, DFS | 6 |
| Rolland P [59] | 2007 | UK | 1987-1998 | Median 76 | Breast | Cytoplasm | ≤70 | 0/523 | NA | 523 | IHC (INC) | >5% | DSS | 8 |
NA, not acquired; M, male; F, female; NSCLC, non-small cell lung cancer; IHC, immunohistochemistry; OS, overall survival; MFS, metastasis free survival; DFS, disease free survival; DSS, disease-specific survival; RFS, relapse free survival; PFS, progression free survival
P62 mRNA and protein expression profiles in various tumor tissues and normal tissues
The p62 mRNA and protein expression in different normal human tissues were generated according to the HPA. The p62 mRNA expressed in all normal tissues and the FPKM varied among different tissues (Fig. 2). Most normal tissues displayed moderate to strong cytoplasmic and nuclear p62 protein positivity, while cells in brain and cardiovascular system were weakly stained or negative (Fig. 2).
Figure 1
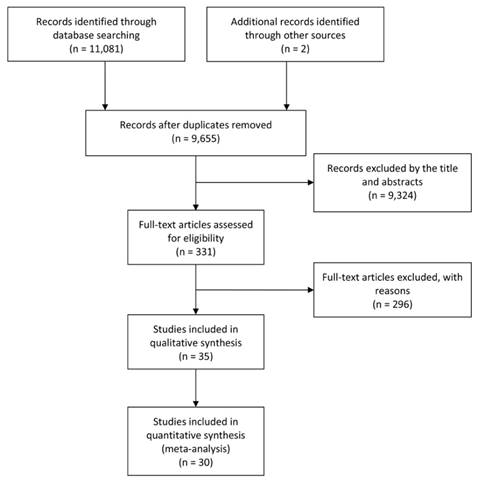
Flow diagram of the study selection process.
According to the data generated in GEPIA, the expression of p62 mRNA was significantly higher in diffuse large B-cell lymphoma (DLBC), liver hepatocellular carcinoma (LIHC), pancreatic adenocarcinoma (PAAD), skin cutaneous melanoma (SKCM), and thymoma (THYM) than in their corresponding normal tissues (Fig. 3A-B). However, the p62 mRNA levels were lower in acute myeloid leukemia (LAML) in comparison with normal tissues (Fig. 3A-B).
The differences of p62 protein expression in tumor tissues and normal tissues were also tested based on the literature review (Table 2). Among the 29 studies, twenty-five studies indicated that the expression of p62 protein was lower in normal tissues than in tumor tissues, which included breast cancer, colon adenocarcinoma, colorectal cancer, gastric cancer, melanoma, prostate cancer, oral squamous cell carcinomas, ovarian cancer, pancreatic cancer, head and neck carcinoma, glioblastoma and hepatocellular cancer (Table 2). Two authors thought p62 protein level was lower in the colorectal cancer and gastric cancer compared with corresponding normal tissues [17, 18]. Another two authors thought there was no significant difference of p62 protein level between tumor tissues and normal tissues in prostate cancer and glioblastoma [19, 20].
Association between p62 expression and overall survival (OS)
Twenty-two articles included 12,813 patients were collected to evaluate the relationship between p62 expression and OS. The random-effects model was employed because obvious heterogeneity was found in the meta-analysis (I2 = 79.9%, P < 0.01). The pooled HR revealed that p62 over-expression was associated with a worse prognosis compared with the low expression group (HR 1.50, 95% CI: 1.17-1.93, P < 0.05) (Fig. 4A).
Given the significant heterogeneity in the meta-analysis involving all 20 studies, we performed a series of subgroup analyses to estimate the possible correlation between p62 expression and OS based on three main features, including tumor stage, staining pattern, and tumor type. The first subgroup analysis was evaluated according to tumor stage. We observed that p62 over-expression in early stage tumor was related to worse OS (HR 1.85, 95% CI: 1.24-2.76, P < 0.01) with no heterogeneity in the data (I2 = 0.0%, P = 0.668). As for late stage subgroup, there was only one study indicating no association between p62 expression and OS in colorectal cancer (Fig. 4B). Subgroup analysis based on staining pattern showed that high p62 expression in cytoplasm was associated with poor OS (HR 1.53, 95% CI: 1.03-2.27, P < 0.05) whereas p62 over-expression in nucleus was not statistically associated with OS (HR 0.98, 95% CI: 0.49-1.97, P = 0.965) (Fig. 4C). In the subgroup analysis of OS by tumor type, we found that high p62 level was associated with poor OS of patients with nasopharyngeal cancer (HR 3.92, 95% CI: 1.74-8.82, P < 0.01), non-small cell lung cancer (HR 2.93, 95% CI: 1.30-6.59, P < 0.01), prostate cancer (HR 1.62, 95% CI: 1.33-1.97, P < 0.01), glioma (HR 2.32, 95% CI: 1.03-5.20, P < 0.05), oral squamous cell carcinoma (HR 1.76, 95% CI: 1.17-2.63, P < 0.01), and epithelial ovarian cancer (HR 2.33, 95% CI: 1.43-3.79, P < 0.01) (Fig. 4D). In esophageal cancer, high p62 level indicated a better OS (HR 0.55, 95% CI: 0.33-0.91, P < 0.05) with only one study included. In other types of cancer such as colorectal cancer, gastric cancer, endometrial cancer, melanoma and breast cancer, p62 expression was not associated with the OS (Fig. 4D). The separate articles reporting mean survival time indicated that p62 expression had no effect on the OS in papillary thyroid carcinoma, gastric cancer, colorectal cancer, pancreatic cancer, and breast cancer (Table 3).
Figure 2
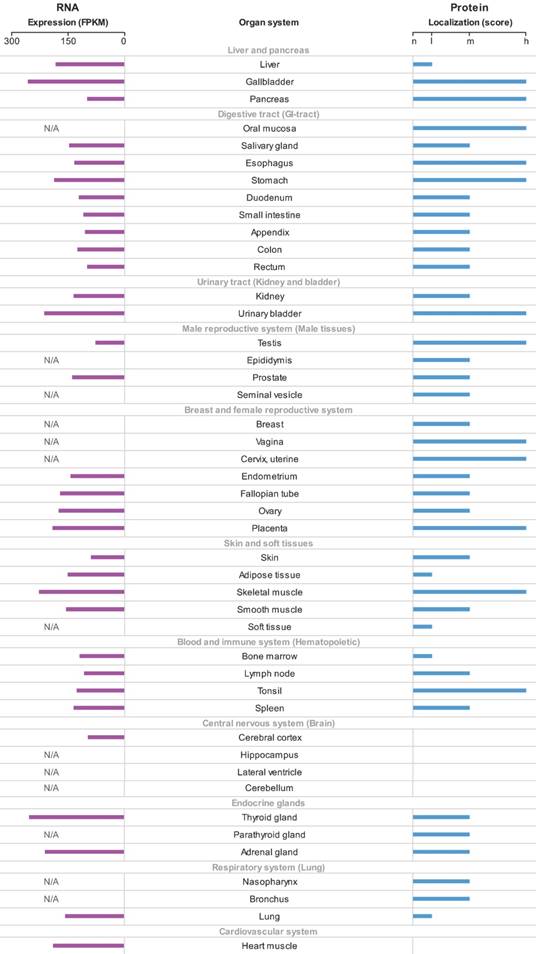
The overview of p62 mRNA and protein expression in different normal human tissues. The data were generated in the Human Protein Atlas project (HPA). RNA-seq results generated in HPA are reported as Fragments per Kilo-base of exon per Million reads (FPKM). The score of protein expression describes the level of antibody staining observed in the annotated cell types as not detected (n), low (l), medium (m) or high (h). It is based on the staining intensity and fraction of stained cells. N/A not acquired.
Figure 3
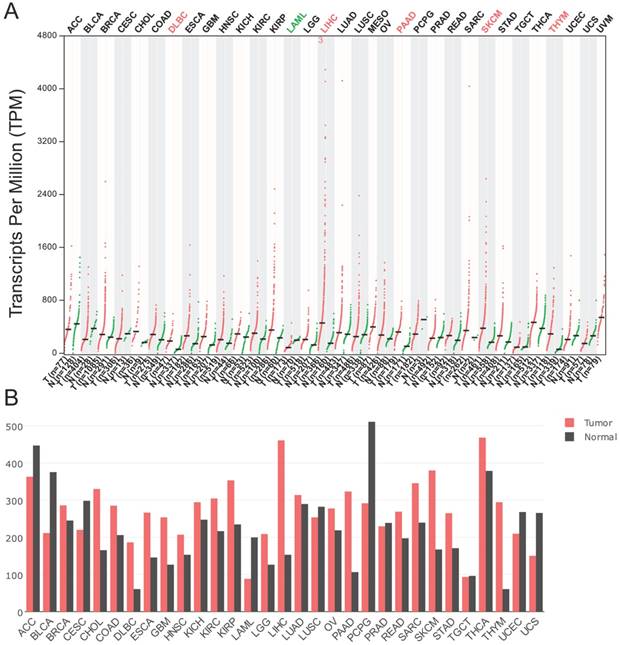
The p62 mRNA expression profile across all tumor samples and paired normal tissues. The data were generated in the Gene Expression Profiling Interactive Analysis project (GEPIA). The RNA-seq results are reported as number of transcripts per million (TPM). (A) Dot plot. Each dot represents expression of sample. (B) Bar plot. The height of bar represents the median expression of certain tumor type or normal tissue. ACC, Adrenocortical carcinoma; BLCA, Bladder Urothelial Carcinoma; BRCA, Breast invasive carcinoma; CESC, Cervical squamous cell carcinoma and endocervical adenocarcinoma; CHOL, Cholangio carcinoma; COAD, Colon adenocarcinoma; DLBC, Lymphoid Neoplasm Diffuse Large B-cell Lymphoma; ESCA, Esophageal carcinoma; GBM, Glioblastoma multiforme; HNSC, Head and Neck squamous cell carcinoma; KICH, Kidney Chromophobe; KIRC, Kidney renal clear cell carcinoma; KIRP, Kidney renal papillary cell carcinoma; LAML, Acute Myeloid Leukemia; LGG, Brain Lower Grade Glioma; LIHC, Liver hepatocellular carcinoma; LUAD, Lung adenocarcinoma; LUSC, Lung squamous cell carcinoma; MESO, Mesothelioma; OV, Ovarian serous cystadenocarcinoma; PAAD, Pancreatic adenocarcinoma; PCPG, Pheochromocytoma and Paraganglioma; PRAD, Prostate adenocarcinoma; READ, Rectum adenocarcinoma; SARC, Sarcoma; SKCM, Skin Cutaneous Melanoma; STAD, Stomach adenocarcinoma; TGCT, Testicular Germ Cell Tumors; THCA, Thyroid carcinoma; THYM, Thymoma; UCEC, Uterine Corpus Endometrial Carcinoma; UCS, Uterine Carcinosarcoma; UVM, Uveal Melanoma.
Association between p62 expression and disease-free survival (DFS)
In our analysis, we merged DFS, RFS, MFS and PFS together considering the similarities among them. The effect of p62 expression on DFS was evaluated in 14 studies with 3,212 patients. A random-effect model was used to calculate the pooled HRs and 95% CIs due to the significant heterogeneity among studies (I2 = 67.6%, P<0.01). The pooled results showed that p62 over-expression was associated with poor DFS in patients (HR 1.38, 95% CI: 1.06-1.79, P<0.05) (Fig. 5A).
Given the significant heterogeneity in the meta-analysis involving all 14 studies, we performed a series of subgroup analyses to estimate the possible correlation between p62 expression and DFS based on tumor stage, staining pattern, and tumor type. In the subgroup analysis according to tumor stage, we found that in early stage group, p62 over-expression was related to worse DFS (HR 1.48, 95% CI: 1.11-1.95, P < 0.01) with slight heterogeneity in the pooled data (I2 = 5.5%, P = 0.375) (Fig. 5B). As for late stage group, there was only one eligible study indicating that p62 over-expression was associated poor DFS in hypopharyngeal squamous cell carcinomas (Fig. 5B). In the subgroup analysis of DFS by staining pattern, we found that neither p62 overexpression in cytoplasm (HR 0.84, 95% CI: 0.42-1.67, P = 0.618) nor in nucleus (HR 0.73, 95% CI: 0.36-1.44, P = 0.360) was related to the DFS with significant heterogeneity appearing (Fig. 5C). In the subgroup analysis of DFS by tumor type, an increased p62 expression in tumor was associated with worse DFS of patients with nasopharyngeal cancer (HR 2.87, 95% CI: 1.16-7.12, P < 0.05), hypopharyngeal cancer (HR 2.76, 95% CI: 1.05-7.25, P < 0.05), non-small cell lung cancer (HR 1.66, 95% CI: 1.12-2.45, P < 0.05) and glioma (HR 2.69, 95% CI: 1.14-6.31, P < 0.05) (Fig. 5D). However, in other types of cancer such as breast cancer, hepatocellular carcinoma, melanoma and oral squamous cell carcinoma, there was no significant relationship between p62 expression and DFS statistically (Fig. 5D). In addition, four articles listed in the Table 3 reported that p62 expression was not associated with DFS in papillary thyroid carcinoma, lacrimal gland adenoid cystic carcinoma and breast cancer (Table 3).
Association between p62 expression and disease-specific survival (DSS)
DSS was reported in 8 articles covering 1,379 patients. A low heterogeneity (I2 = 30.6%, P = 0.16) was observed among these studies, so a fixed-effect model was utilized to analyze. The pooled HR for articles assessing the effect of p62 overexpression on DSS was 1.41 (95% CI: 1.16-1.73, P < 0.01) (Fig. 6A).
Subgroup analyses by staining pattern and tumor type were also performed to further explore the possible correlation between p62 expression and DSS in patients with different clinicopathologic features. According to the staining pattern, we observed that high lever p62 in cytoplasm was related to worse DSS (HR 1.60, 95% CI: 1.15-2.24, P < 0.01) with no heterogeneity in the pooled data (I2 = 0.0%, P = 0.621) (Fig. 6B). However, p62 high expression in nucleus was not related to DSS with significant heterogeneity appearing (I2 = 88.2%, P = 0.004) (Fig. 6 B). In the subgroup analysis based on tumor type, pooled results indicated that high p62 level was associated with poor DSS of patients with oral squamous cell carcinoma (HR 2.09, 95% CI: 1.42-3.07, P < 0.01) and non-small cell lung cancer (HR 2.00, 95% CI: 1.08-3.72, P < 0.05) (Fig. 6C). In other types of cancer such as colorectal cancer, melanoma, soft tissue sarcoma and breast cancer, p62 expression was not associated with the DSS significantly (Fig. 6C).
Table 2
Literature review on p62 expression in various normal tissues and tumor tissues.
| Author | Year | Tumor type | Detection method | P62 protein abundance | P value | |
|---|---|---|---|---|---|---|
| N (n) | T (n) | |||||
| Xu LZ [35] | 2017 | Breast | WB (NA) | Low (10) | High (10) | <0.01 |
| Li SS [60] | 2017 | Breast | WB (Santa Cruz; CST) | Low (5) | High (5) | <0.01 |
| Kim SK [52] | 2013 | Breast | IHC (Abcam) | Low (156) | High (16) | <0.05 |
| Tang J [61] | 2012 | Breast | WB (Santa Cruz) | Low (4) | High (4) | NA |
| Thompson HG [62] | 2003 | Breast | WB (Transduction Laboratories) | Low (9) | High (4) | <0.05 |
| Nakayama S [37] | 2017 | Colorectal | IHC (MBL) | Low (28) | High (118) | 0.018 |
| Niklaus M [38] | 2017 | Colon | IHC (LabForce) | Low | High | <0.001 |
| Schmitz KJ [41] | 2016 | Colorectal | IHC (Santa Cruz) | Low (127) | High (127) | NA |
| Mohamed A [23] | 2015 | Colon | IHC (Abcam) | Low (4) | High (45) | NA |
| Park JM [54] | 2013 | Colorectal | IHC (MBL) | Low (171) | High (171) | NA |
| Chang LC [18] | 2013 | Colorectal | IHC (Abcam) | High (83) | Low (83) | <0.05 |
| Cao QH [17] | 2016 | Gastric | WB (MBL); IHC (MBL) | High | Low | NA |
| Masuda GO [43] | 2016 | Gastric | IHC (MBL) | Low | High | NA |
| Mohamed A [23] | 2015 | Gastric | IHC (Abcam) | Low (6) | High (61) | NA |
| Tang DY [39] | 2016 | Melanoma | IHC (NA) | Low | High | <0.01 |
| Ellis RA [48] | 2014 | Melanoma | IHC (NA) | 0.51% (29) | 14.82% (121) | <0.0001 |
| Falasca L [63] | 2015 | Prostate | IHC (MBL) | Low (12) | High (26) | <0.05 |
| Jiang X [19] | 2015 | Prostate | IHC (MBL) | Mainly in the nuclei | Mainly in the cytoplasm | No significance |
| Burdelski C [46] | 2015 | Prostate | IHC (Abcam) | Low | High | NA |
| Giatromanolaki A [64] | 2014 | Prostate | IHC (Abcam) | Low (NA) | High (96) | NA |
| Kitamura H [27] | 2006 | Prostate | IHC (Santa Cruz) | Low and mainly in the nuclei (9) | High and mainly in the cytoplasm (45) | NA |
| Liu JL [26] | 2014 | Oral | IHC (Abcam) | Mainly in the nuclei | Mainly in the cytoplasm | <0.001 |
| Inui T [51] | 2013 | Oral | IHC (MBL) | Low (14) | High (54) | <0.0001 |
| Ju LL [28] | 2016 | Ovarian | IHC (NA) | Low (13) | High (47) | <0.05 |
| Mohamed A [23] | 2015 | Pancreatic | IHC (Abcam) | Low (4) | High (18) | NA |
| Kuo WL [65] | 2014 | Head and neck | IHC (MBL) | Low (76) | High (199) | <0.01 |
| Okada M [20] | 2014 | Ameloblastoma | IHC (MBL) | Positive rate 67% (9) | Positive rate 69% (49) | No significance |
| Giatromanolaki A [66] | 2014 | Glioblastoma | IHC (Abcam); WB (Abcam) | Low | High | NA |
| Jin GZ [50] | 2013 | Hepatocellular | IHC (Sigma) | Low (46) | High (51) | <0.0001 |
NA, not acquired; N, normal tissues; T, tumor tissues; n, number; IHC, immunohistochemistry; WB, western blot
Figure 4
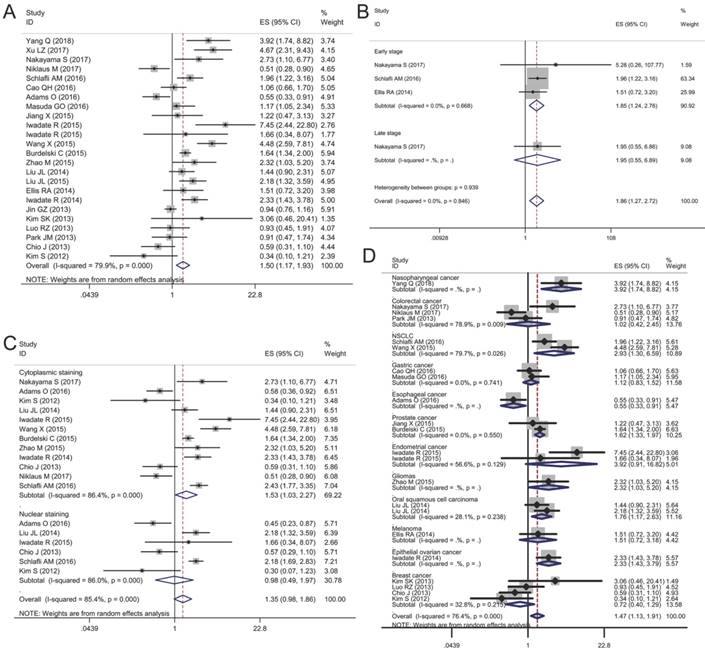
Forest plots of studies evaluating the effect of p62 overexpression on overall survival (OS). (A) P62 overexpression was associated with worse OS in malignant tumors; Subgroup analyses investigating the relationship between p62 overexpression and OS according to (B) tumor stage, (C) staining pattern and (D) tumor type.
Sensitivity analysis and publication bias
Sensitivity analysis was performed to validate the influences of each study on the pooled results of OS, DFS and DSS by omitting each single study sequentially. The results indicated that the synthetic estimates of the effect of p62 overexpression on OS, DFS and DSS did not vary significantly with the omission of any individual study, which meant that the results of this meta-analysis were robust after using the leave-one-out method.
Begg's funnel plot and Egger's test were used to assess the publication bias of these applicable studies. The shapes of funnel plots for OS, DFS, and DSS showed no evidences of obvious asymmetry (Fig. 7A-C). The P-values of Begg's and Egger's tests were all over 0.05 (OS, P = 0.413 for the Begg's test, P = 0.368 for the Egger's test; DFS, P = 0.488 for the Begg's test, P = 0.143 for the Egger's test; DSS, P = 0.283 for the Begg's test, P = 0.728 for the Egger's test). The above results indicated that there was no significant publication bias existing in this meta-analysis.
P62 mRNA expression in tumors and patients' survival
Based on the data from TCGA and HPA, we assessed the association between p62 mRNA expression and OS in various tumors using Kaplan-Meier survival plots (Fig. 8). The association between p62 mRNA expression and OS in various malignant tumors was summarized in Table 4. By generating the median and maximally separated Kaplan-Meier plots, we found that the high p62 mRNA expression group had significant worse OS only in the liver cancer analyzed with maximally separated Kaplan-Meier plots (Fig. 8). In other tumors, p62 mRNA level was not associated with the patients' survival (Table 4).
Discussion
The expression of p62 mRNA and protein varied in different tissues, and in generally, the expression level of p62 protein was higher in malignant tumor tissues in comparison with normal tissues. This study analyzed the expression of p62 on the protein and mRNA levels in various types of tumors and evaluated its prognostic value. Furthermore, we performed subgroup analysis to explore the possible association between p62 expression and survival in tumor patients with different clinicopathologic features. A total of 14,072 tumor patients from 30 individual articles were enrolled in this study and the synthetic results indicated that p62 overexpression significantly predicted worse OS, DFS, and DSS in various tumors as a whole. Furthermore, subgroup analysis showed that the impact of p62 expression on tumor prognosis varied according to the differences in tumor stage, tumor type and p62 location. The adverse effect of p62 overexpression on OS, DFS and DSS was more certain in early stage than that in late stage. P62 accumulation in cytoplasm was associated with worse OS and DSS in various cancers whereas nuclear p62 was less effective. In the subgroup analysis by tumor type, we revealed that p62 overexpression was generally associated with worse survival in certain tumors such as non-small cell lung cancer, nasopharyngeal cancer, oral squamous cell carcinoma, glioma, prostate cancer, epithelial ovarian cancer, hypopharyngeal cancer, and melanoma. There were also 5 articles reporting that p62 expression had not impact on corresponding cancer prognosis separately [21-25]. Considering their small sample size and different presentation style, their results were not synthesized into the meta-analysis.
Figure 5
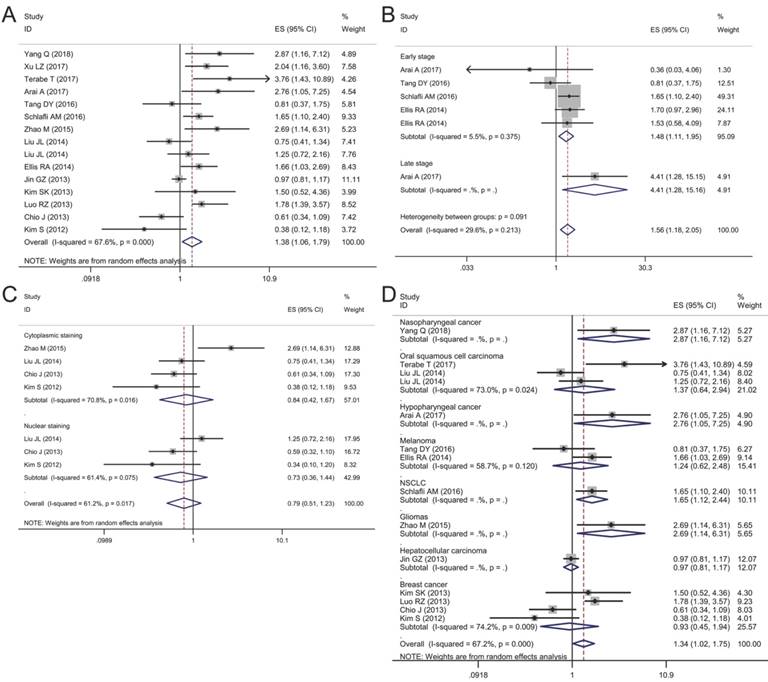
Forest plots of studies evaluating the effect of p62 overexpression on disease-free survival (DFS). (A) P62 overexpression was associated with worse DFS in malignant tumors; Subgroup analyses investigating the relationship between p62 overexpression and DFS according to (B) tumor stage, (C) staining pattern and (D) tumor type.
Figure 6
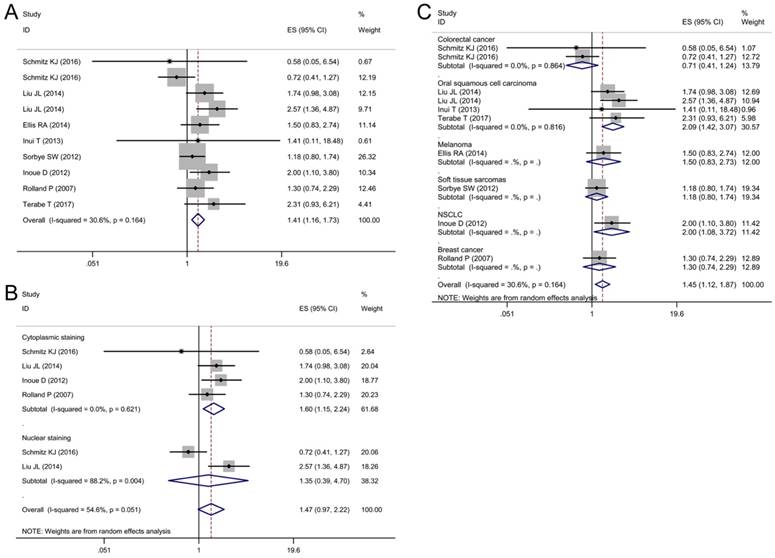
Forest plots of studies evaluating the effect of p62 overexpression on disease-specific survival (DSS). (A) P62 overexpression was associated with worse DSS in malignant tumors; Subgroup analyses investigating the relationship between p62 overexpression and DSS according to (B) staining pattern and (C) tumor type.
Figure 7
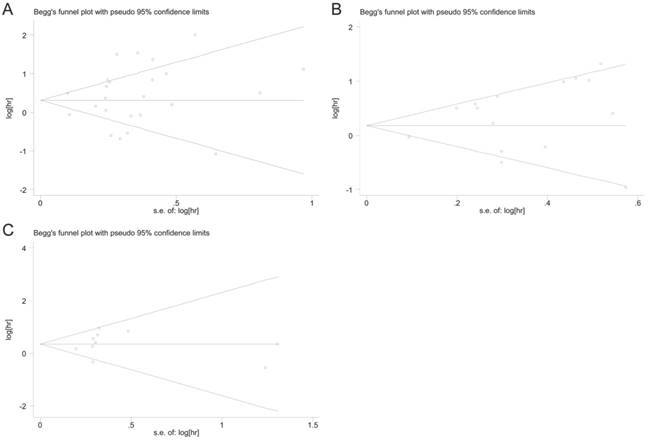
Begg's funnel plots for assessing potential publication bias. (A) Funnel plot analysis for overall survival (OS); (B) Funnel plot analysis for disease-free survival (DFS); (C) Funnel plot analysis for disease-specific survival (DSS).
Table 3
Main characteristics of 5 studies investigating the relationship between p62 expression and tumor prognosis but not combined into the meta-analysis
| Author | Year | Country | Recruitment years | Tumor type | Staining pattern | Age(years) | Gender | Sample size(n) | Detection method | Cutoff | Outcomes | Survival mean (95% CI)/mean±SD months | P value | |
|---|---|---|---|---|---|---|---|---|---|---|---|---|---|---|
| P62 negative | P62 positive | |||||||||||||
| Kim HM [21] | 2017 | Korea | 2012-2013 | Papillary thyroid carcinoma | Whole cell | NA | NA | 342 | IHC (Abcam) | >10% | DFS | 105 (101-109) | 107 (104-110) | 0.643 |
| Kim HM [21] | 2017 | Korea | 2012-2013 | Papillary thyroid carcinoma | Whole cell | NA | NA | 342 | IHC (Abcam) | >10% | OS | 108 (106-111) | 106 (103-109) | 0.14 |
| Koo JS [22] | 2016 | Korea | 1997-2012 | Lacrimal gland adenoid cystic carcinoma | Whole cell | 21-72 | 8/3 | 11 | IHC (Abcam) | Score≥2 | DFS | 45 (31-58) | 18 (0-52) | 0.1 |
| Mohamed A [23] | 2015 | USA | 2000-2013 | Gastric cancer | Nucleus | Median 64, range (53-84) | 42/19 | 61 | IHC (Abcam) | >20% | OS | 2.60 ± 1.33 | 2.37 ± 0.19 | 0.48 |
| Mohamed A [23] | 2015 | USA | 2000-2013 | Gastric cancer | Cytoplasm | Median 64, range (53-84) | 42/19 | 61 | IHC (Abcam) | >20% | OS | 2.46 ± 1.36 | 2.47 ± 1.10 | 0.97 |
| Mohamed A [23] | 2015 | USA | 2000-2013 | Colorectal cancer | Nucleus | Median 60.6, range (50-81) | 28/17 | 45 | IHC (Abcam) | >20% | OS | 2.76 ± 1.71 | 2.45 ± 1.66 | 0.57 |
| Mohamed A [23] | 2015 | USA | 2000-2013 | Colorectal cancer | Cytoplasm | Median 60.6, range (50-81) | 28/17 | 45 | IHC (Abcam) | >20% | OS | 2.63 ± 2.05 | 2.66 ± 1.59 | 0.97 |
| Mohamed A [23] | 2015 | USA | 2000-2013 | Pancreatic cancer | Nucleus | Median 64, range (50-75) | 10/5 | 18 | IHC (Abcam) | >20% | OS | 1.34 ± 1.02 | 1.72 ± 1.04 | 0.55 |
| Mohamed A [23] | 2015 | USA | 2000-2013 | Pancreatic cancer | Cytoplasm | Median 64, range (50-75) | 10/5 | 18 | IHC (Abcam) | >20% | OS | 1.77 ± 1.02 | 1.47 ± 1.06 | 0.56 |
| Cha YJ [24] | 2014 | Korea | 2000-2012 | Breast cancer | Whole cell | 63 (<50); 51(≥50) | 0/114 | 114 | IHC (Abcam) | Score≥2 | DFS | 163 (156-169) | 93 (89-89) | 0.853 |
| Cha YJ [24] | 2014 | Korea | 2000-2012 | Breast cancer | Whole cell | 63 (<50); 51(≥50) | 0/114 | 114 | IHC (Abcam) | Score≥2 | OS | 162 (155-169) | 93 (89-97) | 0.954 |
| Kim JY [25] | 2014 | Korea | 2005-2012 | Breast cancer | Cytoplasm | 34 (≤35); 300(>35) | 0/334 | 334 | IHC (Abcam) | Score≥2 | DFS | 112 (99-125) | 117 (111-124) | 0.907 |
| Kim JY [25] | 2014 | Korea | 2005-2012 | Breast cancer | Cytoplasm | 34 (≤35); 300(>35) | 0/334 | 334 | IHC (Abcam) | Score≥2 | OS | 117 (106-128) | 126 (120-131) | 0.289 |
NA, not acquired; M, male; F, female; n, number; IHC, immunohistochemistry; CI, confidence interval; SD, standard deviation; DFS, disease free survival; OS, overall survival.
Table 4
Association between p62 mRNA level and OS based on the TCGA and HPA databases
| Tumor type | Best separation | Median separation | |||
|---|---|---|---|---|---|
| Cutoff (FPKM) | P value | Cutoff (FPKM) | P value | ||
| Liver cancer | 110.7 | 2.31E-05 | 66.4 | 4.09E-02 | |
| Lung cancer | 38.7 | 1.34E-01 | 38.6 | 1.44E-01 | |
| Breast cancer | 46.5 | 1.08E-01 | 33.9 | 7.71E-01 | |
| Cervical cancer | 36.4 | 1.39E-01 | 28.4 | 9.65E-01 | |
| Ovarian cancer | 22.8 | 5.65E-02 | 34.6 | 8.04E-01 | |
| Endometrial cancer | 24.6 | 9.45E-02 | 26.8 | 4.69E-01 | |
| Glioma | 26.2 | 1.21E-02 | 28.0 | 4.42E-02 | |
| Thyroid cancer | 70.3 | 4.41E-02 | 60.4 | 5.27E-01 | |
| Urothelial cancer | 22.0 | 2.01E-01 | 28.7 | 9.85E-01 | |
| Renal cancer | 58.1 | 9.52E-02 | 40.1 | 8.98E-01 | |
| Prostate cancer | 24.6 | 1.70E-01 | 29.4 | 4.24E-01 | |
| Testis cancer | 16.6 | 8.68E-03 | 12.3 | 2.02E-02 | |
| Stomach cancer | 24.3 | 3.21E-01 | 32.8 | 5.59E-01 | |
| Colorectal cancer | 49.2 | 3.19E-01 | 38.7 | 4.88E-01 | |
| Pancreatic cancer | 41.6 | 1.66E-01 | 38.8 | 3.80E-01 | |
| Head and neck cancer | 38.1 | 1.08E-01 | 26.7 | 2.00E-01 | |
| Melanoma | 40.6 | 2.34E-01 | 51.5 | 6.22E-01 | |
FPKM, Fragments per Kilo-base of exon per Million reads
Recent studies reported that the p62 protein in benign tissues was mainly distributed in nuclei while p62 in tumor tissues was distributed obviously in cytoplasm [19, 26, 27]. Our pooled results showed that the cytoplasmic p62 accumulation predicted a worse prognosis in malignant tumors, and it was evident in the early stage tumors. However, nuclear p62 accumulation and p62 mRNA overexpression had no such effect statistically. Nuclear p62 protein and p62 mRNA might indicate the generation of p62, whereas the cytoplasm p62 depends on the dynamic balance between generation and degradation. The degradation of p62 along with other autophagosomal contents is a critical process during autophagy [2]. Therefore, accumulation of p62 reflects impaired autophagy, a process reported to be a key to the onset of tumorigenesis [7]. In contrast to the p62 generation, the degradation of p62 might have more important impact on the tumor survival. Consistent with the anti-tumor role of autophagy in early stage, it is reasonable that in early stage cytoplasmic p62 accumulation is associated with worse survival. Given the dual role of autophagy in tumorigenesis and progression, the autophagy related protein should be considered as a potential prognostic biomarker or therapeutic target according to the characteristics of tumor. Apart from the direct survival analysis, p62 expression was reported to be associated with lymph node status, distant metastasis, disease relapse and drug resistance [20, 28, 29]. High level of p62 also allowed cancer cells evade apoptosis and promote cancer progression through activating NF-κB and Nrf2 signaling pathways [30, 31]. P62 might participate in the regulation of tumor progression through multiple physiological processes in addition to autophagy pathway.
A recent study from Ruan et al. [32] which was published in Oncotarget, also examined the relationship between p62 expression and survival outcomes in solid tumor patients by combining 20 studies. However, there were another 15 published articles being suitable for this meta-analysis but not enrolled in their study. Our study updated the data to provide more accurate estimates with a stronger statistical power. Furthermore, we performed the subgroup analyses by tumor stage, p62 staining pattern and tumor type and found the strength of association between p62 and prognosis varied according to different clinicopathologic features. We also tested the predictive role of p62 mRNA level on patients' survival in various types of tumors.
Despite our efforts to conduct a comprehensive analysis, several limitations remain to be recognized. First, the synthetic results are inevitably compromised by the potential publication bias because this meta-analysis is based on the reported studies. Predominantly positive results are more liable to be published and inflate our estimate for the association between p62 and patients' survival. Second, all the included studies in our analysis are cohort studies and the cutoff values varied in different studies, which may influence the validity of p62 as a predictive biomarker in tumor prognosis. Third, certain HRs and 95% CIs were calculated from the Kaplan-Meier curves, so this might bring statistical deviations inevitably. Finally, there was significant heterogeneity in patient populations, clinical therapeutic methods and follow-up time. Although random-effects model and sensitivity analysis were carried out to address this heterogeneity, these statistical methods might not be sufficient.
Figure 8
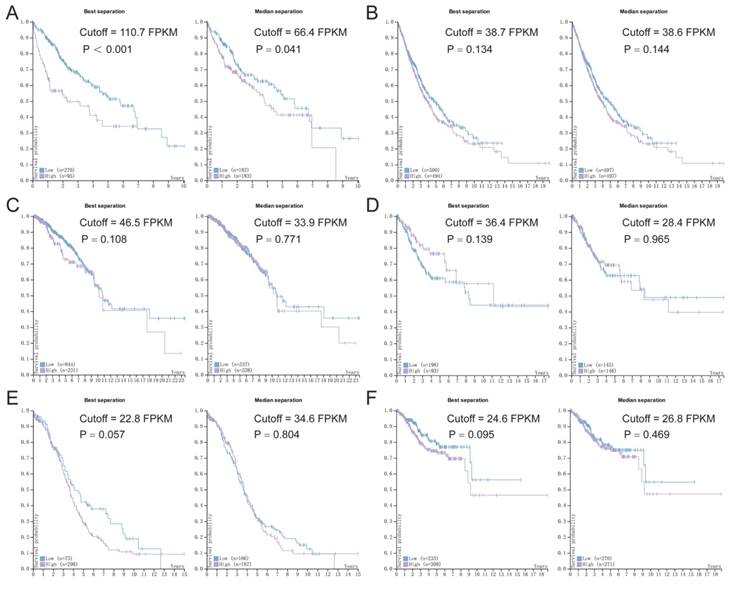
Survival analysis of p62 mRNA expression according to the TCGA and HPA databases. (A) Liver cancer, (B) Lung cancer, (C) Breast cancer, (D) Cervical cancer, (E) Ovarian cancer, (F) Endometrial cancer. Purple lines represent high expression of p62 and blue lines represent low expression.
Conclusions
The pooled results of the meta-analysis suggest that p62 overexpression was associated with worse prognosis in certain types of tumors. Further subgroup analyses indicate that cytoplasmic p62 accumulation can be a prognostic marker for early stage tumors. Considering the limitations of this meta-analysis, this conclusion should be regarded with caution. Further well-designed studies with larger sample size are needed to verify the role of p62 expression on tumor prognosis.
Acknowledgements
This study was supported by the National Key Research and Development Program of China (Project 2017YFC0113500), the Major Scientific and Technological Development Program of Zhejiang Province (Project 2014C03032), The Traditional Chinese Medical Science and Technology Key Research plan of Zhejiang Province (Project 2015ZZ007) and "The 13th five year" Traditional Chinese Medicine (integrated Chinese traditional and Western medicine) Key Discipline of Zhejiang Province (Innovative lung cancer diagnosis and treatment with combination of Chinese traditional and Western medicine 2017-XK-A33). We also acknowledge the efforts of the TCGA and HPA staffs in the creation of the TCGA and HPA databases.
Competing Interests
The authors have declared that no competing interest exists.
References
1. Torre LA, Bray F, Siegel RL, Ferlay J, Lortet-Tieulent J, Jemal A. Global cancer statistics, 2012. CA: a cancer journal for clinicians. 2015;65:87-108
2. Kundu M, Thompson CB. Autophagy: basic principles and relevance to disease. Annual review of pathology. 2008;3:427-55
3. Levine B, Kroemer G. Autophagy in the pathogenesis of disease. Cell. 2008;132:27-42
4. Mizushima N, Levine B, Cuervo AM, Klionsky DJ. Autophagy fights disease through cellular self-digestion. Nature. 2008;451:1069-75
5. Choi AM, Ryter SW, Levine B. Autophagy in human health and disease. The New England journal of medicine. 2013;368:651-62
6. Shintani T, Klionsky DJ. Autophagy in health and disease: a double-edged sword. Science (New York, NY). 2004;306:990-5
7. Galluzzi L, Pietrocola F, Bravo-San Pedro JM, Amaravadi RK, Baehrecke EH, Cecconi F. et al. Autophagy in malignant transformation and cancer progression. The EMBO journal. 2015;34:856-80
8. Moscat J, Diaz-Meco MT. p62: a versatile multitasker takes on cancer. Trends in biochemical sciences. 2012;37:230-6
9. Jiang P, Mizushima N. LC3- and p62-based biochemical methods for the analysis of autophagy progression in mammalian cells. Methods (San Diego, Calif). 2015;75:13-8
10. Rogov V, Dotsch V, Johansen T, Kirkin V. Interactions between autophagy receptors and ubiquitin-like proteins form the molecular basis for selective autophagy. Molecular cell. 2014;53:167-78
11. Puissant A, Fenouille N, Auberger P. When autophagy meets cancer through p62/SQSTM1. Am J Cancer Res. 2012;2:397-413
12. Klionsky DJ, Abdelmohsen K, Abe A, Abedin MJ, Abeliovich H, Acevedo Arozena A. et al. Guidelines for the use and interpretation of assays for monitoring autophagy (3rd edition). Autophagy. 2016;12:1-222
13. Moher D, Liberati A, Tetzlaff J, Altman DG. Preferred reporting items for systematic reviews and meta-analyses: the PRISMA statement. PLoS medicine. 2009;6:e1000097
14. Wang Y, Zeng T. Response to: Practical methods for incorporating summary time-to-event data into meta-analysis. Trials. 2013;14:391
15. Stang A. Critical evaluation of the Newcastle-Ottawa scale for the assessment of the quality of nonrandomized studies in meta-analyses. European journal of epidemiology. 2010;25:603-5
16. Higgins JP, Thompson SG, Deeks JJ, Altman DG. Measuring inconsistency in meta-analyses. BMJ (Clinical research ed). 2003;327:557-60
17. Cao QH, Liu F, Yang ZL, Fu XH, Yang ZH, Liu Q. et al. Prognostic value of autophagy related proteins ULK1, Beclin 1, ATG3, ATG5, ATG7, ATG9, ATG10, ATG12, LC3B and p62/SQSTM1 in gastric cancer. American journal of translational research. 2016;8:3831-47
18. Chang LC, Fan CW, Tseng WK, Chen JR, Chein HP, Hwang CC. et al. Immunohistochemical study of the Nrf2 pathway in colorectal cancer: Nrf2 expression is closely correlated to Keap1 in the tumor and Bach1 in the normal tissue. Applied immunohistochemistry & molecular morphology: AIMM. 2013;21:511-7
19. Jiang X, Zhong W, Huang H, He H, Jiang F, Chen Y. et al. Autophagy defects suggested by low levels of autophagy activator MAP1S and high levels of autophagy inhibitor LRPPRC predict poor prognosis of prostate cancer patients. Molecular carcinogenesis. 2015;54:1194-204
20. Okada M, Oikawa M, Miki Y, Shimizu Y, Echigo S, Takahashi T. et al. Immunohistochemical assessment of ATG7, LC3, and p62 in ameloblastomas. Journal of oral pathology & medicine: official publication of the International Association of Oral Pathologists and the American Academy of Oral Pathology. 2014;43:606-12
21. Kim HM, Kim ES, Koo JS. Expression of Autophagy-Related Proteins in Different Types of Thyroid Cancer. Int J Mol Sci. 2017:18
22. Koo JS, Kim JW, Yoon JS. Expression of Autophagy and Reactive Oxygen Species-Related Proteins in Lacrimal Gland Adenoid Cystic Carcinoma. Yonsei medical journal. 2016;57:482-9
23. Mohamed A, Ayman A, Deniece J, Wang T, Kovach C, Siddiqui MT. et al. P62/Ubiquitin IHC Expression Correlated with Clinicopathologic Parameters and Outcome in Gastrointestinal Carcinomas. Front Oncol. 2015;5:70
24. Cha YJ, Kim YH, Cho NH, Koo JS. Expression of autophagy related proteins in invasive lobular carcinoma: comparison to invasive ductal carcinoma. International journal of clinical and experimental pathology. 2014;7:3389-98
25. Kim JY, Jung WH, Koo JS. Expression of autophagy-related proteins according to androgen receptor and HER-2 status in estrogen receptor-negative breast cancer. PLoS One. 2014;9:e105666
26. Liu JL, Chen FF, Lung J, Lo CH, Lee FH, Lu YC. et al. Prognostic significance of p62/SQSTM1 subcellular localization and LC3B in oral squamous cell carcinoma. British journal of cancer. 2014;111:944-54
27. Kitamura H, Torigoe T, Asanuma H, Hisasue SI, Suzuki K, Tsukamoto T. et al. Cytosolic overexpression of p62 sequestosome 1 in neoplastic prostate tissue. Histopathology. 2006;48:157-61
28. Ju LL, Zhao CY, Ye KF, Yang H, Zhang J. Expression and clinical implication of Beclin1, HMGB1, p62, survivin, BRCA1 and ERCC1 in epithelial ovarian tumor tissues. European review for medical and pharmacological sciences. 2016;20:1993-2003
29. Rich T, Dean RT, Lamm CG, Ramiro-Ibanez F, Stevenson ML, Patterson-Kane JC. p62/Sequestosome-1: Mapping Sites of Protein-Handling Stress in Canine Cutaneous Mast Cell Tumors. Veterinary pathology. 2015;52:621-30
30. Shi J, Wong J, Piesik P, Fung G, Zhang J, Jagdeo J. et al. Cleavage of sequestosome 1/p62 by an enteroviral protease results in disrupted selective autophagy and impaired NFKB signaling. Autophagy. 2013;9:1591-603
31. Inami Y, Waguri S, Sakamoto A, Kouno T, Nakada K, Hino O. et al. Persistent activation of Nrf2 through p62 in hepatocellular carcinoma cells. The Journal of cell biology. 2011;193:275-84
32. Ruan H, Xu J, Wang L, Zhao Z, Kong L, Lan B. et al. The prognostic value of p62 in solid tumor patients: a meta-analysis. Oncotarget. 2018;9:4258-66
33. Yang Q, Zhang MX, Zou X, Liu YP, You R, Yu T. et al. A Prognostic Bio-Model Based on SQSTM1 and N-Stage Identifies Nasopharyngeal Carcinoma Patients at High Risk of Metastasis for Additional Induction Chemotherapy. Clinical cancer research: an official journal of the American Association for Cancer Research. 2018;24:648-58
34. Terabe T, Uchida F, Nagai H, Omori S, Ishibashi-Kanno N, Hasegawa S. et al. Expression of autophagy-related markers at the surgical margin of oral squamous cell carcinoma correlates with poor prognosis and tumor recurrence. Hum Pathol. 2018;73:156-63
35. Xu LZ, Li SS, Zhou W, Kang ZJ, Zhang QX, Kamran M. et al. p62/SQSTM1 enhances breast cancer stem-like properties by stabilizing MYC mRNA. Oncogene. 2017;36:304-17
36. Arai A, Chano T, Ikebuchi K, Hama Y, Ochi Y, Tameno H. et al. p62/SQSTM1 levels predicts radiotherapy resistance in hypopharyngeal carcinomas. Am J Cancer Res. 2017;7:881-91
37. Nakayama S, Karasawa H, Suzuki T, Yabuuchi S, Takagi K, Aizawa T. et al. p62/sequestosome 1 in human colorectal carcinoma as a potent prognostic predictor associated with cell proliferation. Cancer Med. 2017;6:1264-74
38. Niklaus M, Adams O, Berezowska S, Zlobec I, Graber F, Slotta-Huspenina J. et al. Expression analysis of LC3B and p62 indicates intact activated autophagy is associated with an unfavorable prognosis in colon cancer. Oncotarget. 2017;8:54604-15
39. Tang DY, Ellis RA, Lovat PE. Prognostic Impact of Autophagy Biomarkers for Cutaneous Melanoma. Front Oncol. 2016;6:236
40. Schlafli AM, Adams O, Galvan JA, Gugger M, Savic S, Bubendorf L. et al. Prognostic value of the autophagy markers LC3 and p62/SQSTM1 in early-stage non-small cell lung cancer. Oncotarget. 2016;7:39544-55
41. Schmitz KJ, Ademi C, Bertram S, Schmid KW, Baba HA. Prognostic relevance of autophagy-related markers LC3, p62/sequestosome 1, Beclin-1 and ULK1 in colorectal cancer patients with respect to KRAS mutational status. World journal of surgical oncology. 2016;14:189
42. Adams O, Dislich B, Berezowska S, Schlafli AM, Seiler CA, Kroll D. et al. Prognostic relevance of autophagy markers LC3B and p62 in esophageal adenocarcinomas. Oncotarget. 2016;7:39241-55
43. Masuda GO, Yashiro M, Kitayama K, Miki Y, Kasashima H, Kinoshita H. et al. Clinicopathological Correlations of Autophagy-related Proteins LC3, Beclin 1 and p62 in Gastric Cancer. Anticancer Res. 2016;36:129-36
44. Iwadate R, Inoue J, Tsuda H, Takano M, Furuya K, Hirasawa A. et al. High Expression of p62 Protein Is Associated with Poor Prognosis and Aggressive Phenotypes in Endometrial Cancer. The American journal of pathology. 2015;185:2523-33
45. Wang X, Du Z, Li L, Shi M, Yu Y. Beclin 1 and p62 expression in non-small cell lung cancer: relation with malignant behaviors and clinical outcome. International journal of clinical and experimental pathology. 2015;8:10644-52
46. Burdelski C, Reiswich V, Hube-Magg C, Kluth M, Minner S, Koop C. et al. Cytoplasmic Accumulation of Sequestosome 1 (p62) Is a Predictor of Biochemical Recurrence, Rapid Tumor Cell Proliferation, and Genomic Instability in Prostate Cancer. Clinical cancer research: an official journal of the American Association for Cancer Research. 2015;21:3471-9
47. Zhao M, Xu H, Zhang B, Hong B, Yan W, Zhang J. Impact of nuclear factor erythroid-derived 2-like 2 and p62/sequestosome expression on prognosis of patients with gliomas. Hum Pathol. 2015;46:843-9
48. Ellis RA, Horswell S, Ness T, Lumsdon J, Tooze SA, Kirkham N. et al. Prognostic impact of p62 expression in cutaneous malignant melanoma. The Journal of investigative dermatology. 2014;134:1476-8
49. Iwadate R, Inoue J, Tsuda H, Takano M, Furuya K, Hirasawa A. et al. High Expression of SQSTM1/p62 Protein Is Associated with Poor Prognosis in Epithelial Ovarian Cancer. Acta histochemica et cytochemica. 2014;47:295-301
50. Jin GZ, Dong H, Yu WL, Li Y, Lu XY, Yu H. et al. A novel panel of biomarkers in distinction of small well-differentiated HCC from dysplastic nodules and outcome values. BMC Cancer. 2013;13:161
51. Inui T, Chano T, Takikita-Suzuki M, Nishikawa M, Yamamoto G, Okabe H. Association of p62/SQSTM1 excess and oral carcinogenesis. PLoS One. 2013;8:e74398
52. Kim SK, Jung WH, Koo JS. Expression of autophagy-related proteins in phyllodes tumor. International journal of clinical and experimental pathology. 2013;6:2145-56
53. Luo RZ, Yuan ZY, Li M, Xi SY, Fu J, He J. Accumulation of p62 is associated with poor prognosis in patients with triple-negative breast cancer. OncoTargets and therapy. 2013;6:883-8
54. Park JM, Huang S, Wu TT, Foster NR, Sinicrope FA. Prognostic impact of Beclin 1, p62/sequestosome 1 and LC3 protein expression in colon carcinomas from patients receiving 5-fluorouracil as adjuvant chemotherapy. Cancer biology & therapy. 2013;14:100-7
55. Choi J, Jung W, Koo JS. Expression of autophagy-related markers beclin-1, light chain 3A, light chain 3B and p62 according to the molecular subtype of breast cancer. Histopathology. 2013;62:275-86
56. Sorbye SW, Kilvaer TK, Valkov A, Donnem T, Smeland E, Al-Shibli K. et al. Prognostic impact of Jab1, p16, p21, p62, Ki67 and Skp2 in soft tissue sarcomas. PLoS One. 2012;7:e47068
57. Inoue D, Suzuki T, Mitsuishi Y, Miki Y, Suzuki S, Sugawara S. et al. Accumulation of p62/SQSTM1 is associated with poor prognosis in patients with lung adenocarcinoma. Cancer Sci. 2012;103:760-6
58. Kim S, Jung WH, Koo JS. Differences in autophagy-related activity by molecular subtype in triple-negative breast cancer. Tumour biology: the journal of the International Society for Oncodevelopmental Biology and Medicine. 2012;33:1681-94
59. Rolland P, Madjd Z, Durrant L, Ellis IO, Layfield R, Spendlove I. The ubiquitin-binding protein p62 is expressed in breast cancers showing features of aggressive disease. Endocrine-related cancer. 2007;14:73-80
60. Li SS, Xu LZ, Zhou W, Yao S, Wang CL, Xia JL. et al. p62/SQSTM1 interacts with vimentin to enhance breast cancer metastasis. Carcinogenesis. 2017;38:1092-103
61. Tang J, Deng R, Luo RZ, Shen GP, Cai MY, Du ZM. et al. Low expression of ULK1 is associated with operable breast cancer progression and is an adverse prognostic marker of survival for patients. Breast cancer research and treatment. 2012;134:549-60
62. Thompson HG, Harris JW, Wold BJ, Lin F, Brody JP. p62 overexpression in breast tumors and regulation by prostate-derived Ets factor in breast cancer cells. Oncogene. 2003;22:2322-33
63. Falasca L, Torino F, Marconi M, Costantini M, Pompeo V, Sentinelli S. et al. AMBRA1 and SQSTM1 expression pattern in prostate cancer. Apoptosis: an international journal on programmed cell death. 2015;20:1577-86
64. Giatromanolaki A, Sivridis E, Mendrinos S, Koutsopoulos AV, Koukourakis MI. Autophagy proteins in prostate cancer: relation with anaerobic metabolism and Gleason score. Urologic oncology. 2014;32(39 e):11-8
65. Kuo WL, Sharifi MN, Lingen MW, Ahmed O, Liu J, Nagilla M. et al. p62/SQSTM1 accumulation in squamous cell carcinoma of head and neck predicts sensitivity to phosphatidylinositol 3-kinase pathway inhibitors. PLoS One. 2014;9:e90171
66. Giatromanolaki A, Sivridis E, Mitrakas A, Kalamida D, Zois CE, Haider S. et al. Autophagy and lysosomal related protein expression patterns in human glioblastoma. Cancer biology & therapy. 2014;15:1468-78
Author contact
![]() Corresponding author: Jian Hu, Department of Thoracic Surgery, the First Affiliated Hospital, School of Medicine, Zhejiang University. No. 79 Qingchun Road, Hangzhou 310003, China. Email: dr_hujianedu.cn. Tel: +86-571-87236847. Fax: +86-571-87236847.
Corresponding author: Jian Hu, Department of Thoracic Surgery, the First Affiliated Hospital, School of Medicine, Zhejiang University. No. 79 Qingchun Road, Hangzhou 310003, China. Email: dr_hujianedu.cn. Tel: +86-571-87236847. Fax: +86-571-87236847.
Citation styles
APA
Zhu, L., Wang, Y., He, J., Tang, J., Lv, W., Hu, J. (2018). Cytoplasmic SQSTM1/ P62 Accumulation Predicates a Poor Prognosis in Patients with Malignant Tumor. Journal of Cancer, 9(21), 4072-4086. https://doi.org/10.7150/jca.26399.
ACS
Zhu, L.; Wang, Y.; He, J.; Tang, J.; Lv, W.; Hu, J. Cytoplasmic SQSTM1/ P62 Accumulation Predicates a Poor Prognosis in Patients with Malignant Tumor. J. Cancer 2018, 9 (21), 4072-4086. DOI: 10.7150/jca.26399.
NLM
Zhu L, Wang Y, He J, Tang J, Lv W, Hu J. Cytoplasmic SQSTM1/ P62 Accumulation Predicates a Poor Prognosis in Patients with Malignant Tumor. J Cancer 2018; 9(21):4072-4086. doi:10.7150/jca.26399. https://www.jcancer.org/v09p4072.htm
CSE
Zhu L, Wang Y, He J, Tang J, Lv W, Hu J. 2018. Cytoplasmic SQSTM1/ P62 Accumulation Predicates a Poor Prognosis in Patients with Malignant Tumor. J Cancer. 9(21):4072-4086.
This is an open access article distributed under the terms of the Creative Commons Attribution (CC BY-NC) license (https://creativecommons.org/licenses/by-nc/4.0/). See http://ivyspring.com/terms for full terms and conditions.