Journal of Cancer
ISSN: 1837-9664
3.2
Impact Factor
ISSN: 1837-9664

 Global reach, higher impact
J Cancer 2018; 9(20):3812-3823. doi:10.7150/jca.26816 This issue Cite
Research Paper
Multiplex Cell-Free DNA Reference Materials for Quality Control of Next-Generation Sequencing-Based In Vitro Diagnostic Tests of Colorectal Cancer Tolerance
Donglai Liu1, Xinyuan Zhang2, Haiwei Zhou1, Xiaojing Lin2, Dawei Shi1, Shu Shen1, Yabin Tian1, Bo Du2, Henghui Zhang2, Haibo Wang2, Youchun Wang1, ![]() , Chuntao Zhang1,
, Chuntao Zhang1, ![]()
1. Division II of In Vitro Diagnostics for Infectious Diseases, Institute for In Vitro Diagnostics Control, National Institutes for Food and Drug Control, Beijing, China
2. GeneCast Precision Medicine Technology Institute, Beijing, China
Received 2018-4-21; Accepted 2018-8-7; Published 2018-10-1
Citation:
Liu D, Zhang X, Zhou H, Lin X, Shi D, Shen S, Tian Y, Du B, Zhang H, Wang H, Wang Y, Zhang C. Multiplex Cell-Free DNA Reference Materials for Quality Control of Next-Generation Sequencing-Based In Vitro Diagnostic Tests of Colorectal Cancer Tolerance. J Cancer 2018; 9(20):3812-3823. doi:10.7150/jca.26816. https://www.jcancer.org/v09p3812.htm
Other stylesAbstract
Background: Liquid biopsies based on next-generation sequencing (NGS) assays are confronted with more opportunities and challenges. Widespread clinical implementation of NGS-based cancer in vitro diagnostic tests (IVDs) highlighted the urgency to establish reference materials (RMs) which could provide full control of the process from nucleic acid extraction to test report generation. Quality control based on cell-free DNA (cfDNA) RMs is especially important for liquid biopsies.
Methods: Here, we used genomic DNA from thirteen cell lines to establish four negative cfDNA RMs (N1-N4) and four multiplex cfDNA RMs (L1-L4) at serial allelic frequencies ranging from approximately 2% to 0.1%. All the cfDNA RMs were quantified and validated via both droplet digital polymerase chain reaction (ddPCR) and NGS. These RMs were distributed to eight domestic manufacturers to collaboratively evaluate the performance of several domestic NGS-based cancer IVDs covering four major NGS platforms (NextSeq, HiSeq, Ion Proton, and BGISEQ).
Results: Each multiplex RM has eleven colorectal cancer-related mutations, including six KRAS mutations (G12S, G12C, G12D, G12A, G12V, and G13D), three NRAS mutations (G12D, Q61R, and Q61K), one PIK3CA mutation (H1047R), and one BRAF mutation (V600E). Each mutation in the cfDNA RMs was quantified and validated via both ddPCR and NGS, showing the good relevance of mutant allelic frequency. These RMs were distributed to eight domestic manufacturers for collaborative evaluation. All eight manufacturers provided similar results by domestic NGS-based cancer IVDs, except for manufacturer #5. The coefficient of variation (CV) was increased with decreasing mutant allelic frequency, and poor repetition occurred when the allelic frequency was lower than 0.5%.
Conclusions: These results indicated that these cfDNA RMs would be pivotal for NGS-based cancer IVDs, especially for liquid biopsies of colorectal cancer-related mutations and would guide the further development of RMs covering more onco-related mutations.
Keywords: multiplex reference materials, cfDNA, next-generation sequencing, ddPCR, colorectal cancer
Introduction
NGS technology is a useful tool in biology research and clinical diagnostic, prognostic and monitoring testing. Liquid biopsies based on NGS assays are confronted with more opportunities and challenges [1,2]. Since KRAS mutations were first detected in the plasma cfDNA of pancreatic cancer patients by PCR [3], mutations in cfDNA were considered as cancer-specific molecular markers [4-7] that respond to cancer progression [8-10], drug tolerance [11], and recurrence [12]. In addition to blood, the cfDNA of other body fluids, such as urine [13, 14], saliva [15], cerebrospinal fluid [16], and pleural effusion [17], also contains cancer-related mutations. The cfDNA is released from cells, including cancer cells and normal cells, mostly through a combination of apoptosis, secretion, and necrosis [17]. Only a small portion of cfDNA originates from cancer cells, so the cancer-related mutations are extremely difficult to detect. Liquid biopsies are becoming increasingly important in guiding patient care and clinical practice. However, different sequencing methods, platforms, data analysis tools, and experimental procedures have shown discordance for clinical NGS assays [18].
Reference materials (RMs) are control materials with known characteristics (for example, a known genotype) against which test performance can be measured [19]. For clinical NGS assays, the RMs are well-characterized samples that contain known variants at known allele frequencies, and the variations are usually disease associated [20]. RMs can be used for platform validation, experiment validation, informatics pipeline validation, and quality control and proficiency testing [21]. DNA RMs can mainly be classified into five groups: DNA biological materials, engineered cell lines, spike-in controls, in silico datasets and RNA biological materials [19,22]. In silico datasets are only referenced for bioinformatics steps. Spike-in controls often comprise synthetic non-human or artificial sequences [23, 24] and can be added to a sample to monitor NGS procedures, but spike-in controls could not reflect the complexity or behavior of native DNA samples [25]. A classic type of DNA biological reference material is tumor samples, which reflect the complexity or behavior of native DNA samples. However, the finite size limits the broad use of tumor samples. The DNA from cell lines with clinical variants derived from patient tumors provides many advantages: renewability, a large supply, a similar complexity to patient DNA, and compatibility with many assays [21]. The variant diversity is limited in any single cell line. Specific variant-engineered cell lines offer an alternative to cell-line derived RMs (Horizon Diagnostics [26]); however, the risk of unintended off-targets should be considered.
Liquid biopsies have been introduced into many cancer management strategies, requiring the detection of more mutations before drug treatment. To precisely detect the low-frequency mutations from plasma, cfDNA RMs are urgently needed. Different from traditional DNA RMs, cfDNA RMs were fragmented to 160 bp to mimic the biological feature of cfDNA fragments. For DNA shearing, the Covaris Adaptive Focused Acoustics (AFA) technology is the “gold standard” due to its technological advantages over other sample preparation methods, such as sonication and nebulization [27,28]. The advantages of reproducibility, versatility, and uniformity in fragment size distribution make the sheared DNA useful as cfDNA RMs. The cfDNA RMs cannot cover all known mutations for some cancers or drug uses. Indeed, there are different performances for different mutation loci in the same assay, no matter the NGS platform or data analysis method used. Thus, the more mutations in cfDNA RMs, the stricter the quality control for mutation detection. Here, we produced multiplex cfDNA RMs with eleven mutations at different allelic frequencies based on multiple tumor patient-derived cell lines.
All eleven mutations are related to colorectal cancer tolerance. Colorectal cancer is the third most common tumor and the main cause of death [29, 30]. Epidermal growth factor receptor (EGFR) is a transmembrane tyrosine kinase receptor that can trigger downstream signal pathways and lead to tumor cell proliferation and the inhibition of apoptosis. Cetuximab and panitumumab are anti-EGFR monoclonal antibodies that improve the survival of colorectal cancer patients. However, anti-EGFR antibodies are not useful for all colorectal cancer patients. For example, less than 30% of patients were responsive to cetuximab (http://www.accessdata.fda.gov/drugsatfda_docs/label/2015/125084s262lbl.pdf). Some RAS/RAF/PIK3CA mutations can make anti-EGFR therapeutics invalid, such as mutations in codons 12 and 13 of KRAS, codons 12 and 61 of NRAS, PIK3CA H1047R, and BRAF V600E [31-33]. The precise and simultaneous detection of these gene loci is necessary for colorectal cancer patients to guide and monitor drug use. An FDA-approved NGS-based IVD, Praxis™ Extended RAS Panel, targets 56 specific mutations in RAS genes [KRAS (exons 2, 3, and 4) and NRAS (exons 2, 3, and 4)] to aid in the identification of patients with colorectal cancer for treatment with panitumumab (http://www.accessdata.fda.gov/drugsatfda_docs/label/2015/125147s200lbl.pdf.).
Here, we produced multiplex cfDNA RMs, which covered colorectal cancer-related mutations and were particularly suitable for guiding drug use for colorectal cancer and cancer tolerance. The multiplex cfDNA RMs contained eleven colorectal cancer-related mutations, KRAS G12S, G12C, G12D, G12A, G12V, G13D, NRAS Q61K, G12D, Q61R, PIK3CA H1047R, and BRAF V600E, at four serial allelic frequencies of approximately 2%, 1%, 0.5% and 0.1%. We conducted a collaborative evaluation study for the performance of NGS-based cancer IVDs using these cfDNA RMs.
Materials and Methods
Preparation of cell lines
Thirteen cell lines, including nine cell lines containing positive mutations, A549 (ATCC CCL-185), NCI-H2122 (ATCC CRL-5985), A427 (ATCC HTB-53), NCI-H1573 (ATCC CRL-5877), NCI-H441 (ATCC CRM-HTB-174), HCT116 (ATCC CCL-247), THP-1 (ATCC TIB-202), NCI-H2347, and SK-HEP-1 (ATCC HTB-52), and four cell lines without positive mutations, BEAS-2B (ATCC CRL-9069), AMO-1, NCI-H596 (ATCC HTB-178), and NCI-H929 (ATCC CRL-9068), were used in the present study. These cell lines were obtained from Cobioer Biological Technology (Nanjing, China) and cultured using the recommended culture conditions. Briefly, all thirteen cell lines were incubated at 37℃ in a suitable incubator with 5% CO2 in air atmosphere. All culture media contained 10% fetal bovine serum (FBS), except for the AMO-1 cell line, which needed 20% FBS. The base medium for each cell line was different. Dulbecco's modified eagle medium (DMEM) was used for BEAS-2B, 90% 1640 base medium was used for NCI-H596, NCI-H2347, NCI-H2122, NCI-H1573, NCI-H441, THP-1, and NCI-H929, and 80% RPMI 1640 was used for AMO-1. THP-1 and NCI-H929 additionally required 0.05 mM 2-mercaptoethanol. F-12K base medium was suitable for A549. NEAA (non-essential amino acid) and 1 mM Sodium pyruvate were added to Eagle's Minimum Essential Medium (MEM) to obtain complete growth medium for A427 and SK-HEP-1. McCoy's 5A Medium (Modified with Tricine) was suitable for the HCT116 cell line.
DNA extraction
The cell suspension was prepared by collecting suspension cell culture medium or digesting adherent cell lines by 0.25% trypsin-0.02% EDTA solution. After centrifugation at 300 g for 5 minutes, the supernatant was discarded, and the precipitate was suspended by 200 µL phosphate buffer saline (PBS). Genomic DNA samples were extracted using the QIAamp DNA Mini Kit (catalog number: 51304; Qiagen, Germany). After lysis and adjustment of DNA binding conditions, the sample was directly loaded onto a QIAamp spin column. The DNA was bound to the silica membrane, and the contaminants were completely removed in two wash steps. The DNA was eluted with low-TE buffer and ready for use in downstream experiments.
Sanger sequencing for mutation identification
Sanger sequencing at TsingKe Biological Technology (Beijing, China) was used to identify the eleven mutations in the genomic DNA extracted from the nine mutant-positive cell lines. The forward sequencing primer (5'-3') for KRAS is GTATTAAAAGGTACTGGTGG and the reverse primer (5'-3') for KRAS is GGTCCTGCACCAGTAATATGC. The NRAS G12D forward primer is (5'-3') CACACTAGGGTTTTCATTTCCA and the reverse one is (5'-3') AGGATCAGGTCAGCGGGCTA. The NRAS Q61R forward primer is (5'-3') CACACCCCCAGGATTCTTAC and the reverse one is (5'-3') TGCTCCTAGTACCTGTAGAG. The BRAF V600E forward primer is (5'-3') TCATAATGCTTGCTCTGATAGGA and the reverse one is (5'-3') GGCCAAAAATTTAATCAGTGGA. The PIK3CA H1047R forward primer is (5'-3') CTCAATGATGCTTGGCTCTG and the reverse one is (5'-3') TGGAATCCAGAGTGAGCTTTC.
Preparation of the RMs
Genomic DNA from BEAS-2B, AMO-1, NCI-H596, and NCI-H929 was sheared separately to 160 bp using the Covaris M220 sonicator (Covaris Inc., USA), which served as the negative cfDNA RMs N1-N4. We proportionally pooled the genomic DNA from the nine mutant cell lines and diluted the mixed DNA with genomic DNA from BEAS-2B at desired variant frequencies of 2%, 1%, 0.5%, and 0.1%. After shearing, the main fragments were approximately 160 bp, mimicking the cfDNA fragments. These fragments served as positive multiplex cfDNA RMs L1-L4. Detailed workflow is shown in Figure 1.
Validation and quantification of the RMs by ddPCR
To validate and quantify the variant frequencies, the DNA samples extracted from the cell lines and the mixed RMs were detected by ddPCR using the QX200 Droplet Digital PCR System (Bio-Rad Laboratories, Inc., USA). The reactions were set up in triplicate. The ddPCR assays used for quantification are commercially bought from Bio-Rad and the assay catalog numbers were listed as follow: #1863114, #1863111, #1863112, #1863110, #1863108, #1863116, #10033487, #1863130, #1863129, #1863133, and #1863100. Each reaction system included 10 µL of ddPCR supermix for probes (no dUTP), 1 µL mutant probe, 1 µL wild-type probe and 20 ng template DNA [34]. Negative control reactions were performed with water instead of the DNA template. Droplet generation was manually performed according to the manufacturer's guidelines. The emulsions were generated, transferred to 96-well PCR plates and sealed with Pierceable Foil Heat Seal. The PCR thermocycling profile was optimized as follows: enzyme activation, one cycle (95℃, 8 minutes), followed by denaturation (94℃, 30 seconds) and annealing/extension (55℃, 1 minute) at a ramp rate of approximately 4℃/second for 39 cycles. The PCR was terminated by enzyme deactivation at 98℃ for 10 minutes, followed by a hold at 4℃ (ramp rate, approximately 1℃/second). The plate was transferred to the droplet reader. The samples were read using the Rare Event Detection module on the reader (QuantaSoft version 1.7.4.0917; Bio-Rad).
NGS assays [35]
Library preparation
Genomic DNA was sheared with Covaris M220 (Covaris) according to the recommended settings for 150 to 200 bp fragments, and 20 ng of the fragmented DNA was input for library construction. Indexed Illumina NGS libraries were prepared with the KAPA Hyper Preparation Kit (Kapa Biosystems, USA) according to the manufacturer's instructions. The sequence index-ligated fragments were amplified for 9 PCR cycles depending on the DNA mass of pre-PCR. Agencourt AMPure XP beads (Beckman-Coulter, USA) were used to purify DNA and dual size selection during the library preparation. All libraries were quantified by the Qubit DNA dsDNA Assay Kit (ThemoFisher, USA), and the fragment length was determined on the Agilent Bioanalyzer 2100 with the DNA 1000 Kit (Agilent, USA).
Figure 1
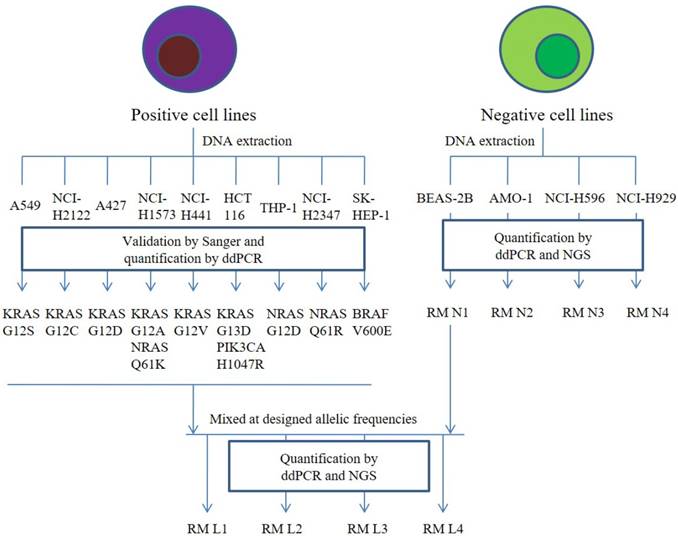
The detailed workflow of the preparation of cfDNA RMs. Four mutant-negative cell lines were used to prepare for four mutant-negative cfDNA RMs N1-N4. For the preparation of the four multiplex cfDNA RMs L1-L4, we mixed the mutant-negative cfDNA RMs N1 and mutant-positive cell lines at a different ratio. All the cfDNA RMs were quantified by ddPCR and NGS.
Targeted region captures and sequencing
Targeted region selection was performed with the NimbleGen SeqCap Hybridization and Wash Kit (Roche, Swiss). A 1-µg mixed DNA library from 8-12 indexed Illumina libraries was captured with a hybridization probe. The probe library was designed through the NimbleDesign portal (Version 02) using genome build hg19 NCBI Build 37.1/GRCh37. The panel was 40 kb, targeting the regions of genes KRAS, NRAS, PIK3CA, BRAF, EGFR, EML4, ALK, SLC34A2, and ROS1. The hybridization and washing were conducted according to the manufacturer's protocol, and the captured DNA fragments were divided into two 50 µL reactions and amplified with 14 PCR cycles. The two reactions were pooled and purified with Agencourt AMPure XP beads. The captured product was sequenced using 150 bp paired-end runs on the Illumina NextSeq CN500 after quantification by the Qubit dsDNA Assay Kit and determination of fragment length by the Agilent 2100 Bioanalyzer with the DNA 1000 Kit. The median yield of each library was ~11.0 M reads, and the mean depth was ~10,000 X.
Collaborative evaluation of the performance of NGS-based cancer IVDs
Four positive multiplex cfDNA RMs L1-L4 and four negative cfDNA RMs N1-N4 were distributed to eight manufacturers to evaluate the general performance of NGS-based cancer IVDs. The eight biotechnology companies were leaders in the field of liquid biopsy in China. Despite using different experimental methods and sequencing platforms, the eight participants all developed their in-house NGS-based cancer IVDs for the detection of cancer-related mutations from plasma samples. All cfDNA RMs were tested and analyzed using NGS panels and bioinformatics tools according to their standard operating procedures. Each cfDNA RM was tested only once in order to resemble the actual situation of clinical sample test. Both the quantitative allelic frequencies and qualitative results for each cfDNA RMs were collected.
Statistical analysis
The ddPCR assay was performed in triplicate, and the results were assessed by one-way ANOVA to calculate the uniformity of each mutation. The relevance of the results between ddPCR and NGS was analyzed by linear regression and Wilcoxon signed rank test. The general performance of NGS-based cancer IVDs for detecting the cfDNA RMs at an allelic frequency was evaluated by calculating the CV of the results of all participants testing the same sample. The CV was defined as the ratio of the standard deviation to the mean expressing the dispersion of the distribution of allelic frequencies detected by the participants. One sample t-test was performed to examine the differences in allelic frequencies detected by the NGS assay compared with those detected by the ddPCR assay. Significance was defined when the P value was less than 0.05. Statistical analyses and data visualization were performed using SPSS v19.0, GraphPad Prism v5.0, and SigmaPlot v13.0.
Results
Preparation, validation, and quantification of cell lines
In the present study, thirteen cell lines were prepared to produce the cfDNA RMs for quality control of the NGS-based assay, particularly for colorectal cancer tolerance IVDs. To detect and validate whether each cell line contained the desired colorectal cancer-related mutations, Sanger sequencing (data not shown) and ddPCR were performed using the genomic DNA from each cell line as a template.
The results of ddPCR for the mutant-negative cell lines showed that the allelic frequencies of the eleven colorectal cancer-related mutations were all under 0.1%, except for the mutation NRAS Q61K from BEAS-2B and AMO-1. The allelic frequencies of NRAS Q61K were 0.1% and 0.11% in cell line BEAS-2B and AMO-1, respectively. The other nine cell lines contained one or two mutations among the eleven colorectal cancer-related mutations according to the results of Sanger sequencing. According to the results of ddPCR, nine mutant cell lines were established which contained eleven types of mutations in KRAS, NRAS, PIK3CA, and BRAF. The cell line A549, NCI-H2122, NCI-H441, and A427 contained the mutations of KRAS G12S, KRAS G12C, KRAS G12V, and KRAS G12D with the allelic frequencies 99.96%, 91.52%, 51.73%, and 60.66%, respectively. The cell line NCI-H1573 contained the mutations of KRAS G12A and NRASQ61K with the allelic frequency 23.36% and 40.37%, respectively. The cell line HCT116 contained the mutations of KRAS G13D and PIK3CA H1047R with the allelic frequency 49.27% and 48.98%, respectively. The cell line THP-1, NCI-H2347, and SK-HEP-1 contained the mutations of 66.57% NRAS G12D, 99.97% NRAS Q61R, and 34.94% BRAF V600E, respectively.
The detailed workflow of the preparation of cfDNA RMs was presented in Figure 1. Briefly, there were four cell lines, BEAS-2B, AMO-1, NCI-H596, and NCI-H929, containing no colorectal cancer-related mutations, which were defined as mutant-negative RMs N1, N2, N3, and N4. The mutant-negative cfDNA RMs N1-N4 were composed of sheared genomic DNA from BEAS-2B, AMO-1, NCI-H596, and NCI-H929, respectively, and their fragmented DNA sizes were approximately 150-200 bp. The genomic DNA from the nine mutant cell lines was proportionally pooled and diluted with the genomic DNA from BEAS-2B at desired variant frequencies of 2%, 1%, 0.5%, and 0.1%, followed by shearing, and the main fragments were enriched at approximately 160 bp, mimicking the cfDNA fragments. These fragments served as mutant-positive multiplex cfDNA RMs L1-L4, with desired mutant variant frequencies of 2%, 1%, 0.5%, and 0.1%, respectively.
Validation and quantification of multiplex cfDNA RMs by ddPCR and NGS
To quantify the actual allelic frequency of the eleven colorectal cancer-related variants in the multiplex cfDNA RMs L1-L4, a ddPCR assay was performed. The variant frequency of L1 ranged from 1.96±0.31% (KRAS G12D) to 6.77±0.83% (NRAS Q61K). The variant frequency of L2 ranged from 1.07±0.39% (KRAS G12D) to 4.58±0.32% (NRAS Q61K). The variant frequency of L3 ranged from 0.61±0.12% (BRAF V600E) to 2.58±0.16% (NRAS Q61K), and the variant frequency range of L4 ranged from 0.06±0.08% (KRAS G12A) to 0.44±0.20% (NRAS Q61K) (Table 1). No significant differences were observed among replicated measurements of each mutant variant frequency (data not shown). The results indicated that the actual allelic frequencies were slightly different from the expected frequencies, but were stably determined.
To evaluate the performance of the cfDNA RMs L1-L4, a capture-based NGS gene panel was performed in triplicate. Based on the summary of our library data, more than 20 ng of cfDNA could be extracted from 10 mL of blood in approximately 80% of colorectal cancer patients (data not published). Thus the DNA input was 20 ng for each multiplex cfDNA RM from L1-L4 to prepare a library. The targeted DNA was captured with a probe produced by NimbleGen SepCap EZ. The sequencing platform was Illumina NextSeq CN500. No significant differences were shown among replicated measurements of each mutant variant frequency by one-way ANOVA (data not shown), indicating that the results assessed by NGS assay was consistent.
We used the Wilcoxon signed rank test to compare the differences in the results of ddPCR and NGS. For L1 to L4, the P-values were more than 0.05 (P=0.28 for L1; P=0.76 for L2; P=0.11 for L3; and P=0.07 for L4). Figure 2 shows that most of the allelic frequencies for the eleven mutations detected by the NGS assays were comparable to those detected by the ddPCR assay. As shown in Figure 3, we observed high consistency and linearity (r2=0.84) between the allelic frequencies assessed by NGS assay and their expected fractions based on ddPCR assay.
Performance of NGS-based IVDs
After validation and quantification by both ddPCR and NGS assay, the cfDNA RMs were distributed to eight manufacturers to evaluate the performance of their in-house developed NGS-based cancer IVDs. Four major NGS platforms, NextSeq and HiSeq of Illumina, Ion Proton of ThermoFisher, and BGISEQ-500 of BGI, were used by the participants. The DNA amount of each sample was sufficient for the qualified tests (approximately 100 ng for each cfDNA RMs, N1-N4 and L1-L4, enough for 3 replicates per test). Results from the eight participants were collected (Table 2).
Table 1
Validation and quantification of the allelic frequencies of the four multiplex cfDNA RMs L1-L4 by ddPCR.
| RMs | Gene | AA Change | Allelic frequencies detected by ddPCR, % | Mean±SD | ||
|---|---|---|---|---|---|---|
| L1 | KRAS | G12S | 2.90 | 2.55 | 2.61 | 2.68±0.19 |
| KRAS | G12C | 2.51 | 2.42 | 2.75 | 2.56±0.17 | |
| KRAS | G12D | 2.28 | 2.18 | 1.73 | 2.06±0.29 | |
| KRAS | G12A | 2.90 | 3.46 | 3.60 | 3.32±0.37 | |
| KRAS | G12V | 2.45 | 3.06 | 3.41 | 2.97±0.49 | |
| KRAS | G13D | 2.82 | 3.32 | 2.60 | 2.91±0.37 | |
| NRAS | G12D | 2.98 | 2.56 | 4.12 | 3.22±0.81 | |
| NRAS | Q61R | 2.97 | 3.58 | 3.81 | 3.45±0.43 | |
| NRAS | Q61K | 7.08 | 5.83 | 7.41 | 6.77±0.83 | |
| PIK3CA | H1047R | 2.62 | 2.86 | 3.18 | 2.89±0.28 | |
| BRAF | V600E | 2.08 | 2.46 | 2.97 | 2.50±0.45 | |
| KRAS | G12S | 1.38 | 1.24 | 1.13 | 1.25±0.13 | |
| KRAS | G12C | 1.26 | 1.75 | 0.81 | 1.27±0.47 | |
| KRAS | G12D | 1.65 | 1.30 | 1.32 | 1.42±0.20 | |
| KRAS | G12A | 2.01 | 2.28 | 1.61 | 1.97±0.33 | |
| KRAS | G12V | 1.36 | 2.21 | 1.35 | 1.64±0.49 | |
| L2 | KRAS | G13D | 0.94 | 1.79 | 1.27 | 1.33±0.42 |
| NRAS | G12D | 0.72 | 1.50 | 1.01 | 1.07±0.39 | |
| NRAS | Q61R | 2.29 | 1.96 | 2.51 | 2.25±0.28 | |
| NRAS | Q61K | 4.25 | 4.89 | 4.59 | 4.58±0.32 | |
| PIK3CA | H1047R | 1.67 | 1.13 | 1.22 | 1.34±0.29 | |
| BRAF | V600E | 1.12 | 1.27 | 1.46 | 1.28±0.17 | |
| L3 | KRAS | G12S | 0.79 | 0.51 | 0.83 | 0.71±0.18 |
| KRAS | G12C | 1.31 | 0.86 | 0.62 | 0.93±0.35 | |
| KRAS | G12D | 0.87 | 1.07 | 0.98 | 0.97±0.10 | |
| KRAS | G12A | 1.04 | 0.97 | 1.24 | 1.08±0.14 | |
| KRAS | G12V | 0.64 | 0.75 | 1.02 | 0.81±0.20 | |
| KRAS | G13D | 0.56 | 1.09 | 0.70 | 0.78±0.27 | |
| NRAS | G12D | 0.89 | 0.61 | 1.23 | 0.91±0.31 | |
| NRAS | Q61R | 1.46 | 1.47 | 0.88 | 1.27±0.34 | |
| NRAS | Q61K | 2.42 | 2.74 | 2.58 | 2.58±0.16 | |
| PIK3CA | H1047R | 0.84 | 0.82 | 1.26 | 0.97±0.25 | |
| BRAF | V600E | 0.68 | 0.68 | 0.47 | 0.61±0.12 | |
| L4 | KRAS | G12S | 0.14 | 0.19 | 0.14 | 0.16±0.03 |
| KRAS | G12C | 0.29 | 0.42 | 0.28 | 0.33±0.08 | |
| KRAS | G12D | 0.30 | 0.18 | 0.06 | 0.18±0.12 | |
| KRAS | G12A | 0.00 | 0.15 | 0.04 | 0.06±0.08 | |
| KRAS | G12V | 0.20 | 0.18 | 0.12 | 0.17±0.05 | |
| KRAS | G13D | 0.10 | 0.12 | 0.12 | 0.11±0.01 | |
| NRAS | G12D | 0.34 | 0.22 | 0.05 | 0.20±0.15 | |
| NRAS | Q61R | 0.27 | 0.38 | 0.45 | 0.37±0.09 | |
| NRAS | Q61K | 0.21 | 0.56 | 0.53 | 0.44±0.20 | |
| PIK3CA | H1047R | 0.29 | 0.26 | 0.25 | 0.27±0.02 | |
| BRAF | V600E | 0.06 | 0.18 | 0.05 | 0.10±0.07 | |
False-positive results of the mutant-negative cfDNA RMs N1-N4 were observed in five of the eight participants, where most of the false-positive results were not repeatable. These false-positive results might result from PCR or sequencing errors by chance. The detected allelic frequencies of the mutant-positive cfDNA RMs L1-L4 were shown in Table 3. For RM L1, all participants could consistently detect all the eleven mutations, except participant #5. However, when the allelic frequency decreased to 1%, as in RM L2, the detection of NRAS G12D and Q61R failed once in participants #4 and #8, respectively.
Figure 2
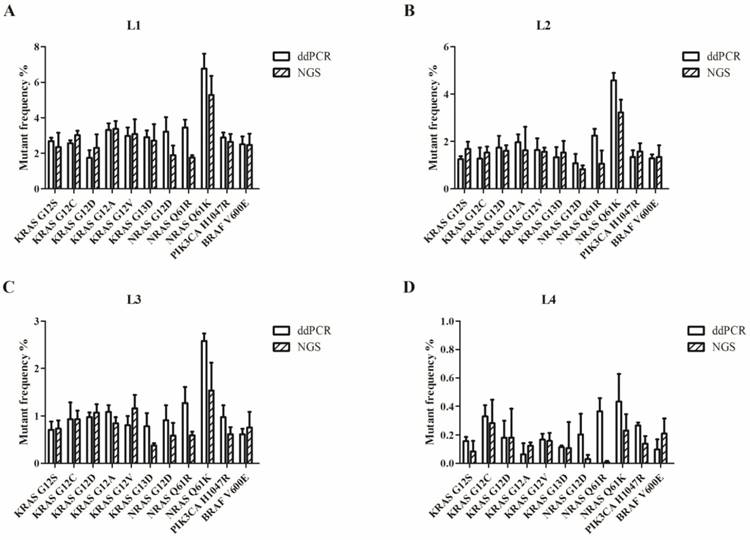
Allelic frequencies of the multiplex cfDNA RMs L1-L4 detected by ddPCR and NGS. (A) The multiplex cfDNA RMs L1; (B) the multiplex cfDNA RMs L2; (C) the multiplex cfDNA RMs L3; and (D) the multiplex cfDNA RMs L4. Data was shown as means±SD. Each test was performed in triplicate independently.
Figure 3
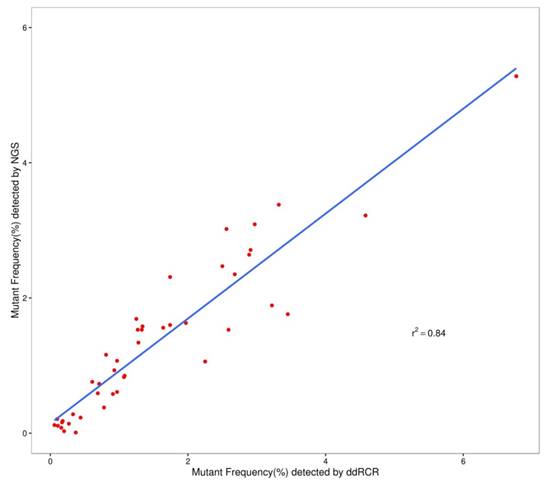
The relevance of allelic frequency determined by ddPCR and NGS assay.
Table 2
Information of NGS assays of the eight participants.
| Participants | Reagent origin | Input quantity (ng) | Methods to get targeted region | Sequence platform | Average depth | Number of genes in the panel | LOD for SNV | Total reads (M) | Mapped reads ratio | Targeted reads ratio | Duplication ratio |
|---|---|---|---|---|---|---|---|---|---|---|---|
| #1 | in-house | ≥ 20 | Hybrid capture | NextSeq 550 (Illumina) | 13.0 | 4 | 0.1 | 48.0 | 99.2 | 58.3 | 61.4 |
| #2 | in-house | ≥ 10 | Multiplex PCR | Ion Proton (ThermoFisher) | 113.6 | 7 | 0.2 | 2.8 | 91.5 | 96.8 | / |
| #3 | in-house | ≥ 10 | Hybrid capture | NextSeq CN500 (Berry Genomics) | 2.9 | 6 | 0.1 | 10.5 | 97.4 | 99.4 | 70.7 |
| #4 | in-house | ≥ 10 | Hybrid capture | NextSeq 550AR (Annoroad) | 1.8 | 4 | 0.5 | 8.8 | 99.9 | 99.7 | 65.9 |
| #5 | in-house | ≥ 20 | Hybrid capture | HiSeq X Ten (Illumina) | 42.2 | 63 | 0.1 | 145.4 | 99.9 | 48.2 | 93.0 |
| #6 | in-house | ≥ 20 | Hybrid capture | NextSeq CN500 (Illumina) | 10.0 | 14 | 0.3 | 11.0 | 99.9 | 57.7 | 64.0 |
| #7 | in-house | ≥ 30 | Hybrid capture | NextSeq CN500 (Illumina) | 1.6 | 17 | 0.5 | 35.6 | 99.8 | 63.5 | 75.1 |
| #8 | in-house | 10~30 | Hybrid capture | BGISEQ-500 (BGI) | 4.1 | 27 | 0.2 | 227.2 | 99.7 | 56.5 | / |
When the allelic frequency decreased to 0.5%, as in RM L3, the detection of the five mutations, KRAS G12D and G12V, NRAS Q61R and Q61K, and BRAF V600E, failed once in participant #4. The mutation KRAS G12D was missed once in participant #2, and the mutation KRAS G12C was missed once in participant #8. Along with the decreased allelic frequency, failure in the detection of mutation occurred more frequently, and more mutation loci were missed one or two times in the repetitive tests, showing poorer repeatability.
Table 3 also shows that KRAS G12C, G12D, and G12V, and NRAS Q61R of multiplex cfDNA RMs L1 failed to be detected by participant #5. The failure of detection of KRAS G12S, G12D, and G12V, and NRAS Q61R in RM L2, KRAS G12S, G12D, and G12A, and NRAS Q61R in RM L3, and KRAS G12S, G12A, G12V, and G13D, NRAS Q61R, and BRAF V600E in RML4 also occurred in participant #5. The false-negative results were repeated for confirmation using a new sample to exclude potential operational errors, which indicated that the NGS assay of participant #5 had serious technical defects.
The results showed that KRAS G12D, G12A, and G13D, and NRAS Q61K of multiplex cfDNA RM L4 failed to be detected by participant #2. KRAS G12S, G12C, and G12V, NRAS G12D, Q61R, and Q61K, and BRAF V600E failed to be detected by participant #4. KRAS G12D and G12A, and NRAS Q61K failed to be detected by participant #8. KRAS G12A failed to be detected by participant #7. These results implicated that five of eight participants missed one or more mutations when the allelic frequency was extremely low (the allelic frequency of RM L4 was approximately 0.1%). The other three participants also could not steadily detect the mutations in the two or three repetitive tests. These results implicated that when the allelic frequencies were less than 0.5% according to the value determined by ddPCR, no participant could detect all the eleven mutations steadily.
Table 3
Collaborative evaluation of the four multiplex cfDNA RMs (RMs L1-L4) by NGS
| RMs | Gene | AA Change | Lab1 | Lab2 | Lab3 | Lab4 | Lab5 | Lab6 | Lab7 | Lab8 |
|---|---|---|---|---|---|---|---|---|---|---|
| L1 | KRAS | G12S | 2.92 | 3.07 | 2.26 | 2.11 | 2.83 | 2.35 | 2.22 | 1.30 |
| KRAS | G12C | 2.13 | 2.82 | 2.22 | 3.53 | ND | 3.02 | 2.58 | 2.05 | |
| KRAS | G12D | 4.12 | 0.79 | 1.94 | 2.80 | ND | 2.31 | 2.20 | 1.90 | |
| KRAS | G12A | 3.30 | 3.08 | 2.84 | 3.20 | 2.94 | 3.38 | 3.40 | 2.28 | |
| KRAS | G12V | 2.68 | 2.02 | 2.23 | 3.27 | ND | 3.09 | 2.40 | 2.51 | |
| KRAS | G13D | 2.74 | 2.89 | 2.59 | 2.18 | 2.64 | 2.71 | 2.05 | 2.20 | |
| NRAS | G12D | 2.42 | 1.90 | / | 2.45 | 1.76 | 1.89 | 1.91 | 1.92 | |
| NRAS | Q61R | 2.93 | 2.40 | / | 2.86 | ND | 1.76 | 2.66 | 1.38 | |
| NRAS | Q61K | 4.01 | 5.50 | / | 5.13 | 5.13 | 5.28 | 4.60 | 5.02 | |
| PIK3CA | H1047R | 3.54 | / | 2.14 | / | 2.59 | 2.64 | 2.37 | 2.49 | |
| BRAF | V600E | 2.16 | 1.56 | 1.64 | 1.81 | 1.70 | 2.47 | 2.43 | 1.79 | |
| L2 | KRAS | G12S | 1.22 | 1.50 | 0.93 | 1.66 | ND | 1.69 | 1.03 | 0.74 |
| KRAS | G12C | 1.83 | 1.90 | 1.53 | 2.20 | 1.56 | 1.53 | 2.04 | 1.57 | |
| KRAS | G12D | 0.91 | 0.63 | 1.62 | 1.91 | ND | 1.60 | 1.37 | 1.32 | |
| KRAS | G12A | 1.33 | 1.22 | 1.64 | 1.72 | 1.94 | 1.63 | 1.69 | 0.91 | |
| KRAS | G12V | 1.42 | 1.11 | 1.56 | 1.78 | ND | 1.56 | 1.34 | 0.98 | |
| KRAS | G13D | 0.57 | 1.59 | 1.44 | 1.49 | 0.83 | 1.53 | 1.26 | 0.54 | |
| NRAS | G12D | 1.44 | 0.77 | / | 0.71* | 1.37 | 0.83 | 1.38 | 0.71 | |
| NRAS | Q61R | 1.48 | 1.59 | / | 1.22 | ND | 1.06 | 1.13 | 0.57* | |
| NRAS | Q61K | 2.64 | 2.69 | / | 2.23 | 1.61 | 3.22 | 2.63 | 2.02 | |
| PIK3CA | H1047R | 0.87 | / | 1.47 | / | 1.53 | 1.58 | 1.27 | 1.15 | |
| BRAF | V600E | 1.15 | 0.93 | 0.93 | 0.76 | 0.66 | 1.34 | 1.06 | 0.89 | |
| L3 | KRAS | G12S | 0.42 | 0.79 | 0.63 | 1.31 | ND | 0.73 | 0.87 | 0.74 |
| KRAS | G12C | 1.83 | 1.90 | 1.53 | 2.20 | 1.56 | 1.53 | 2.04 | 0.52* | |
| KRAS | G12D | 1.01 | 0.33* | 0.71 | 0.53* | ND | 1.07 | 0.60 | 0.96 | |
| KRAS | G12A | 0.92 | 0.90 | 0.60 | 0.74 | ND | 0.85 | 0.57 | 0.64 | |
| KRAS | G12V | 0.31 | 0.58 | 0.57 | 0.61 * | 1.08 | 1.16 | 0.80 | 0.96 | |
| KRAS | G13D | 0.89 | 0.85 | 0.61 | 0.84 | 0.75 | 0.38 | 0.81 | 0.50 | |
| NRAS | G12D | 0.90 | 0.59 | / | 0.77 | 0.38 | 0.58 | 0.60 | 0.52 | |
| NRAS | Q61R | 1.54 | 0.86 | / | 0.47* | ND | 0.59 | 0.69 | 1.07 | |
| NRAS | Q61K | 1.51 | 1.60 | / | 0.89 * | 1.61 | 1.53 | 1.19 | 1.08 | |
| PIK3CA | H1047R | 0.58 | / | 0.43 | / | 0.70 | 0.61 | 0.62 | 0.92 | |
| BRAF | V600E | 0.52 | 0.81 | 0.24 | 0.49 * | 0.45 | 0.76 | 0.92 | 0.42 | |
| L4 | KRAS | G12S | 0.38 | 0.12* | 0.13 | ND | ND | 0.08* | 0.35 | 0.29* |
| KRAS | G12C | 0.10 * | 0.20* | 0.29 | ND | 0.31 | 0.28 | 0.29 | 0.35* | |
| KRAS | G12D | 0.76 | ND | 0.29 | 0.19* | 0.40 | 0.18 * | 0.06 | ND | |
| KRAS | G12A | 0.10* | ND | 0.09 | 0.19* | ND | 0.12 | 0.00 | ND | |
| KRAS | G12V | 0.10 | 0.25* | 0.13 | ND | ND | 0.16 | 0.19 | 0.07* | |
| KRAS | G13D | 0.31* | ND | 0.02* | 0.18 * | ND | 0.11* | 0.09 | 0.45 | |
| NRAS | G12D | 0.18 | 0.06* | / | ND | 0.13 | 0.03* | 0.19* | 0.23* | |
| NRAS | Q61R | 0.09* | 0.12* | / | ND | 0.07* | 0.01* | 0.14 | 0.05* | |
| NRAS | Q61K | 0.94 | ND | / | ND | 0.18 | 0.23 | 0.12 | ND | |
| PIK3CA | H1047R | 0.45 | / | 0.11 | / | ND | 0.14 | 0.15 | 0.13* | |
| BRAF | V600E | 0.45 | 0.08* | 0.10* | ND | ND | 0.21 | 0.15* | 0.15* |
Note: The data was presented as average of two or three repetitions; /, not applicable in the panel; ND, not detected; *, different result from repetitions
Figure 4 showed the general performance of different NGS-based cancer IVDs in detecting the eleven mutations in the four RMs L1-L4. There was more than one outlier at each allelic frequency. The general performance was better at the higher allelic frequency (L1) than that at the other frequencies. The performance at detecting some mutations, such as KRAS G12D, seemed poor because of the discrete results from the eight participating manufacturers.
To evaluate the repeatability of NGS-based cancer IVDs in detecting different allelic frequencies, the CVs of each mutation in RMs L1-L4 were calculated. The results demonstrated that the CVs of RMs L1-L3 of each mutation changed slightly, while that of RMs L4 sharply increased (Figure 5). This implicated that the allelic frequency lower than 0.5% was not steadily detected by the NGS-based cancer IVDs developed by the eight participants.
Discussion
Molecular diagnosis of cancer-related mutations using NGS-based cancer IVDs has become an irreplaceable approach for clinical application. Although NGS had made great progress in genetic diagnosis during the past decade, it has also brought new challenges for its development, validation, and quality control. Therefore, well-established RMs containing selective cancer-related mutations are urgently needed. RMs provide uniform and stable sample sources that can be used to calibrate measurement techniques and experiment operations. NGS methods, which include many experimental steps and influencing factors (such as library construction, panel content, sequencing platform, database, bioinformatics approaches, and etc.), could result in more variation and inconsistency. However, precision medicine requires accurate and reliable genetic information to guide the treatment of cancer patients [36].
Figure 4
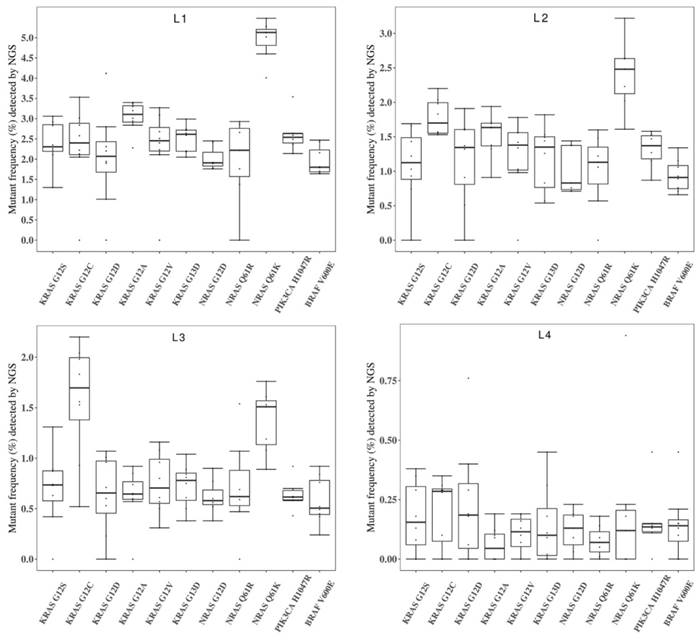
Collaborative evaluation of the performance of NGS-based cancer IVDs in detecting the eleven mutations in the multiplex cfDNA RMs L1-L4. (A) The multiplex cfDNA RMs L1; (B) the multiplex cfDNA RMs L2; (C) the multiplex cfDNA RMs L3; and (D) the multiplex cfDNA RMs L4. The data of undetected cases were excluded in the diagram. Each dot represented the mutant frequency result of one participant. The inter-quartile ranges were shown as a box-and-whisker plot.
Figure 5
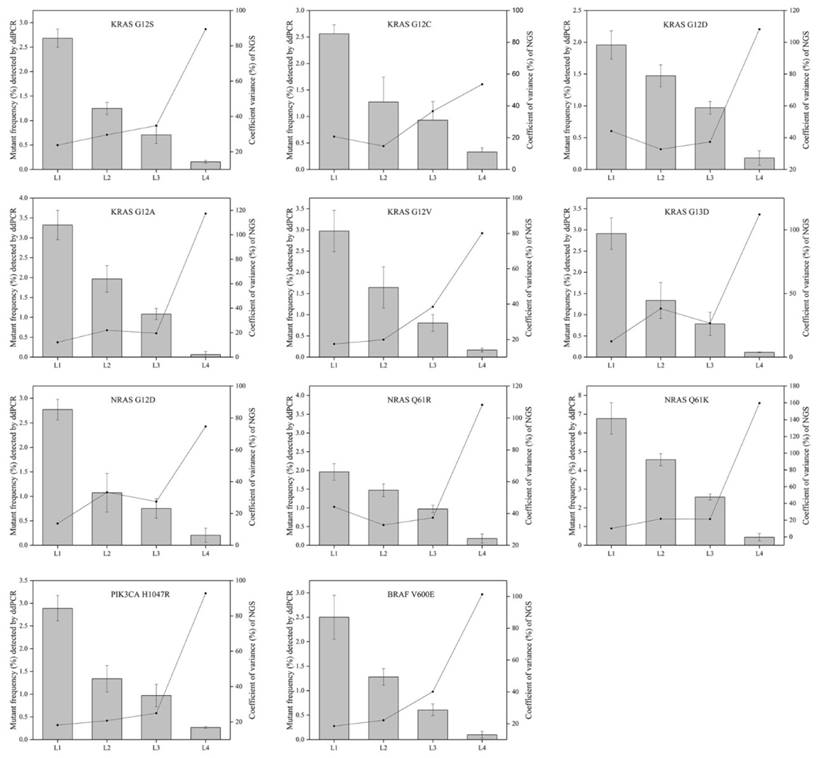
The relevance of allelic frequency and CV for the eleven mutations by the NGS-based cancer IVDs from the eight participants. Bars indicated mutant frequency values as means±SD and the dots represented the CV (%) of allelic frequencies of RMs determined by the NGS assays of the eight participants.
In the recent years, more manufacturers have developed and provided in-house NGS-based cancer IVDs for determination of cancer-related mutations in formalin-fixed paraffin-embedded (FFPE) and/or blood samples. However, their clinical performance has not been fully evaluated under a universally accepted standard. The National Institutes for Food and Drug Control (NIFDC) has developed national reference materials for the quality control of IVDs [37]. Therefore, we designed this study for the investigation of a preparation of multiplex cfDNA RMs for the quality control of NGS-based IVDs. Compared to cfDNA RMs, the synthetic plasma could provide a whole process control to validate and develop new NGS assays. Although the synthetic plasma could better mimic an actual patient sample, it could have many problems, resulting in unsatisfactory RMs that do not meet certain requirements, such as batch reproducibility, great quantity to supply, long storage life, and etc [38]. The set of RMs included four mutant-negative RMs N1-N4 and four mutant-positive multiplex cfDNA RMs L1-L4 with desired allelic frequencies of 2%, 1%, 0.5%, and 0.1%.
The allelic frequencies were designed at different levels for different types of RMs. The allelic frequency of the FFPE sample was usually higher than that of the plasma sample for the same mutation [35]. Thus, the multiplex cfDNA RMs of 2% allelic frequencies could be used as quality control for the FFPE sample, while the other multiplex cfDNA RMs of 1%, 0.5%, and 0.1% allelic frequencies could be used as quality control for the plasma sample. If liquid biopsy was integrated into the management of cancer in the future, the multiplex cfDNA RMs of low allelic frequency would be especially important for quality control. Overall, multiplex cfDNA RMs L1-L4 are necessary for NGS-based cancer IVDs by reducing the risk of false-negative and false-positive results.
The RMs studied in this paper were developed for detecting eleven mutations in four mutant-positive controls at different allelic frequencies and false-positive mutations in four mutant-negative controls. The actual values of allelic frequencies for all mutant-negative and -positive RMs were quantified and validated by ddPCR in triplicate before distribution for the collaborative evaluation. The ddPCR was a widely accepted method for detecting samples with low allelic frequencies and could read absolute copies in low content samples.
The results of validation and quantitation showed that the allelic frequencies determined by ddPCR were slightly different from the expected value, nevertheless, the quantitation of mutant allelic frequencies was stable regardless of the validation method used (ddPCR or NGS assay). Conceivably, the data from NGS sequencing had a slight difference from that of ddPCR, which was likely associated with platform-specific biases. When the input DNA was as low as 20 ng, the difference between the two platforms was acceptable, which indicated that the RMs were suitable for the quality control of cfDNA testing. Values of r>0.9 or r2>0.81 indicate good concordance [39]. Although the mutant frequencies determined by ddPCR were higher than those detected by NGS assay for some mutations, such as NRAS Q61R and Q61K, the good relevance of the two assays was observed for the eleven mutations studied.
The established cfDNA RMs were applied for the collaborative evaluation of the performance of the NGS-based IVDs. Some important colorectal cancer-related sites were not applicable for some IVDs, such as PIK3CA H1047R for Lab2 and Lab4, NRAS G12D, Q61R, Q61K for Lab3 (Table 3), indicating some deficits in these IVDs for the detection of some colorectal cancer-related mutations. In the evaluation of mutant-negative cfDNA RMs N1-N4 by the participants, some false-positive detection was observed. Although the specific false-positive detections were not repeated in all four mutant-negative cfDNA RMs, this suggested a higher risk of false-positive reports in these IVDs.
The CVs increased with decreasing allelic frequency in the present study, which indicated that NGS-based cancer IVDs detecting samples at a high allelic frequency had a better repeatability than those at a low allelic frequency (Figure 5). For the mutations in the multiplex cfDNA RMs L4 (the allelic frequency was under 0.5%), all the manufacturers could not steadily detect all the eleven mutations (Table 3).
The multiplex cfDNA RMs L1-L4 with a serial allelic frequency of each mutation were suitable for assessing the detectability in this collaborative study. The box-and-whiskers plots (Figure 4) showed the general performance of the eight participants. All the manufacturers, expect Lab5, reported reasonable results for most of the included mutations. For Lab5, KRAS G12C was totally missed in the multiplex cfDNA RMs L1 and detected in a lower frequency in the multiplex cfDNA RMs L2-L4. Also, unsteady results were observed in Lab4 and Lab8. These results indicated that the variations between NGS assays were complicated, which highlighted the necessity of the multiplex cfDNA RMs for validating the performance of NGS assays.
While the developed multiplex cfDNA RMs L1-L4 had many strong advantages for estimating the performance of NGS-based IVDs, especially for colorectal cancer-related mutations in cfDNA, their limitations should be noticed. The developed RMs did not cover the process of DNA extraction and were not suitable for the performance evaluation of cfDNA extraction agent or blood collection, storage, and delivery. The eleven mutations in the developed multiplex cfDNA RMs from four genes are the most well-studied mutations for colorectal cancer tolerance, all of which are single nucleotide variants (SNVs). Herein, the multiplex cfDNA RMs were not suitable for quality control of insertion-deletion mutations (indels), copy number variants (CNVs) and gene fusions. All the SNVs, indels, CNVs and gene fusions could be involved in further developed multiplex cfDNA RMs based on more tumor cell lines containing these variants. We mixed nine cell lines containing eleven mutations so that it was difficult to maintain the frequencies of all the mutations at the same level. However, each mutant-positive multiplex cfDNA RM could be used as one sample to obtain information for the allelic frequencies of all eleven mutations.
In conclusion, we established four mutant-negative cfDNA RMs N1-N4 and four mutant-positive multiplex cfDNA RMs L1-L4 mimicking peripheral blood samples, which could monitor the whole process of the NGS assay from library construction, except for nucleic acid extraction. Subsequently, we conducted a collaborative evaluation study for the performance of NGS-based cancer IVDs for plasma samples. The results from the eight participants indicated that their general performance would vary according to different frequencies of samples, suggesting that multiplex cfDNA RMs, especially those with an allelic frequency lower than 0.5%, are necessary for liquid biopsy to avoid false-negative results.
Abbreviations
NGS: Next-generation sequencing; IVDs: In vitro diagnostic tests; cfDNA: Cell free deoxyribonucleic acid; ddPCR: Droplet digital polymerase chain reaction; CV: Coefficient of variation; gDNA: Genomic deoxyribonucleic acid; NIFDC: The National Institutes for Food and Drug Control; EGFR: epidermal growth factor receptor; KRAS: kirsten rat sarcoma viral oncogene; NRAS: neuroblastoma ras oncogene; PIK3CA: phosphatidylinositol-4,5-bisphosphate 3-kinase catalytic subunit alpha; BRAF: B-Raf proto-oncogene, serine/threonine kinase.
Acknowledgements
The authors would like to thank Genosaber Biotech Co. Ltd., Geneplus-Beijing, BGI-Shenzhen, Annoroad Gene Technology Co., Ltd., Berry Genomics Co., Ltd., HaploX Biotechnology Co., Ltd. and Genetron Health Biotech Co., Ltd. for detailed data and hard work in the collaborative evaluation.
Competing Interests
The authors have declared that no competing interest exists.
References
1. Bieg-Bourne CC, Millis SZ, Piccioni DE. et al. Next-Generation Sequencing in the Clinical Setting Clarifies Patient Characteristics and Potential Actionability. Cancer Res. 2017;77:6313-20
2. Merker JD, Oxnard GR, Compton C. et al. Circulating tumor DNA analysis in patients with cancer: American Society of Clinical Oncology and College of American Pathologists Joint Review. J Clin Oncol. 2018 doi: 10.1200/JCO.2017.76.8671
3. Sorenson GD, Pribish DM, Valone FH. et al. Soluble normal and mutated DNA sequences from single-copy genes in human blood. Cancer Epidemiol Biomarkers Prev. 1994;3:67-71
4. Swisher EM, Wollan M, Mahtani SM. et al. Tumor-specific p53 sequences in blood and peritoneal fluid of women with epithelial ovarian cancer. Am J Obstet Gynecol. 2005;193:662-7
5. Kimura H, Kasahara K, Kawaishi M. et al. Detection of epidermal growth factor receptor mutations in serum as a predictor of the response to gefitinib in patients with non-small-cell lung cancer. Clin Cancer Res. 2006;12:3915-21
6. Sozzi G, Musso K Ratcliffe C. et al. Detection of microsatellite alterations in plasma DNA of non-small-cell lung cancer patients: a prospect for early diagnosis. Clin Cancer Res. 1999;5:2689-92
7. Siravegna G, Marsoni S, Siena S. et al. Integrating liquid biopsies into the management of cancer. Nature Rev. 2017;14:531-48
8. Frattin M, Gallino G, Signoroni S. et al. Quantitative and qualitative characterization of plasma DNA identifies primary and recurrent colorectal cancer. Cancer Lett. 2008;263:170-81
9. Chen X, Bonnefoi H, Diebold-Berger S. et al. Detecting tumor-related alterations in plasma or serum DNA of patients diagnosed with breast cancer. Clin Cancer Res. 1999;5:2297-303
10. Dawson SJ, Tsui DW, Murtaza M. et al. Analysis of circulating tumor DNA to monitor metastatic breast cancer. N Engl J Med. 2013;368:1199-209
11. Misale S, Yaeger R, Hobor S. et al. Emergence of KRAS mutations and acquired resistance to anti-EGFR therapy in colorectal cancer. Nature. 2012;486:532-6
12. Garcia-Murillas I, Schiavon G, Weigelt B. et al. Mutation tracking in circulating tumor DNA predicts relapse in early breast cancer. Sci Transl Med. 2015;7:302ra133
13. Millholland JM, Li S, Fernandez CA. et al. Detection of low frequency FGFR3 mutations in the urine of bladder cancer patients using next-generation deep sequencing. Res Rep Urol. 2012;4:33-40
14. Ward DG, Bryan RT. Liquid biopsies for bladder cancer. Transl Androl Urol. 2017;6:331-5
15. Wang Y, Springer S, Mulvey CL. et al. Detection of somatic mutations and HPV in the saliva and plasma of patients with head and neck squamous cell carcinomas. Sci Transl Med. 2015;7:293ra104
16. Pan W, Gu W, Nagpa S. et al. Brain Tumor Mutations Detected in Cerebral Spinal Fluid. Clin Chem. 2015;61:514-22
17. Kimura H, Fujiwara Y, Sone T. et al. EGFR mutation status in tumor-derived DNA from pleural effusion fluid is a practical basis for predicting the response to gefitinib. Br J Cancer. 2006;95:1390-5
18. Kuderer NM, Burton KA, Blau S. et al. Comparison of 2 commercially available next-generation sequencing platforms in oncology. JAMA Oncol. 2017;3:996-8
19. Hardwick SA, Deveson IW, Mercer TR. Reference standards for next-generation sequencing. Nat Rev Genet. 2017;18:473-84
20. Lin G, Zhang K, Han Y. et al. Quality control materials for pharmacogenomic testing in the clinic. Clin Chem Lab Med. 2017;55:926-33
21. Gargis AS, Kalman L, Berry MW. et al. Assuring the quality of next-generation sequencing in clinical laboratory practice. Nat Biotechnol. 2012;30:1033-6
22. Deveson IW, Chen WY, Wong T. et al. Representing genetic variation with synthetic DNA standards. Nat. Methods. 2016;13:784-95
23. Baker SC, Bauer SR, Beyer RP. et al. The external RNA controls consortium: a progress report. Nat Methods. 2005;10:731-4
24. Zhang R, Peng R, Li Z. et al. Synthetic circulating cell-free DNA as quality control materials for somatic mutation detection in liquid biopsy for cancer. Clin Chem. 2017;63:1465-75
25. Strom CM, Janeczko RA, Anderson B. et al. Technical validation of a multiplex platform to detect thirty mutations in eight genetic diseases prevalent in individuals of Ashkenazi Jewish descent. Genet Med. 2005;7:633-9
26. Tsongalis GJ, Peterson JD, de Abreu FB. et al. Routine use of the Ion Torrent AmpliSeqTM Cancer Hotspot Panel for identification of clinically actionable somatic mutations. Clin Chem Lab Med. 2014;52:707-14
27. Quail MA, Kozarewa I, Smith F. et al. A large genome center's improvements to the Illumina sequencing system. Nat Methods. 2008;12:1005-10
28. Fisher S, Barry A, Abreu J. et al. A scalable, fully automated process for construction of sequence-ready human exome targeted capture libraries. Genome Biol. 2011;12:R1
29. Siegel RL, Miller KD, Jemal A. Cancer statistics, 2016. CA Cancer J Clin. 2016;66:7-30
30. Benson AB 3rd, Venook AP, Cederquist L. et al. Colon Cancer, Version 1. 2017, NCCN Clinical Practice Guidelines in Oncology. J Natl Compr Canc Netw. 2017;15:370-98
31. Linardou H, Briasoulis E, Dahabreh IJ. et al. All about KRAS for clinical oncology practice: gene profile, clinical implications and laboratory recommendations for somatic mutational testing in colorectal cancer. Cancer Treat Rev. 2011;37:221-33
32. Allegra CJ, Rumble RB, Hamilton SR. et al. Extended RAS gene mutation testing in metastatic colorectal carcinoma to predict response to anti-epidermal growth factor receptor monoclonal antibody therapy: American Society of Clinical Oncology Provisional Clinical Opinion Update 2015. J Clin Oncol. 2016;34:179-85
33. De Roock W, Claes B, Bernasconi D. et al. Effects of KRAS, BRAF, NRAS, and PIK3CA mutations on the efficacy of cetuximab plus chemotherapy in chemotherapy-refractory metastatic colorectal cancer: a retrospective consortium analysis. Lancet Oncol. 2010;11:753-62
34. Zhu G, Ye X, Dong Z. et al. Highly sensitive droplet digital PCR method for detection of EGFR-activating mutations in plasma cell-free DNA from patients with advanced non-small cell lung cancer. J Mol. Diagn. 2015;17:265-72
35. He Y, Zhang X, Wang L. et al. Detection of cancer specific mutations in early-stage non-small cell lung cancer using cell-free DNA by targeted sequencing. Int J Oncol. 2016;49:2351-8
36. Wan JC, Massie C, Garcia-Corbacho J. et al. Liquid biopsies come of age: towards implementation of circulating tumor DNA. Nat Rev Cancer. 2017;17:223-38
37. Liu D, Zhou H, Shi D. et al. Quality Control of Next-generation Sequencing-based In vitro Diagnostic Test for Onco-relevant Mutations Using Multiplex Reference Materials in Plasma. J Cancer. 2018;9:1680-8
38. Hardwick SA, Deveson IW, Mercer TR. Reference standards for next-generation sequencing. Nat Rev Genet. 2017;18:473-84
39. Kizys MM, Cardoso MG, Lindsey SC. et al. Optimizing nucleic acid extraction from thyroid fine-needle aspiration cells in stained slides, formalin-fixed/paraffin-embedded tissues, and long-term stored blood samples. Arq Bras Endocrinol Metabol. 2012;56:618-26
Author contact
![]() Corresponding authors: Chuntao Zhang. Address: TiantanXili #2, Dongcheng District, Beijing 100050, China. Email: zhangchuntaoorg.cn; Tel: +86-10-67095433, Fax: +86-10-67095433; Youchun Wang. Address: Huatuo Road #31, Daxing District, Beijing 100176, China. Email: wangycorg.cn; Tel: +86-10-53851712, Fax: +86-10-53851722
Corresponding authors: Chuntao Zhang. Address: TiantanXili #2, Dongcheng District, Beijing 100050, China. Email: zhangchuntaoorg.cn; Tel: +86-10-67095433, Fax: +86-10-67095433; Youchun Wang. Address: Huatuo Road #31, Daxing District, Beijing 100176, China. Email: wangycorg.cn; Tel: +86-10-53851712, Fax: +86-10-53851722
Citation styles
APA
Liu, D., Zhang, X., Zhou, H., Lin, X., Shi, D., Shen, S., Tian, Y., Du, B., Zhang, H., Wang, H., Wang, Y., Zhang, C. (2018). Multiplex Cell-Free DNA Reference Materials for Quality Control of Next-Generation Sequencing-Based In Vitro Diagnostic Tests of Colorectal Cancer Tolerance. Journal of Cancer, 9(20), 3812-3823. https://doi.org/10.7150/jca.26816.
ACS
Liu, D.; Zhang, X.; Zhou, H.; Lin, X.; Shi, D.; Shen, S.; Tian, Y.; Du, B.; Zhang, H.; Wang, H.; Wang, Y.; Zhang, C. Multiplex Cell-Free DNA Reference Materials for Quality Control of Next-Generation Sequencing-Based In Vitro Diagnostic Tests of Colorectal Cancer Tolerance. J. Cancer 2018, 9 (20), 3812-3823. DOI: 10.7150/jca.26816.
NLM
Liu D, Zhang X, Zhou H, Lin X, Shi D, Shen S, Tian Y, Du B, Zhang H, Wang H, Wang Y, Zhang C. Multiplex Cell-Free DNA Reference Materials for Quality Control of Next-Generation Sequencing-Based In Vitro Diagnostic Tests of Colorectal Cancer Tolerance. J Cancer 2018; 9(20):3812-3823. doi:10.7150/jca.26816. https://www.jcancer.org/v09p3812.htm
CSE
Liu D, Zhang X, Zhou H, Lin X, Shi D, Shen S, Tian Y, Du B, Zhang H, Wang H, Wang Y, Zhang C. 2018. Multiplex Cell-Free DNA Reference Materials for Quality Control of Next-Generation Sequencing-Based In Vitro Diagnostic Tests of Colorectal Cancer Tolerance. J Cancer. 9(20):3812-3823.
This is an open access article distributed under the terms of the Creative Commons Attribution (CC BY-NC) license (https://creativecommons.org/licenses/by-nc/4.0/). See http://ivyspring.com/terms for full terms and conditions.