Journal of Cancer
ISSN: 1837-9664
3.2
Impact Factor
ISSN: 1837-9664

 Global reach, higher impact
J Cancer 2018; 9(18):3278-3286. doi:10.7150/jca.25775 This issue Cite
Research Paper
The Expression of FAP in Hepatocellular Carcinoma Cells is Induced by Hypoxia and Correlates with Poor Clinical Outcomes
Baojia Zou1,#, Xialei Liu1,#, Baimeng Zhang1,#, Yihang Gong1, Chaonong Cai1, Peiping Li1, Jiafan Chen1, Shan Xing2,3, Jianxu Chen1, Siqi Peng4, Bibesh Pokhrel1, Lei Ding1, Linjuan Zeng 4, ![]() , Jian Li1,
, Jian Li1, ![]()
1. Department of Hepatobiliary Surgery, The Fifth Affiliated Hospital of Sun Yat-sen University, Zhuhai 519000, China
2. State Key Laboratory of Oncology in Southern China, Collaborative Innovation Center for Cancer Medicine, Guangzhou 510060, China
3. Sun Yat-sen University Cancer Center, Department of Clinical Laboratory, Guangzhou 510060, China
4. Department of Oncology, The Fifth Affiliated Hospital of Sun Yat-sen University, Zhuhai 519000, China
# These authors contributed equally to this work.
Received 2018-2-27; Accepted 2018-8-2; Published 2018-9-7
Citation:
Zou B, Liu X, Zhang B, Gong Y, Cai C, Li P, Chen J, Xing S, Chen J, Peng S, Pokhrel B, Ding L, Zeng L, Li J. The Expression of FAP in Hepatocellular Carcinoma Cells is Induced by Hypoxia and Correlates with Poor Clinical Outcomes. J Cancer 2018; 9(18):3278-3286. doi:10.7150/jca.25775. https://www.jcancer.org/v09p3278.htm
Other stylesAbstract
Fibroblast activation protein (FAP) is a serine protease that has been reported in fibroblasts and some carcinoma cells, which correlates with poor patient outcomes. FAP can be induced under hypoxia which is also vital in the malignant behaviors of cancer cells. However, the role of FAP and its correlation with hypoxia has not been investigated in HCC cancer cells. In tissues from post-surgical HCC patients in our center, we adopted immunohistochemistry staining (IHC), western blot and quantitative RT-PCR to detect the expression levels of FAP and the hypoxia related marker, hypoxia inducible factor 1α (HIF-1α). X-tile software was used for the determination of high and low expression of FAP and HIF-1α after the IHC analysis. Clinicopathological analysis, Kaplan-Meier analysis and Cox regression model were performed. In-vitro experiments were performed to confirm the relationship between FAP and hypoxia in HCC cancer cell lines (HepG2, Huh7 and MHCC97H). Results revealed that expression levels of FAP and HIF-1α were significantly correlated (Pearson r2 = 0.2753, p < 0.0001) in IHC analysis of the 138-patient cohort. Western blot and quantity RT-PCR indicated parallel changes in 11 post-surgical fresh frozen tissues. The HIF-1α and FAP expression were associated with serum AFP, TNM, tumor size and vascular invasion. Cox regression analysis showed that HIF-1α/ FAP combination were the independent predictor for overall survival (OS) and time-to-recurrence (TTR) in post-surgical HCC patients. Kaplan-Meier analyses revealed that the patient with high levels of HIF-1α, FAP and combined HIF-1α/FAP had the shortest OS and TTR. In-vitro experiments showed that FAP was increased in hypoxic HCC cancer cell lines in parallel with that of HIF-1α and three EMT markers (E-cadherin, Snail and TWIST). In conclusion, the up-regulation of FAP in HCC cancer cells under hypoxia can be indicative of poor prognosis in patients.
Keywords: Hepatocellular carcinoma (HCC), prognosis, Fibroblast activation protein (FAP), hypoxia inducible factor 1α (HIF-1α)
Background
Liver cancer is one of the most frequent causes of cancer-related death globally [1]. Hepatocellular carcinoma (HCC) accounts for 70% to 90% of primary cancers in the liver. The 5-year recurrence rate after radical resection is up to 70% [2, 3]. Although great efforts have been made in the treatment of HCC, the survival rate remains dismal. Therefore it is still imperative to search for novel biomarkers to improve the prognosis of HCC patients.
Fibroblast activation protein (FAP) used to be reported as a serine protease commonly expressed by the active cancer associated fibroblasts (CAFs), which facilitate aggressive tumoral behaviors [4, 5]. More recent studies revealed that the up-regulation of FAP is not limited to CAFs, as it can also be found within different cancer cells, which has been revealed to be oncogenic [6-9]. However, the reports concerning parenchymal cancer cells in HCC remain scarce.
Hypoxia in tumor tissues is a potent factor that induces the expression of FAP in CAFs [10]. Besides, it is believed to be an important reason underlying HCC progression. It causes invasive cancer phenotypes, which can be mediated by the increased expression of hypoxia inducible factor 1α (HIF-1α) in tumor cells. FAP-expressing CAFs are known to protect tumor cells from hypoxia [11]. But inside cancer cells, the relationship between hypoxia and FAP remains unclear.
Therefore, we hypothesized that the expression of FAP correlates with hypoxia in HCC cancer cells and affects the outcomes of patients. In the present study, we investigated whether FAP is induced by hypoxia in HCC cancer cells and how it is associated with tumor progression and the prognosis of HCC patients.
Materials and methods
Patients and specimens
Paraffin-embedded specimens were obtained from a cohort of 138 HCC patients after surgery. Another 11 fresh tissue samples were also collected immediately after surgical resections, then frozen and stored at -80 °C, for RNA and protein isolation. All patients were pathologically confirmed HCC and received their primary surgical resections between the year 2010 and 2015, in the 5th affiliated hospital, Sun Yat-sen University, Guangdong Province, People's Republic of China. Follow-up were performed by four independent physicians unaware of the study. The follow-up endpoint was assessed as the time to one of the defining events: (i) disease recurrence, (ii) disease-related death. The median follow-up for the entire cohort was 33.2 months (95%CI, 26.2-40 months, range 1.1-80.2 months). The TNM staging were determined according to the 2010 American Joint Committee on Cancer (AJCC) staging system. The classification of early and advanced tumors was done as previous studies [12, 13]. Overall survival (OS) was defined as the interval between surgical resection and the date of death or last follow-up. The time-to-recurrence (TTR) was defined as “from the date of surgery until tumor recurrence, death or last follow-up”. All samples were obtained with informed consent, and the study was approved by the Institutional Ethical Review Board of the 5th affiliated hospital, Sun Yat-sen University.
Immunohistochemistry staining (IHC)
IHC staining determination of HIF-1α and FAP expression was performed as previous report [14]. Before IHC staining, the tissue sections were HE-stained and reviewed by two experienced pathologists. HIF-1α was detected using a rabbit monoclonal antibody against HIF-1α (Boster, PB0245, China), while FAP was detected using a rabbit monoclonal antibody against FAP (Boster, BM5121, China). Briefly, paraffin-embedded specimens' cylinders were sectioned into 4μm-thickness and baked at 70°C for 60minutes, and the paraffin sections of the HCC specimens were de-paraffinized in xylene and immediately rehydrated via gradient alcohol. Then the sections were bathed in the blocking buffer (3%hydrogen peroxide) for endogenous peroxidase for 15minutes. The antigenic unmasking was done by citric acid under high temperature and high pressure, and cooling was made naturally. Then, non-specific binding sites were blocked with the goat serum. The tissue sections were incubated with anti- HIF-1α antibody at a dilution of 1:200 and anti-FAP antibody at a dilution of 1:400 for 12 hours at 4°C. Subsequently, anti-rabbit IgG-HRP-linked secondary antibody was applied for 30 minutes at 37°C. Then, the sections were developed with 3-diaminobenzidinetetrahydrochloride (DAB). Mayer's hematoxylin was applied for 5 minutes as counterstain. Negative control included in all assays: slides incubated with secondary antibody only (Figure S1). Positive control used in this study is the mesenchymal fibroblasts stained positive for FAP (Figure 1E), we also refer to the positive results in various cancer cells including HCC from previous studies [5, 15, 16]. Photographs of representative fields were captured under ZEISS N-ACHROPLAN microscope (ZEISS, Germany). The integrated optical density (IOD) measurement was performed as the method previously reported [17, 18]. The IODs of the taken pictures were measured and analyzed in the Image-Pro Plus v6.0 software (Media Cybernetics Inc, Bethesda, MD, USA). The process is shown in the supplementary materials (Figure S2). In brief, three parameters were obtained (area sum, mean density, and IOD). The mean IOD and mean area were calculated from all taken photographs. Subsequently, the mean IOD was divided by the mean area as the relative IOD of specimen. The relative IOD was used for the analysis in this study.
X-tile determinaton of low/high expression
X-tile analysis was used for assessment of HIF-1α and FAP expression which was represented by optimal cut-off points of the relative IODs based on patients' outcome [19]. The cut-off points were made to determine the low and high expression of HIF-1a and FAP. Statistical significance was assessed as the cut-off score derived from the 138 cases by a standard log-rank method, with P values.
Cell lines and cell culture agents
The HCC cell lines (Huh7, Bel-7402, and HepG2) were cultured in DMEM medium (Gibco, USA), supplemented with 10 % fetal bovine serum, 50 U/mol penicillin and 50 mg/ml streptomycin (Sigma-Aldrich, USA) and maintained in a humidified incubator at 37 °C with 5 % CO2. All cell lines were obtained from Cancer Center, Sun Yat-sen University, Guangzhou, Guangdong, People's Republic of China, and their background information has been described [20-22]. Cellular hypoxia was performed by use of Cobalt Chloride (CoCl2, Sigma-Aldrich, USA). A concentration of 100 μM CoCl2 was used for hypoxia induction, meanwhile PBS was used as control.
Protein extraction and western blot
Total protein from tissue specimens and cells was extracted by sample buffer (62.5 mmol/L Tris-HCl, pH 6.8, 2% SDS, 10% glycerol, and 5% 2-β-mercaptoethanol, Sigma-Aldrich, USA). The concentrations of protein were then determined using the BCA protein assay kit (Beyotime, China). Western blot analysis was performed as described [14]. Briefly, after being separated in SDS-PAGE gels, proteins were transferred to nitrocellulose membranes (Bio-Rad, USA). The membranes were then incubated with different primary antibodies at 4°C, overnight. Afterwards, respective secondary antibodies were applied at room temperature for 1hour. ECL development solution was manipulated for the visualization of the expression of different protein. The antibodies used are listed as follow: anti-HIF-1α (dilution at 1:1000, A11945, Abclonal, China), anti-FAP (dilution at 1:800, BM5121, Boster, China), anti-E-cadherin (dilution at 1:1000, 3195, CST, USA), anti-Twist (dilution at 1:1000, ab175430, Abcam, England), anti-Snail (dilution at 1:1000, ab53519, Abcam, England).
RNA isolation and quantitative RT‑PCR
Total RNA was extracted using RNAiso Plus (Takara Bio, China) following the manufacturer's instructions. The cDNA was synthesized from total RNA by TaKaRa One Step RNA PCR Kit (AMV) (Takara Bio, China). Relative expressions of different genes were detected by the PowerUp SYBR Master Mix Applied Biosystems (Invitrogen, USA). Each PCR reaction was run in at least 3 independent experiments using the Eppendorf Realplex system (Eppendorf AG, Germany). The comparative Ct method (ΔCt) was applied to calculate the relative expression levels, which was then normalized by the expression of β-actin. The primer sequences were either designed on the NCBI website (http://www.ncbi.nlm.nih.gov/tools/primer-blast) and the PrimerBank website (http://pga.mgh.harvard.edu/primerbank/). The primers used are listed as follows:
FAP: forward 5'ATGAGCTTCCTCGTCCAATTCA3'; reverse 5'AGACCACCAGAGAGCATATTTTG3'; HIF-1-α: forward 5'GAACGTCGAAAAGAAAAGTCTCG3'; reverse 5'CCTTATCAAGATGCGAACTCACA3'; β-actin: forward 5'CATGTACGTTGCTATCCAGGC3'; reverse 5'CTCCTTAATGTCACGCACGAT3'.
Statistical analysis
Statistical analyses were performed with the statistical software package SPSS16.0 (SPSS, Inc., Chicago, IL. USA) and the GraphPad Prism version 6.00 for Windows (GraphPad Software, La Jolla California USA). Optimal cutoff point for survival analyses of HIF-1α and FAP expression was determined by the X-tile software version 3.6.1 (Yale University School of Medicine, New Haven, CT, USA). The results were presented as the mean ± standard deviation (SD). Pearson correlation test was applied between the expression of HIF-1a and FAP in IHC. Kaplan-Meier Survival analysis and the log-rank test were used to plot the disease-free survival curve in HCC patients. COX proportional hazards regression, univariate survival analysis and correlations between different factors were carried out in the statistical software package SPSS16.0 (SPSS, Inc., Chicago, IL. USA). It was considered statistically significant when the p value < 0.05.
Results
The correlation between HIF-1α and FAP expressions in HCC tissues
The staining by IHC revealed that FAP in HCC patient tissues were common in both mesenchymal cells and tumor cells. The representative low and high expression pictures of HIF-1α and FAP were shown. Specifically FAP expression within tumor cells was associated with tumoral hypoxia, which was indicated by the expression of HIF-1α (Figure 1). The relative IODs of HIF-1α and FAP from the 138-patient cohort were determined as the expression within cancer cells (examples shown as figure 1A-D, but not the stroma of the tissues (example shown as figure 1E). As in Figure 1F the expression levels of HIF-1α and FAP were significantly correlated (Pearson r2 = 0.2753, p < 0.0001).
Fresh frozen specimens from 11 patients were also analyzed to further investigate the expression of HIF-1α and FAP in western blot and Real-time Quantitative PCR (q-RT-PCR). HIF-1α and FAP were up-regulated in advance-staged HCC tumors, compared to early lesions, which indicated their roles in progression of HCC. Figure 2A and 2B showed that expression of HIF-1α and FAP increased significantly in staged II-IV patients (HIF-1α, p=0.0120; FAP, p=0.0011). The mRNA levels were also significant in accordance (HIF-1α, p=0.0152; FAP, p=0.0307).
Figure 1
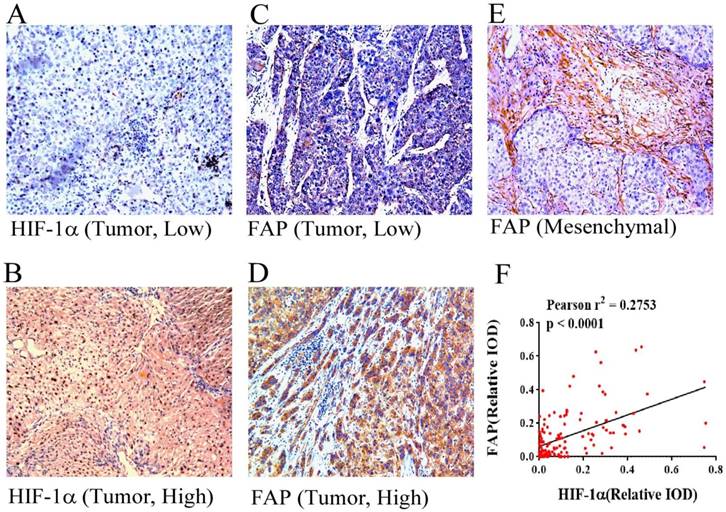
HIF-1α and FAP expression in HCC tissues by immunohistochemistry. Different expression features of HIF-1α in HCC tissue: low expression (A) and high expression (B) (×100). Different expression features of HIF-1α in HCC tissue within the tumor cells: low expression (C) and high expression (D) (×100). Picture reveals mesenchymal expression of FAP in HCC tissue (E). (F) Pearson' correlation test with scatter plot showing the correlation between the density of HIF-1α and FAP after IHC staining, each dot represents a case. (Pearson r2 = 0.2753, p < 0.0001)
Figure 2
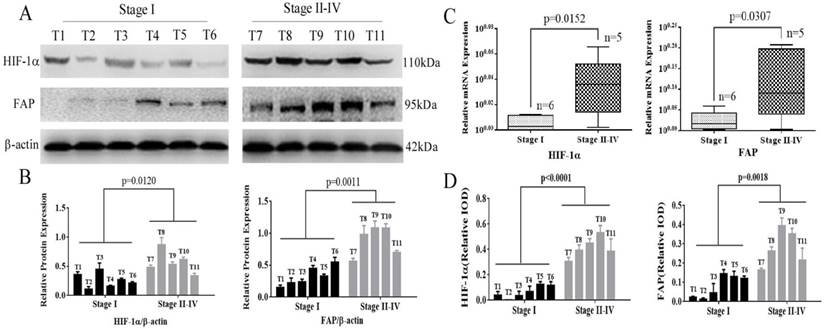
HIF-1α and FAP expression in HCC tissues determined by Wetern blot and q-RT-PCR. (A) Western blot detection of HIF-1α and FAP expression in 11 HCC tissue of different stages (I-IV). (B) Grey analysis of the Western blot results: both HIF-1α and FAP expressions significantly increased in advanced-staged (stage II-IV) HCC tissue (HIF-1α, p=0.0120; FAP, p=0.0011). (C) The mRNA expression of HIF-1α and FAP detected by q-RT-PCR shows that mRNA expression levels also increased in advanced-staged HCC tissues compared to early-staged lesions for both HIF-1α (p=0.0152) and FAP (p=0.0307). (D) The expression of HIF-1α and FAP within tumor cells in these tissues by IHC staining. (Note: T7 and T8 is stage-II tumor tissues)
Table 1
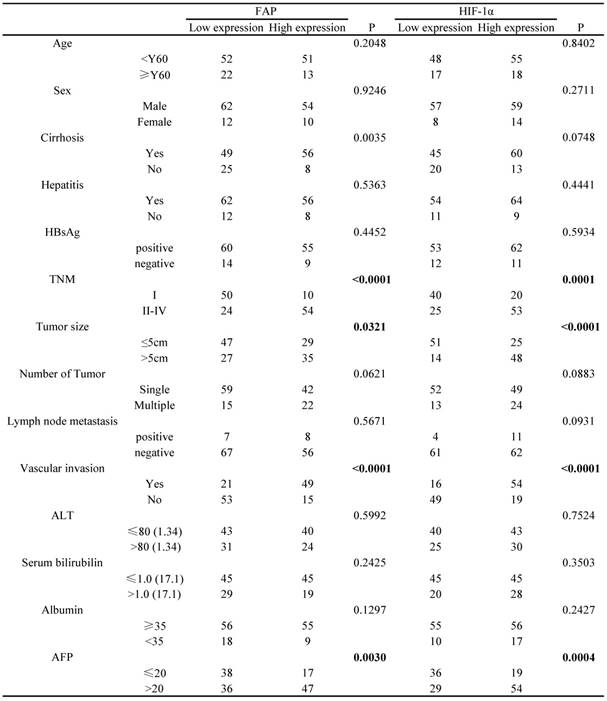
Association of FAP and HIF-1a expression with clinicopathological features in 138 cases of HCC patients
Note: stage II HCC cases (59)
Correlation of HIF-1α and FAP expression with clinicopathological features of HCC patients
The cut-off points determining HIF-1α and FAP expression level (low and high expression) in the 138 HCC patients cohort were based on the relative IODs and clinical prognosis (OS and TTR), which were defined in the X-tile program when the p values were minimum with optimal standard log-rank method plotted for both OS and TTR. Accordingly, the cohort was divided into low HIF-1α expression group (65 cases) and high HIF-1α expression group (73 cases); meanwhile, low FAP expression group (74 cases) and high FAP expression group (64 cases).
Based on such results, we further explored the association between the different clinicopathological factors and the expression level of HIF-1α and FAP in the 138 HCC patients' cohort. The results showed that HIF-1α expression were associated with serum AFP (p=0.0004), TNM (p=0.0001), tumor size (<0.0001), vascular invasion (<0.0001), and did not significantly associated with other factors (Table 1). Meanwhile, FAP expression was associated with serum AFP (p=0.003), TNM (p<0.0001), tumor size (p=0.0321), vascular invasion (<0.0001) (Table 1).
HIF-1α and FAP expression for HCC patient's clinical outcomes analysis
Kaplan-Meier analysis based on HIF-1α and FAP expression levels were then performed to plot the OS and TTR curves. Results revealed that mean OS interval in high HIF-1α expressing HCC patients was 36.5 months, compared with 70.7 months in those expressing low levels of HIF-1α (p < 0.0001, log-rank test; Figure 3A). The mean TTR interval in high HIF-1α expressing HCC patients was 25.2 months, compared with those expressing low levels of HIF-1α was 56.5 months (p < 0.0001, log-rank test; Figure 3 B). For FAP, the mean OS interval in high FAP expressing HCC patients was 34.8 months, compared with 71.1 months for those expressing low levels of FAP (p < 0.0001, log-rank test; Figure 3C). The mean TTR for HCC patients expressing high levels of FAP was 21.6 months, compared with those expressing low levels of FAP was 58.6 months (p < 0.0001, log-rank test; Figure 3D).
Figure 3
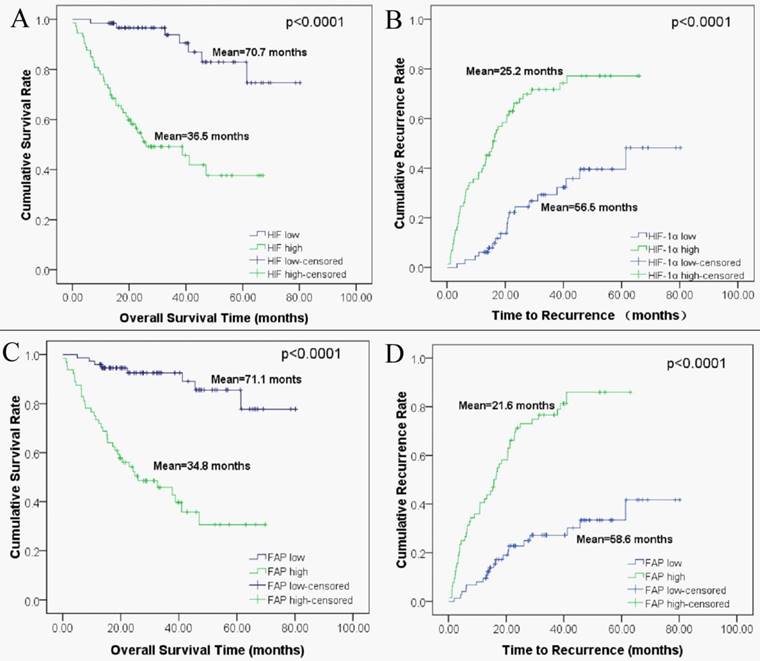
Kaplan-Meier survival analyses of HIF-1α and FAP in HCC patients. (A) Overall survival for postoperative HCC patients: low expression of HIF-1α (n=74, mean=70.7 months), high expression of HIF-1α (n=64, mean=35.5 months). (B) Time to recurrence for postoperative HCC patients: low expression of HIF-1α (n=74, mean=56.5 months), high expression of HIF-1α (n=64, mean=25.2 months). (C) Overall survival for HCC patients: low expression of FAP (n=65, mean=71.1 months), high expression of FAP (n=73, mean=34.8 months). (D) Time to recurrence for postoperative HCC patients: low expression of FAP (n=65, mean=58.6 months), high expression of FAP (n=73, mean=21.6 months).
Clinical outcome analysis based on the combined HIF-1α and FAP expression
We sub-classified the 138 HCC patients into 3 groups according to their expression of HIF-1α and FAP. The 3 groups of patients were defined as follows, 1) patients with low HIF-1α expression and low FAP expression; 2) patients with low HIF-1α expression and high FAP expression, or high HIF-1α and low FAP expression; 3) patients with high expressions for both HIF-1α and FAP. Then we performed Kaplan-Meier survival analysis to investigate the correlation of such combination sub-groups and patients' clinical outcomes.
As depicted in figure 4, the patient sub-group with the low HIF-1α/low FAP expression (group 1) experienced the longest OS (mean 74.3 months) and TTR (mean 64.2 months). On the contrary, the high HIF-1α/high FAP expression sub-group (group 3) had the shortest OS (mean 28.9 months) and TTR (mean 18.2 months). Meanwhile, patients in the sub-group in-between (low HIF-1αexpression and high FAP expression, or high HIF-1α and low FAP expression) had moderate OS (mean 53.9 months) and TTR (mean 35.4 months).
Association of HIF-1α and FAP expression with patient survival
The survival analyses were then performed in the SPSS16 software. Univariate analysis revealed that liver cirrhosis, TNM stage, tumor size, tumor number, vascular invasion, serum AFP, HIF-1α, FAP, and combined HIF-1α/ FAP was associated significantly with OS and TTR, respectively (p value for OS were <0.0001, <0.0001, 0.0184, <0.0001, <0.0001, 0.0002, <0.0001, <0.0001, and <0.0001; p value for TTR were <0.0001, <0.0001, 0.01047, 0.00315, <0.0001, 0.01262, <0.0001, <0.0001 and <0.0001). Lymph node metastasis was associated significantly with post-surgical TTR (p=0.04963) (Table 2). By incorporating factors that indicated significance in the univariate analysis, multivariate analysis was performed through the Cox multivariate proportional hazard regression model for analysis. In brief, liver cirrhosis, tumor number, HIF-1α/FAP combination were the independent prognostic factors for OS. In addition, liver cirrhosis, tumor size, vascular invasion, and HIF-1α/FAP combination were the independent prognostic predictors of TTR (Table 2).
Figure 4
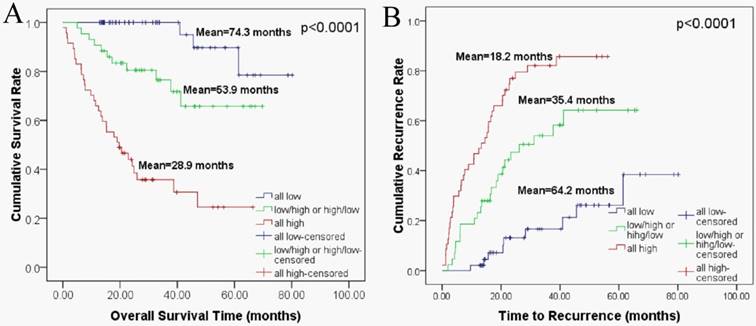
Combined HIF-1α and FAP expression in Kaplan-Meier survival analyses for HCC patients. (A) Overall survival for postoperative HCC patients: all low expression (n=48, mean=74.3 months), HIF-1α low/ FAP high or HIF-1α high/ FAP low expression (n=43, mean=53.9 months), all high expression (n=47, mean=28.9 months) (B) Time to recurrence for postoperative HCC patients: all low expression (n=48, mean=64.2 months), HIF-1α low/ FAP high or HIF-1α high/ FAP low expression (n=43, mean=35.4 months), all high expression (n=47, mean=18.2 months).
Table 2
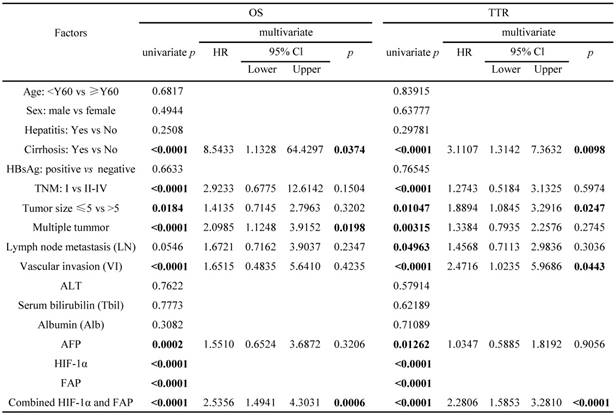
Univariate and multivariate analyses of factors associated with OS and TTR in 138 cases of HCC patients
Note: stage II HCC cases (59)
FAP was up-regulated in HCC cells exposed to hypoxia and correlated with epithelial-mesenchymal transition (EMT)
Three HCC cell lines (HepG2, Huh7 and MHCC97H) were treated with CoCl2-induced hypoxia, as compared with the normal oxygen group. Western blot was adopted to confirm the change of different protein expression levels. The up-regulation of HIF-1α indicated cellular hypoxia after the treatment. FAP increased in parallel with that of HIF-1α and three EMT markers (E-cadherin, Snail and TWIST) (Figure 5).
Figure 5
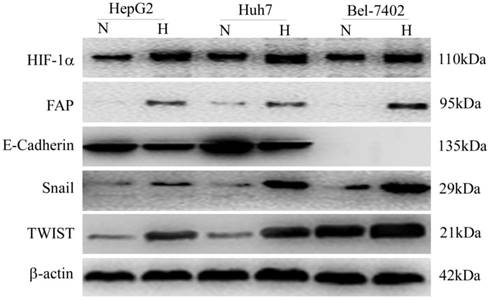
In-vitro confirmation of FAP up-regulation in hypoxic HCC cells and association with EMT. Western blot confirmed that the cellular hypoxia in three HCC cell lines (HepG2, Huh7 and MHCC97H) after treatment, indicated by up-regulation of HIF-1α, was associated with increased FAP expression and EMT. (N, normal oxygen; H, hypoxia.)
Discussion
Although FAP is believed to be a marker for CAFs, recent studies reveal that the up-regulation of FAP in cancer cells can also indicate poor prognosis [7, 8, 23]. Concerning the fact that it has been commonly considered as a mesenchymal marker (of CAFs), FAP expression in cancer cells may highly suggest the process of epithelial-mesenchymal transition (EMT), which is a general mechanism underlying the aggressiveness of cancer cells [15, 24, 25]. Meanwhile, hypoxia is a well-known factor that induces the expression of FAP in stromal fibroblasts. In HCC, the over-expression of FAP has also been reported in CAFs instead of HCC cells [5]. In consistence with previous studies, we report for the first time that FAP can be induced in cancer cells under hypoxia and correlate with poor clinical outcomes in HCC patients.
Our results demonstrated that over-expression of FAP can also be found in both the stromal cells and cancer cells. FAP expression correlates with HIF-1α, which is an indicative marker of tissue hypoxia. The over-expression of FAP in cancer cells under hypoxia is an independent risk factor for both the recurrence of HCC tumor and poor overall survival in post-surgical patients. The result of our study also support that FAP, HIF-1α and the combination of both are independent prognostic factors for post-operative HCC patients, concerning OS and TTR.
Similar to the previous study [5], up-regulation of FAP in our study is correlated with poor prognosis in HCC patients. But the focus of the previous study in HCC lies on the mesenchymal fibroblasts, and the staining of FAP in HCC cancer cells is not explored. In a more recent study [16], the staining of FAP is found positive in the cancer cells from a different pathological subtype of HCC. Based on these findings from previous studies, our study has further confirmed that FAP can be up-regulated by the HCC cancer cells, especially under hypoxic condition.
Hypoxic cancer cells showed increased malignant behaviors, which can be attributed to the process of EMT [26, 27]. Many mesenchymal markers like TWIST and Snail can indicate the occurrence of EMT in HCC cancer cells. The up-regulation of these markers showed a more aggressive cancer phenotype as mesenchymal-like cells show the ability to degrade the matrix and migrate more swiftly. We further confirmed the relationship of FAP and hypoxia in cancer cells by in-vitro experiments. The up-regulation of HIF-1α in hypoxic cancer cells is accompanied by enhanced expression of FAP in all three cancer cell lines. The EMT makers also revealed parallel changes. As FAP is frequently considered a marker for the mesenchymal cells (CAFs), our data may indicate FAP as a mesenchymal marker for HCC EMT. Therefore, FAP may be an important factor during the process of EMT when cancer cells withstand hypoxia, which can explain why FAP up-regulation in cancer cells within tumor tissues correlated with bad clinical outcomes. We have offered clues that FAP could be one of the key molecules that are up-regulated in hypoxic microenvironment. However, the underlying FAP-related mechanisms remain to be investigated, which may help us understand better how the cancer cells become more malignant under hypoxia and development better prognostic and therapeutic strategies.
In this study we report the up-regulation of FAP in HCC cancer cells can be indicative of poor prognosis in patients. FAP in HCC cancer tissues correlates with both HIF-1α and factors defining poor outcomes like vascular invasion, tumor number, tumor size and advanced TNM stages. In vitro, the clinical observations were further validated by the up-regulation of FAP in three cancer cells under hypoxia, which correlated with the change of EMT markers.
Supplementary Material
Supplementary figures.
Acknowledgements
This work was supported by National Natural Science Foundation of China (Grant No.81502503), Natural Science Foundation of Guangdong Province (Grant No.2016A030310191) and the Fundamental Research Funds for the Central Universities (Sun Yat-sen University, Grant 17ykpy60).
We sincerely thank Dr. Yonghua Chen and Professor Yunfei Yuan from Cancer Center, Sun Yat-sen University, Guangzhou, Guangdong, People's Republic of China, for their kindness provide of the HCC cell lines and LO2 cell line.
Competing Interests
The authors have declared that no competing interest exists.
References
1. Siegel RL, Miller KD, Jemal A. Cancer Statistics, 2017. CA Cancer J Clin. 2017;67:7-30
2. Kianmanesh R, Regimbeau JM, Belghiti J. Selective approach to major hepatic resection for hepatocellular carcinoma in chronic liver disease. Surg Oncol Clin N Am. 2003;12:51-63
3. Bruix J, Sherman M. Management of hepatocellular carcinoma. Hepatology. 2005;42:1208-1236
4. Lopez JI, Errarte P, Erramuzpe A. et al. Fibroblast activation protein predicts prognosis in clear cell renal cell carcinoma. Hum Pathol. 2016;54:100-105
5. Kim GJ, Rhee H, Yoo JE. et al. Increased expression of CCN2, epithelial membrane antigen, and fibroblast activation protein in hepatocellular carcinoma with fibrous stroma showing aggressive behavior. PLoS One. 2014;9:e105094
6. Iwasa S, Okada K, Chen WT. et al. 'Increased expression of seprase, a membrane-type serine protease, is associated with lymph node metastasis in human colorectal cancer'. Cancer Lett. 2005;227:229-236
7. Jin X, Iwasa S, Okada K. et al. Expression patterns of seprase, a membrane serine protease, in cervical carcinoma and cervical intraepithelial neoplasm. Anticancer Res. 2003;23:3195-3198
8. Augoff K, Hryniewicz-Jankowska A, Tabola R. et al. Upregulated expression and activation of membraneassociated proteases in esophageal squamous cell carcinoma. Oncol Rep. 2014;31:2820-2826
9. Kelly T, Kechelava S, Rozypal TL. et al. Seprase, a membrane-bound protease, is overexpressed by invasive ductal carcinoma cells of human breast cancers. Mod Pathol. 1998;11:855-863
10. Ammirante M, Shalapour S, Kang Y. et al. Tissue injury and hypoxia promote malignant progression of prostate cancer by inducing CXCL13 expression in tumor myofibroblasts. Proc Natl Acad Sci U S A. 2014;111:14776-14781
11. Kraman M, Bambrough PJ, Arnold JN. et al. Suppression of antitumor immunity by stromal cells expressing fibroblast activation protein-alpha. Science. 2010;330:827-830
12. Jiang L, Yan Q, Fang S. et al. Calcium-binding protein 39 promotes hepatocellular carcinoma growth and metastasis by activating extracellular signal-regulated kinase signaling pathway. Hepatology. 2017;66:1529-1545
13. Ju MJ, Qiu SJ, Fan J. et al. Peritumoral activated hepatic stellate cells predict poor clinical outcome in hepatocellular carcinoma after curative resection. Am J Clin Pathol. 2009;131:498-510
14. Chen M, Ye Y, Zou B. et al. C14orf166 is a high-risk biomarker for bladder cancer and promotes bladder cancer cell proliferation. J Transl Med. 2016;14:55
15. Jia J, Martin TA, Ye L, Jiang WG. FAP-alpha (Fibroblast activation protein-alpha) is involved in the control of human breast cancer cell line growth and motility via the FAK pathway. BMC Cell Biol. 2014;15:16
16. Kim YJ, Rhee H, Yoo JE. et al. Tumour epithelial and stromal characteristics of hepatocellular carcinomas with abundant fibrous stroma: fibrolamellar versus scirrhous hepatocellular carcinoma. Histopathology. 2017;71:217-226
17. Jin GZ, Yu WL, Dong H. et al. SUOX is a promising diagnostic and prognostic biomarker for hepatocellular carcinoma. J Hepatol. 2013;59:510-517
18. Zhu XD, Zhang JB, Zhuang PY. et al. High expression of macrophage colony-stimulating factor in peritumoral liver tissue is associated with poor survival after curative resection of hepatocellular carcinoma. J Clin Oncol. 2008;26:2707-2716
19. Camp RL, Dolled-Filhart M, Rimm DL. X-tile: a new bio-informatics tool for biomarker assessment and outcome-based cut-point optimization. Clin Cancer Res. 2004;10:7252-7259
20. Liu M, Chen L, Ma NF. et al. CHD1L promotes lineage reversion of hepatocellular carcinoma through opening chromatin for key developmental transcription factors. Hepatology. 2016;63:1544-1559
21. Huang PZ, Lu CL, Li BK. et al. [OCT4 expression in hepatocellular carcinoma and its clinical significance]. Chin J Cancer. 2010;29:111-116
22. Jiang L, Yan Q, Fang S. et al. Calcium-binding protein 39 promotes hepatocellular carcinoma growth and metastasis by activating extracellular signal-regulated kinase signaling pathway. Hepatology. 2017
23. Wang H, Wu Q, Liu Z. et al. Downregulation of FAP suppresses cell proliferation and metastasis through PTEN/PI3K/AKT and Ras-ERK signaling in oral squamous cell carcinoma. Cell Death Dis. 2014;5:e1155
24. Wang RF, Zhang LH, Shan LH. et al. Effects of the fibroblast activation protein on the invasion and migration of gastric cancer. Exp Mol Pathol. 2013;95:350-356
25. Koczorowska MM, Tholen S, Bucher F. et al. Fibroblast activation protein-alpha, a stromal cell surface protease, shapes key features of cancer associated fibroblasts through proteome and degradome alterations. Mol Oncol. 2016;10:40-58
26. Zhang L, Huang G, Li X. et al. Hypoxia induces epithelial-mesenchymal transition via activation of SNAI1 by hypoxia-inducible factor -1alpha in hepatocellular carcinoma. BMC Cancer. 2013;13:108
27. Ibrahim AA, Schmithals C, Kowarz E. et al. Hypoxia Causes Downregulation of Dicer in Hepatocellular Carcinoma, Which Is Required for Upregulation of Hypoxia-Inducible Factor 1alpha and Epithelial-Mesenchymal Transition. Clin Cancer Res. 2017;23:3896-3905
Author contact
![]() Corresponding authors: Jian Li, Department of Hepatobiliary Surgery, The Fifth Affiliated Hospital of Sun Yat-sen University, Zhuhai, China, 52 Mei Hua East Road, Zhuhai, Guangdong, People's Republic of China, 519000. Tel: +86-756-252-8781 (Office); Fax: +86-756-252-8166; Email: lijian5sysu.edu.cn and Linjuan Zeng, Department of Oncology, The Fifth Affiliated Hospital of Sun Yat-sen University, Zhuhai, China, 52 Mei Hua East Road, Zhuhai, Guangdong, People's Republic of China, 519000. Tel: +86-756-252-8027 (Office); Fax: +86-756-252-8166; E-mail: zenglinjsysu.edu.cn
Corresponding authors: Jian Li, Department of Hepatobiliary Surgery, The Fifth Affiliated Hospital of Sun Yat-sen University, Zhuhai, China, 52 Mei Hua East Road, Zhuhai, Guangdong, People's Republic of China, 519000. Tel: +86-756-252-8781 (Office); Fax: +86-756-252-8166; Email: lijian5sysu.edu.cn and Linjuan Zeng, Department of Oncology, The Fifth Affiliated Hospital of Sun Yat-sen University, Zhuhai, China, 52 Mei Hua East Road, Zhuhai, Guangdong, People's Republic of China, 519000. Tel: +86-756-252-8027 (Office); Fax: +86-756-252-8166; E-mail: zenglinjsysu.edu.cn
Citation styles
APA
Zou, B., Liu, X., Zhang, B., Gong, Y., Cai, C., Li, P., Chen, J., Xing, S., Chen, J., Peng, S., Pokhrel, B., Ding, L., Zeng, L., Li, J. (2018). The Expression of FAP in Hepatocellular Carcinoma Cells is Induced by Hypoxia and Correlates with Poor Clinical Outcomes. Journal of Cancer, 9(18), 3278-3286. https://doi.org/10.7150/jca.25775.
ACS
Zou, B.; Liu, X.; Zhang, B.; Gong, Y.; Cai, C.; Li, P.; Chen, J.; Xing, S.; Chen, J.; Peng, S.; Pokhrel, B.; Ding, L.; Zeng, L.; Li, J. The Expression of FAP in Hepatocellular Carcinoma Cells is Induced by Hypoxia and Correlates with Poor Clinical Outcomes. J. Cancer 2018, 9 (18), 3278-3286. DOI: 10.7150/jca.25775.
NLM
Zou B, Liu X, Zhang B, Gong Y, Cai C, Li P, Chen J, Xing S, Chen J, Peng S, Pokhrel B, Ding L, Zeng L, Li J. The Expression of FAP in Hepatocellular Carcinoma Cells is Induced by Hypoxia and Correlates with Poor Clinical Outcomes. J Cancer 2018; 9(18):3278-3286. doi:10.7150/jca.25775. https://www.jcancer.org/v09p3278.htm
CSE
Zou B, Liu X, Zhang B, Gong Y, Cai C, Li P, Chen J, Xing S, Chen J, Peng S, Pokhrel B, Ding L, Zeng L, Li J. 2018. The Expression of FAP in Hepatocellular Carcinoma Cells is Induced by Hypoxia and Correlates with Poor Clinical Outcomes. J Cancer. 9(18):3278-3286.
This is an open access article distributed under the terms of the Creative Commons Attribution (CC BY-NC) license (https://creativecommons.org/licenses/by-nc/4.0/). See http://ivyspring.com/terms for full terms and conditions.