Impact Factor ISSN: 1837-9664

 Global reach, higher impact
J Cancer 2018; 9(12):2191-2202. doi:10.7150/jca.22846 This issue Cite
Research Paper
Technical Feasibility of Tissue Microarray (TMA) Analysis of Tumor-Associated Immune Response in Prostate Cancer
Timothy J. Wallace1, Junqi Qian2, Itzhak Avital3, Curt Bay4, Yan-Gao Man5, Laurie L. Wellman6, Chris Moskaluk7, Dean Troyer6, Dharam Ramnani2, Alexander Stojadinovic8 ![]()
1. Bon Secours Cancer Institute, Richmond, Virginia, U.S.A.
2. Virginia Urology, Richmond, Virginia, U.S.A.
3. Soroka University Center for Advanced Cancer Care, Ber Sheva, Israel
4. A.T. Still University, Mesa, Arizona, U.S.A.
5. National Medical Centre of Colorectal Disease, Third Affiliated Hospital of Nanjing University of Traditional Chinese Medicine (TCM), Nanjing, China
6. Eastern Virginia Medical School, Norfolk, Virginia, U.S.A.
7. University of Virginia, Charlottesville, Virginia, U.S.A.
8. Uniformed Services University of the Health Sciences, Bethesda, Maryland
Received 2017-9-16; Accepted 2018-4-28; Published 2018-6-4
Abstract
Introduction: The androgen receptor (AR) regulates immune-related epithelial-to-mesenchymal transition (EMT), and prostate cancer (PCa) metastasis. Primary tumor-infiltrating lymphocytes (TILs) [CD3+, CD4+, and CD8+ TILs] are potential prognostic indicators in PCa, and variations may contribute to racial disparities in tumor biology and PCa outcomes.
Aim: To assess the technical feasibility of tumor microarray (TMA)-based methods to perform multi-marker TIL profiling in primary resected PCa.
Methods: Paraffin-embedded tissue cores of histopathologically-confirmed primary PCa (n = 40; 1 TMA tissue specimen loss) were arrayed in triplicate on TMAs. Expression profiles of AR, CD3+, CD4+, and CD8+ TILs in normal prostate, and the center and periphery of both the tumor-dominant nodule and highest Gleason grade were detected by IHC and associated with clinical and pathological data using standard statistical methodology. An independent pathologist, blinded to the clinical data, scored all samples (percent and intensity of positive cells).
Results: TMAs were constructed from 21 (53.8%) Black and 18 (46.2%) White males with completely-resected, primarily pT2 stage PCa [pT2a (n = 3; 7.7%); pT2b (n = 2; 5.1%); pT2c (n = 27; 69.2%); pT3a (n = 5; 12.8%); mean pre-op PSA = 8.17 ng/ml]. The CD3, CD4, CD8, and CD8/CD3 cellular protein expression differed from normal in the periphery of the dominant nodule, the center of the highest Gleason grade, and the periphery of the highest Gleason grade (P < 0.05). Correlations between TIL expression in the center and periphery of the dominant nodule, with corresponding center and periphery of the highest Gleason grade, respectively, were robust, and the magnitude of these correlations differed markedly by race (P < 0.05).
Conclusions: Multi-marker (AR, CD3, CD4, CD8) profiling with IHC analysis of TMAs consisting of primary, non-metastatic resected prostate cancer is technically feasible in this pilot study. Future studies will evaluate primary tumor immunoscore using semi-quantitative, IHC-based methodology to assess differences in the spectrum, quantity, and/or localization of TILs, and to gain insights into racial disparities in PCa tumor biology and clinical outcomes.
Keywords: Prostate cancer, Immunoscore, Tissue microarray, Tumor-infiltrating lymphocytes, Androgen receptor
Introduction
Prostate cancer (PCa) is the second-most frequently diagnosed and fifth-most lethal malignancy amongst men [1]. It is particularly troubling that PCa has the highest disparity in incidence and mortality between African American (Black) and Caucasian American (White) men [2, 3], more so than any other malignancy [4-6]. Black men are nearly three to four times as likely to die of PCa compared to White men (50.9 versus 17.8 cases per 100,000 men, respectively) [5, 7-10].
There are also racially-based differences in PCa molecular biology. Black men tend to present with more advanced stage, more aggressive disease, and with adverse pathological indicators of disease than men in other ethnic groups [4, 5, 11-13]. In addition to having variations in genes linked to tumorigenesis (e.g., androgen receptor [14-17], growth factors [18-20], p53 [21], and BCL-2 [22]), Black men also have genetic variations in their genome-wide methylation [23, 24] and tumor-associated immune response. For instance, work from our group and others using genome-wide analyses of PCa tumor specimens from Black men revealed enrichment in the expression of gene sets related to lymphocyte and mononuclear cell proliferation, T-cell activation and proliferation, lymphocyte and leukocyte activation, and integrin-mediated signaling [25-30]. Racial disparities also give rise to differences in how men with PCa are treated, wherein, even after adjusting for socioeconomic and clinical factors, facilities tended to favor more definitive therapy (i.e., surgery and radiation) for White men than Black men [31, 32].
The focus of this study is on immune-related parameters and PCa outcome. While genetic data suggest race affects immune-related gene expression, these differences have yet to be validated using tumor specimens and knowledge of long-term patient outcomes. The role of increased levels of tumor-infiltrating lymphocytes (TILs) in cancer appears to be context- and site-dependent [12, 33], and seems to vary with the specific T-cell population in question. In the prostate, CD8+/Foxp3+ and CD4+/CD25+ regulatory T (T-reg) cells appear to be the predominant TIL populations [34-36]. Both CD8+ and CD4+ T-reg cells suppress the immune response in the prostate, in a TLR8 ligand-dependent manner [37]. We postulate that factors in the prostate tumor microenvironment transform these normally beneficial cells into promoters of cancer invasiveness [38].
Results describing the clinical significance of CD4+ and CD8+ populations in PCa are limited, but supportive. In a study of 188 patients treated for localized PCa, the strong expression of TILs was correlated with reduced PSA recurrence-free survival [39]. Similarly, a small study (n = 82) found correlations between CD8+ infiltrates and biochemical relapse in PCa patients following radical prostatectomy [40]. A small case-controlled study revealed that, when stratified by CD4+ T-reg infiltration, men in the highest quartile of expression experienced a nearly two-fold increase in lethal PCa, compared to the lowest quartile of expression [36]. Recently, a study of 22 patients with locally advanced prostate cancer patients treated with salvage radiotherapy who experienced biochemical relapse after radical prostatectomy found significant correlations between immunological tumor microenvironment and patient outcome [41]. Higher CD8 and CCR7 TIL scores and lower CD45 and FoxP3 TIL scores were associated with prolonged progression-free and overall survival [41].
In the prostate gland, immune mediators in tumor-adjacent stroma alter the regulation of genes responsible for epithelial-mesenchymal transition (EMT), which is known to perpetuate tumor invasiveness and metastasis, and is regulated by androgen signaling ([42, 43], and reviewed in [44]). This is of particular interest because PCa in Black men tends to have higher AR activity, due to selective alterations in the CAG repeats within the AR gene [17, 45-47]. Black men with PCa are also 27% more likely to stain positive for AR and have 81% greater nuclear expression of AR [14, 47]. The “EMT signature” also appears to correlate with resistance to radiation therapy and anti-androgens in a subset of PCa patients [48]. With this increased androgen responsiveness, one could posit that the tumorigenic epithelial cells within Black men would more likely undergo EMT and, thereby distant disease spread as a direct result of increased concentrations of TILs in the tumor microenvironment. Studies are needed to test the validity and clinical significance of this hypothesis.
Given the strong correlation between the type, density, and spatial distribution of infiltrating lymphocytes and survival, there are therapeutic implications and support for immune therapies to enhance anti-tumor immune responses [49, 50]. Immunotherapy, or the use of agents to recruit the host's immune system to target and destroy malignant cells, is particularly attractive for PCa. This is because PCa has a relatively indolent rate of progression, which gives the immune system time to mount an effective, durable response, and the expression of tumor-specific antigens (i.e., prostate-specific antigen, prostate acid phosphatase, and prostate-specific membrane antigen) that could be targeted by immune modulators [49, 51, 52]. This therapeutic approach, termed “antigen-specific vaccination,” is promising, as evidenced by the success with Sipuleucel-T. Sipuleucel-T is an autologous vaccine derived from harvested mononuclear cells from the patient, incubated with recombinant prostatic acid phosphatase (PAP) antigen, and reinfused into the patient, leading to a PAP-specific CD4+ and CD8+ T-cell response [51, 53, 54]. This was one of the first vaccines approved by the Food and Drug Association for use as a cancer treatment in men with castrate-refractory metastatic PCa [55].
In the double-blind, placebo-controlled, multi-center Phase 3 trial, Sipuleucel-T Immunotherapy for Castration-Resistant Prostate Cancer, there were notable improvements in overall survival (increase of 4.1 months) and a decreased risk of death (22% reduction) in the Sipuleucel-T cohort, but no effect on time to disease progression [53]. Responsiveness to therapy varied significantly based on age, variations in antibody titers, and clinicopathological features [53, 54, 56]. Various other types of vaccination approaches (e.g., vector-based vaccines, personalized peptide vaccination) and immunomodular therapies have been explored, although they remain in the early-to-mid stages of clinical investigation, and with mixed clinical results [49, 57]. We and others in the field believe that development and validation of reliable methods to screen and select PCa patients for immunotherapy-based regimens, based on density, location, and quantity of clinically-relevant immune infiltrates in the prostate microenvironment, will support the use and effectiveness of this promising type of anti-cancer therapy [49, 51, 52].
Tissue microarray (TMA)-based immunoscoring of PCa specimens has the potential to: (1) shed new light on the immune-related causes of PCa disparities, particularly in the context of androgen responsiveness; (2) enable reliable screening of patients in PCa immunotherapy trials; and, (3) provide a way to serially track changes in the tumor microenvironment in response to immunotherapy. However, the technical methods enabling such an assay have yet to be established. The current study assesses the technical feasibility of TMA expression profiling of TILs in primary resected PCa, and further demonstrates its sensitivity amongst tumor specimens from a racially diverse cohort.
Methods
Patients
We utilized a prostate tissue biorepository collected between 2003 and 2013 by Virginia Urology and Urology of Virginia. The tissue banks contain over 6,500 archival formalin-fixed paraffin-embedded (FFPE) post-prostatectomy blocks, 25% (1,630) of which are from Black men. De-identified information limited only to relevant clinical descriptors (original pathological assessment, PSA values, age, race, etc.) was received along with relevant long-term follow-up data, including events related to PSA recurrence, disease progression, and disease-related mortality.
Tissue Microarray Construction
Pathologists with expertise in genitourinary (GU) pathology confirmed the diagnosis of PCa from patient tissue stored in the prostate tissue biorepository. Confirmation of PCa diagnosis was through hematoxylin and eosin (H&E)-stained tissue slide review. H&E sections were labeled for FFPE tissue block core specimen targeting to provide quality assurance (QA) and quality control (QC) when constructing the TMA.
After archived slide review, diagnostic confirmation, and FFPE tissue block targeting and corresponding slide labeling, TMAs were constructed from targeted areas on the paraffin block with a tissue-array device. Triplicate cores (0.6-mm diameter; 0.28-mm2 area) from the primary tumor from each patient in the study were placed in a recipient TMA paraffin block (Figure 1). The multi-tissue block was pre-heated for two hours at 55˚C to adhere the tissue cores to the recipient block. The block was then serially sectioned to obtain 4-µm slices of the TMA, which includes per patient cores of: (i) the largest, or dominant, nodule; and, (ii) the area with the highest Gleason-graded PCa. At each location, and in triplicate, we stained and quantified AR+ cells, and TILs (CD3+, CD4+, and CD8+ T cells) both at the margin (periphery) of the region and at the region's center (Figure 2). For each of the two locations (dominant nodule and highest Gleason grade) per patient, we generated three sets of CD3+/CD4+/CD8+ center and margin (periphery) data, as well as AR+/AR intensity/AR H-score center and margin (periphery) data.
Immunohistochemistry and Quantitation Methodology
Pathologist-selected sections were stained using standard H&E protocol for pathological assessment, as specified above, and then were immunostained for CD8 (C8/144; Dako, Carpinteria, CA), CD3 (2GV6; Ventana, Tucson, AZ), and CD4 (SP35; Thermo Scientific, CA) reactivity using automated slide stainers (Autostainer; DAKO, Denmark), precisely according to Worldwide Immunoscoring Task Force (WITF) standards for CD8 and CD3 [58]. For CD4, the staining protocol was according to manufacturer recommendations and aligned with the WITF protocol. Each marker was stained and quantitated in triplicate.
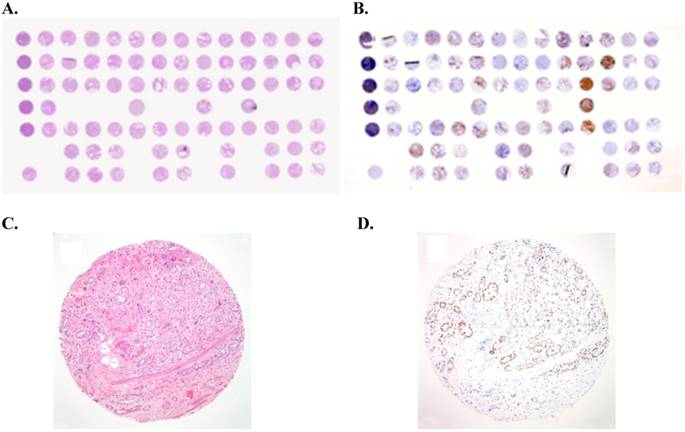
Example of tissue micro-array (TMA) of prostate cancer: (A) Overview of a hematoxylin-eosin (H&E)-stained TMA section. Each tissue spot measures 0.6 mm in diameter. (B) Overview of immunostained TMA section for androgen receptor (AR). (C) H&E staining performed on formalin-fixed paraffin-embedded (FFPE) tissue core showing prostate cancer with a Gleason score of 3+4 (x100). (D) Immunostain for androgen receptor (AR) showing nuclear staining of prostate cancer cells (x100).
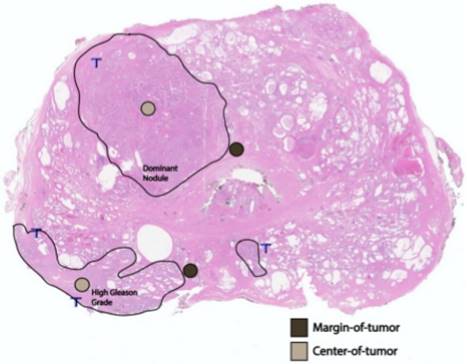
A whole-mount, H&E-stained prostatectomy sample depicting an example of margin of tumor (brown) and tumor center (tan) foci in relation to the dominant nodule and area of highest Gleason grading.
After the FFPE tissue in the TMA was cut into 4-μm sections and placed on the positively-charged poly-lysine-coated slides, the sections were dried at 70 ˚C, deparaffinized using a series of xylenes, and rehydrated in graded alcohols and distilled water. Following deparaffinization, the slides were treated with methanol peroxide to block endogenous peroxidases. Antibody validation studies were conducted to specifically optimize and determine each condition for the IHC protocol, including the appropriate primary antibody dilution, blocking reagent, incubation times, and antigen recovery. Immunostaining was performed using an Ab-specific auto-stainer. Following antigen retrieval, slides were blocked and labeled with primary antibody. Primary antibody binding sites were visualized using a non-avidin biotin polymer peroxidase detection system. Diaminobenzidine (DAB) / 1% hydrogen peroxide was used as the chromogen. The DAB reaction was terminated once optimal color visualization was determined. Following the DAB reaction, the slides were counterstained with hematoxylin, treated with xylene and graded alcohols, and mounted. Controls in each antibody run consisted of isotype-specific antibodies that matched the primary antibody of interest.
Interpretation of stained slides was performed by microscopic examination. In general, a morphologic review of the tissue on the slide was performed to determine whether an adequate amount of tissue was present for evaluation, and whether the designated tissue of interest was appropriately represented. One sample failed to meet the above standards and was rejected from the analysis.
The scoring system included an analysis of staining intensity. The staining intensity of the test article was judged relative to the intensity of a control slide containing an adjacent section stained with an irrelevant, negative-control antibody that was species- and isotype-matched to the test article. Staining of the section labeled with the negative-reagent control was considered “background.” A “0” indicated no staining relative to background; “1+” indicated weak staining; “2+” indicated moderate staining; and “3+” indicated strong staining. A total number of manually-counted staining cells was determined by the scoring genitourinary pathologist. Subcellular localization of the antibodies (nuclear, cytoplasmic, or membranous staining) was also assessed.
A semi-quantitative scheme was used for AR scoring expression. One component of this scheme was a value proportional to the amount of epitope present on individual cells as assessed by the intensity of product present (AR+ %). In addition, AR intensity was determined using a semi-quantitative scale: “0” = no staining; “1+” = faint staining; “2+” = moderate staining; and “3+” = prominent staining. Considering the nature of heterogeneous staining of PCa, we also used histological score (HSCORE), which is a measure of both the intensity and distribution of staining, to measure the immunohistochemical staining of AR. The HSCORE was calculated using the equation: HSCORE ∑Pi(i + 1), where Pi is the percentage of stained epithelial cells for each intensity and i is the intensity of staining.
Statistical Analysis
Summary statistics were obtained using established methods. Means ± standard deviation, or counts and perentages were calculated, as appropriate. Associations between ordered categorical factors and cellular protein expression were analyzed using Spearman's correlation coefficient. Analyses of continuous data were conducted using generalized estimating equations and an exchangable working correlation matrix. A gamma distribution with a log link was used to model the data.
We also explored the strength of the relationship between cellular expression of CD3, CD4, and CD8 in the center and margin (periphery) of the dominant nodule, along with expression in the center and margin (periphery) of the highest Gleason-graded region. We determined the degree to which this relationship differed by race of the donor using the Fisher r-to-z transformation for Spearman correlation coefficients [59].
Statistical analysis was performed using JMP v8.0 statistical software (JMP® and SAS, Cary, NC). A P-value < 0.05 (two-tailed) was considered statistically significant. Results are presented without adjustment for multiple comparisons, due to the exploratory nature of this investigation.
Results
The study population is summarized in Table 1 according to patient, tumor, and disease stage characteristics. TMAs were constructed from 21 (53.8%) African American, and 18 (46.2%) Caucasian males, with mean pre-op serum PSA levels of 8.17 ± 11.20 ng/mL, and completely resected prostate cancer of mostly pathological T2 stage [pT2a (n = 3; 7.7%); pT2b (n = 2; 5.1%); pT2c (n = 27; 69.2%); pT3a (n = 5; 12.8%)]. Most of the resected tumors demonstrated peri-neural invasion (n = 33; 84.6%), and most of the specimens had surgical Gleason grade of either 3+3 (n = 7; 17.9%), 3+4 (n = 16; 41.0%), or 4+3 (n = 13; 33.3%). One sample failed to meet standards for TMA sampling, processing, and analysis, and was therefore excluded from the study.
Distribution of Patient, Tumor, and Disease-Stage Characteristics
| Category | Characteristic | n (%) |
|---|---|---|
| Race | Black | 21 (53.8) |
| White | 18 (46.2) | |
| Pre-treatment PSA | <10 | 35 (87.2) |
| (ng/mL) | 10-20 | 2 (5.1) |
| >20 | 3 (7.7) | |
| Clinical Stage | T1c | 27 (69.2) |
| T2a | 5 (12.8) | |
| T2b | 2 (5.1) | |
| T2c | 3 (7.7) | |
| Unknown | 2 (5.1) | |
| Biopsy Gleason Score | 3+3 | 15 (38.5) |
| 3+4 | 12 (30.8) | |
| 4+3 | 5 (12.8) | |
| 4+4 | 5 (12.8) | |
| 4+5, 5+4 | 2 (5.1) | |
| Pathological Stage | T2a | 3 (7.7) |
| T2b | 2 (5.1) | |
| T2c | 27 (69.2) | |
| T3a | 5 (12.8) | |
| T3b | 1 (2.5) | |
| T4 | 1 (2.5) | |
| Perineural Invasion | Absent | 6 (15.4) |
| Present | 33 (84.6) |
Immunohistochemical Scoring in Normal and Primary Prostate Cancer Lesions
| IHC Markers Mean positivity ± Standard Deviation | ||||||||
|---|---|---|---|---|---|---|---|---|
| Region | Location | CD3+ | CD4+ | CD8+ | CD8+/CD3+ | AR+ % | AR Intensity | AR H-Score |
| Normal | - | 96.92±40.44 | 25.49±21.27 | 64.54±27.60 | 0.69±0.20 | 61.49±25.74 | 1.65±0.68 | 1.75±0.95 |
| Dominant Nodule | Center | 118.03±79.77 | 50.50±27.51* | 65.71±56.81 | 0.54±0.19* | 66.26±35.44 | 1.47±0.80 | 1.80±1.12 |
| Periphery | 132.77±92.46* | 52.00±52.44* | 72.92±47.97 | 0.59±0.18* | 72.82±26.45* | 1.74±0.75+ | 2.11±0.97* | |
| Highest Gleason Grade | Center | 137.42±97.63* | 64.13±86.85* | 71.21±57.26 | 0.53±0.18* | 65.21±34.22 | 1.61±0.79+ | 1.85±1.12 |
| Periphery | 133.23±97.61* | 56.66±56.04* | 71.97±48.72 | 0.57±0.18* | 74.62±24.69* | 1.90±0.75+#0 | 2.27±0.96*+0 | |
| P-value | - | 0.031 | <0.001 | 0.304 | 0.001 | 0.002 | 0.006 | 0.015 |
Statistically significant difference (at least P < 0.05) between the indicated region and: *Normal; +Center of the dominant nodule; #Periphery of the dominant nodule; or 0Center of the highest Gleason-graded region.
The CD3, CD4, sand CD8/CD3 cellular protein expression differed from normal in the dominant nodule periphery, highest Gleason grade center, and highest Gleason grade periphery regions (all P < 0.05; Table 2). The CD4 and CD8/CD3 cellular protein expression also differed from benign in the dominant nodule center (P < 0.05).
With respect to AR staining, the percent of AR+ cells differed from normal in the dominant nodule periphery, as well as the highest Gleason grade periphery (P < 0.01). Pairwise comparisons for the intensity of AR staining revealed differences between: the center and periphery of the dominant nodule center; the highest Gleason grade center and periphery; the center of the dominant nodule vs. the center of the highest Gleason grade; the periphery of the dominant nodule vs. the periphery of the highest Gleason grade; and the dominant nodule center vs. highest Gleason grade periphery (all P < 0.05). The AR H-score differed significantly between: normal vs. periphery of both the dominant nodule and the highest Gleason grade; the center and periphery of the highest Gleason grade; and the center of the dominant nodule vs. the periphery of the highest Gleason grade (P < 0.05; Table 2).
Trends in mean CD3+, CD4+, and CD8+ IHC quantitative staining were identified within the dominant nodule periphery according to peri-neural invasion (Table 3). Analysis of the periphery of the dominant nodule and the center of the highest Gleason grade region identified a trend of increasing AR intensity and AR H-score with Gleason score (Tables 4 and 5). We also identified an inverse trend between mean CD3 positivity in the center of the region with the highest Gleason grade when stratified according to the highest surgical Gleason grade (Table 5).
Specifically referring to the periphery of the highest Gleason grade region, we found noteworthy differential biomarker (AR and CD3+, CD4+, CD8+ TILs and the CD8/CD3 ratio) expression (Table 6). When comparing AR intensity and AR H-score according to race, AR expression was higher amongst samples from White men compared to samples from Black men, and its expression increased with Gleason grade (Table 6). Similarly, CD8 positivity correlated with increasing pre-treatment serum PSA. Interestingly, significant differential expression was identified across all AR categories according to surgical Gleason grade (P < 0.05; Table 6). Differential expression of CD3+, CD4+ and CD8+ tumor cells within this region was also noted when comparing the pathological stage of resected primary PCa (Table 6). Relatively higher CD3, CD4, and CD8 positivity was also seen, indicating peri-neural invasion (Table 6).
As seen in Table 7, the correlations between TIL positivity in the center and periphery of the dominant nodule, with corresponding center and periphery of the highest Gleason-graded region, respectively, were robust—most exceeding 0.70. The magnitude of these correlations differed markedly by race, significant in every instance except for CD4+ and AR H-score collected at the centers of the dominant nodule and highest Gleason-graded regions.
Discussion
The primary goal of this study was to establish methods for high-throughput tumor microarray (TMA)-based immunoprofiling of TILs and AR in primary resected PCa specimens. Our secondary objective was to use this platform to begin to test the hypothesis that differences in TIL type and quantity within resected PCa specimens of Black and White men correlate with known disparities in disease staging, severity, and possibly outcome [4-6, 10].
To improve our ability to both quickly and quantitatively characterize TIL populations in resected primary PCa specimens, to conclusively assess the role of TIL invasion in PCa outcome (particular with respect to health disparities), and to inform discussion of provider recommendations for care and treatment, methods were needed for a high-throughput IHC-based platform that could perform TIL profiling on FFPE prostate tissue. Guided by successful parallel efforts to profile TILs in other tumor types (e.g., breast [60], colorectal [61-63], and ovarian [64]), and using a preliminary cohort collected from a unique prostate tissue biorepository (see Methods), we report on the successful use of TMAs and a scoring system (Figure 1) to quantify the expression of CD8, CD3, CD4, and AR in multiple clinically-relevant regions of the primary resected PCa sample (e.g., the largest, or dominant, nodule, and the area with the highest Gleason-graded cancer; Figure 2).
Immunohistochemical Scoring at the Periphery of the Dominant Nodule in Relation to Clinical and Pathological Characteristics
| IHC Markers Mean positivity ± Standard Deviation | |||||||
|---|---|---|---|---|---|---|---|
| Characteristic | CD3+ | CD4+ | CD8+ | CD8+/CD3+ | AR+ % | AR Intensity | AR H-Score |
| Race | |||||||
| Black (n = 21) | 145.57±112.35 | 58.52±66.03 | 77.90±59.01 | 0.56±0.16 | 67.14±32.12 | 1.57±0.81 | 1.90±1.10 |
| White (n = 18) | 117.83±61.80 | 43.94±28.01 | 67.11±31.30 | 0.62±0.21 | 79.44±16.26 | 1.94±0.64 | 2.35±0.74 |
| P-value | NS | NS | NS | NS | NS | NS | NS |
| Pre-treatment PSA (ng/mL) | |||||||
| <10 (n = 34) | 124.68±91.89 | 47.12±44.70 | 65.47±36.30 | 0.58±0.17 | 73.24±25.67 | 1.71±0.76 | 2.09±0.96 |
| 10-20 (n = 2) | 227.50±123.74 | 114.50±153.44 | 188.50±108.19 | 0.82±0.03 | 50.00±56.57 | 1.50±0.71 | 1.45±1.77 |
| >20 (n = 3) | 161.33±64.36 | 72.50±53.03 | 80.33±41.74 | 0.51±0.27 | 83.33±11.55 | 2.33±0.58 | 2.73±0.06 |
| P-value | 0.079 | NS | NS | NS | NS | NS | NS |
| Clinical Stage | |||||||
| T1c (n = 27) | 130.96±98.62 | 51.15±50.30 | 68.67±39.33 | 0.58±0.19 | 73.00±26.86 | 1.67±0.78 | 2.07±0.97 |
| T2a (n = 5) | 100.50±52.67 | 33.00±21.18 | 58.80±30.41 | 0.60±0.10 | 82.00±13.04 | 2.00±0.71 | 2.52±0.86 |
| T2b (n = 2) | 113.00±38.18 | 16.00±14.14 | 79.00±46.67 | 0.67±0.19 | 50.00±56.57 | 1.50±0.71 | 1.45±1.77 |
| T2c (n = 3) | 171.67±125.16 | 139.50±118.09 | 136.00±113.58 | 0.75±0.12 | 70.00±34.68 | 2.00±0.00 | 2.10±1.04 |
| P-value | NS | NS | NS | NS | NS | NS | NS |
| Biopsy Gleason Score | |||||||
| 3+3 (n = 15) | 113.87±86.57 | 38.14±32.35 | 60.80±35.00 | 0.58±0.15 | 76.00±24.44 | 1.67±0.72 | 2.15±0.88 |
| 3+4 (n = 12) | 168.67±102.61 | 68.25±64.57 | 90.83±37.56 | 0.58±0.19 | 65.83±29.06 | 1.50±0.80 | 1.76±0.99 |
| 4+3 (n = 5) | 128.40±87.38 | 26.80±19.32 | 62.60±38.30 | 0.56±0.23 | 68.00±33.47 | 2.00±1.00 | 2.18±1.32 |
| 4+4 (n = 5) | 119.00±110.78 | 72.20±85.79 | 88.00±99.33 | 0.70±0.23 | 78.00±26.83 | 2.00±0.00 | 2.34±0.80 |
| 4+5,5+4 (n = 2) | 104.50±31.82 | 59.50±24.75 | 44.50±10.61 | 0.43±0.03 | 90.00±00.00 | 2.50±0.71 | 3.15±0.64 |
| P-value | NS | NS | NS | NS | NS | NS | NS |
| Surgical Gleason Score | |||||||
| 3+3 (n = 7) | 99.71±43.28 | 37.00±24.17 | 67.29±39.59 | 0.65±0.16 | 61.43±28.54 | 1.29±0.76 | 1.53±0.78 |
| 3+4 (n = 16) | 147.00±117.15 | 60.40±61.61 | 71.63±39.75 | 0.55±0.17 | 76.25±27.54 | 1.82±0.75 | 2.26±0.98 |
| 4+3 (n = 13) | 129.62±66.71 | 40.92±29.01 | 67.39±35.27 | 0.54±0.16 | 70.77±26.29 | 1.85±0.80 | 2.09±1.06 |
| 4+4 (n = 1) | 46.00±0.00 | 14.00±0.00 | 49.00±0.00 | 1.07±0.00 | 90.00±0.00 | 2.00±0.00 | 2.70±0.00 |
| 4+5,5+4 (n = 2) | 198.50±164.76 | 132.50±127.99 | 151.00±161.22 | 0.65±0.28 | 90.00±0.00 | 2.00±0.00 | 2.70±0.00 |
| P-value | NS | NS | NS | NS | NS | NS | NS |
| Pathological Stage | |||||||
| T2a (n = 3) | 94.00±38.04 | 37.33±16.17 | 73.67±49.22 | 0.74±0.21 | 80.00±10.00 | 1.67±0.58 | 2.13±0.55 |
| T2b (n = 2) | 69.50±12.02 | 18.00±18.39 | 35.50±9.19 | 0.53±0.22 | 75.00±21.21 | 2.00±1.41 | 2.40±1.70 |
| T2c (n = 27) | 132.37±98.63 | 53.62±51.14 | 69.04±37.31 | 0.58±0.17 | 71.85±28.29 | 1.70±0.78 | 2.07±1.00 |
| T3a (n = 5) | 147.00±74.40 | 35.20±9.72 | 77.80±33.86 | 0.55±0.17 | 70.00±33.91 | 1.60±0.55 | 1.92±1.06 |
| T3b/T4 (n = 2) | 224.00±128.69 | 129.00±132.94 | 149.50±163.34 | 0.55±0.41 | 80.00±1.14 | 2.50±0.71 | 2.75±0.07 |
| P-value | 0.043 | NS | NS | NS | NS | NS | NS |
| Perineural Invasion | |||||||
| Absent (n = 6) | 64.67±30.74 | 17.20±14.62 | 40.33±27.03 | 0.60±0.14 | 76.67±17.51 | 1.83±0.75 | 2.27±0.99 |
| Present (n =33) | 145.15±94.74 | 57.27±54.18 | 78.85±48.81 | 0.58±0.19 | 72.12±27.92 | 1.73±0.76 | 2.08±0.97 |
| P-value | 0.005 | 0.024 | 0.011 | NS | NS | NS | NS |
Immunohistochemical Scoring at the Center of the Dominant Nodule in Relation to Clinical and Pathological Characteristics
| IHC Markers Mean positivity ± Standard Deviation | |||||||
|---|---|---|---|---|---|---|---|
| Characteristic | CD3+ | CD4+ | CD8+ | CD8+/CD3+ | AR+ % | AR Intensity | AR H-Score |
| Race | |||||||
| Black (n = 21) | 138.00±82.72 | 52.85±87.27 | 76.55±62.19 | 0.52±0.20 | 63.30±37.48 | 1.45±0.83 | 1.75±1.20 |
| White (n = 18) | 95.83±72.19 | 47.89±67.47 | 53.67±49.10 | 0.55±0.18 | 69.56±33.80 | 1.50±0.79 | 1.86±1.07 |
| P-value | NS | NS | NS | NS | NS | NS | NS |
| Pre-treatment PSA (ng/mL) | |||||||
| <10 (n = 34) | 121.62±81.81 | 54.86±80.87 | 67.77±58.49 | 0.54±0.19 | 68.32±33.45 | 1.53±0.79 | 1.90±1.10 |
| 10-20 (n = 2) | 139.00±99.81 | 6.00±1.78 | 30.00±24.33 | 0.40±0.09 | 53.67±46.69 | 1.33±0.58 | 1.30±1.14 |
| >20 (n = 3) | 70.33±0.00 | 16.00±0.00 | 30.00±0.00 | 0.74±0.00 | 0.00±0.00 | 0.00±0.00 | 0.00±0.00 |
| P-value | 0.079 | NS | NS | NS | NS | NS | NS |
| Clinical Stage | |||||||
| T1c (n = 27) | 135.78±82.97 | 61.44±88.67 | 74.89±61.93 | 0.53±0.17 | 68.41±33.90 | 1.41±0.69 | 1.76±1.05 |
| T2a (n = 5) | 79.60±50.13 | 29.00±23.05 | 44.80±27.28 | 0.62±0.27 | 68.00±38.99 | 1.40±0.89 | 1.90±1.20 |
| T2b (n = 2) | 76.50±88.39 | 4.50±2.12 | 53.00±27.28 | 0.48±0.37 | 45.00±63.64 | 1.50±2.12 | 1.80±2.55 |
| T2c (n = 3) | 108.50±34.65 | 48.50±41.72 | 61.50±27.58 | 0.55±0.08 | 35.50±48.79 | 2.00±1.41 | 1.40±1.98 |
| P-value | NS | NS | NS | NS | NS | NS | NS |
| Biopsy Gleason Score | |||||||
| 3+3 (n = 15) | 109.60±70.83 | 52.73±20.91 | 68.73±68.94 | 0.60±0.22 | 62.47±38.54 | 1.47±0.74 | 1.71±1.18 |
| 3+4 (n = 12) | 162.33±80.97 | 61.42±80.25 | 86.50±48.73 | 0.54±0.15 | 59.25±37.39 | 1.00±0.43 | 1.26±0.86 |
| 4+3 (n = 5) | 72.20±68.53 | 24.80±41.55 | 42.00±44.86 | 0.50±0.15 | 70.00±40.62 | 1.40±0.89 | 1.92±1.17 |
| 4+4 (n = 5) | 96.25±100.61 | 53.00±59.21 | 40.25±40.48 | 0.41±0.18 | 85.00±10.00 | 2.50±0.58 | 2.95±0.44 |
| 4+5,5+4(n = 2) | 73.50±54.45 | 27.50±7.78 | 28.50±17.68 | 0.41±0.06 | 90.00±00.00 | 2.50±0.71 | 3.15±0.64 |
| P-value | NS | NS | NS | NS | NS | NS | NS |
| Surgical Gleason Score | |||||||
| 3+3 (n = 7) | 175.29±107.94 | 89.71±97.40 | 95.00±60.89 | 0.61±0.24 | 50.14±38.95 | 1.00±0.58 | 1.13±0.98 |
| 3+4 (n = 16) | 121.25±65.35 | 54.81±92.94 | 74.00±65.33 | 0.58±0.16 | 66.69±37.66 | 1.44±0.63 | 1.72±1.12 |
| 4+3 (n = 13) | 91.54±70.01 | 28.85±36.97 | 46.08±37.75 | 0.46±0.18 | 70.77±32.78 | 1.69±1.03 | 2.12±1.15 |
| 4+4 (n = 1) | 16.00±0.00 | 6.00±0.00 | 6.00±0.00 | 0.50±0.00 | 90.00±0.00 | 2.00±0.00 | 2.70±0.00 |
| 4+5,5+4(n = 2) | 112.00±0.00 | 33.00±0.00 | 33.00±0.00 | 0.37±0.00 | 90.00±0.00 | 2.00±0.00 | 2.70±0.00 |
| P-value | NS | NS | NS | NS | NS | NS | NS |
| Pathological Stage | |||||||
| T2a (n = 3) | 196.33±82.04 | 148.67±125.13 | 119.00±86.89 | 0.56±0.17 | 60.33±51.38 | 1.00±0.00 | 1.20±1.04 |
| T2b (n = 2) | 67.50±51.62 | 14.50±19.09 | 33.00±0.00 | 0.69±0.53 | 45.00±26.15 | 1.50±2.12 | 1.80±2.55 |
| T2c (n = 27) | 123.33±79.88 | 49.89±76.04 | 68.33±55.94 | 0.54±0.16 | 66.93±33.34 | 1.44±0.70 | 1.74±1.03 |
| T3a (n = 5) | 85.00±52.88 | 18.80±19.49 | 45.50±38.71 | 0.46±0.19 | 74.00±41.59 | 1.80±1.10 | 2.40±1.39 |
| T3b/T4 (n = 2) | 6.00±0.00 | 3.00±0.00 | 2.00±0.00 | 0.33±0.00 | 74.00±41.59 | 2.00±0.00 | 2.10±0.00 |
| P-value | 0.068 | 0.034 | NS | NS | NS | 0.095 | NS |
| Perineural Invasion | |||||||
| Absent (n = 6) | 89.67±53.75 | 22.83±16.13 | 43.33±30.21 | 0.51±0.30 | 56.83±44.32 | 1.67±1.03 | 1.85±1.51 |
| Present (n=33) | 123.34±83.33 | 55.69±83.39 | 69.91±59.92 | 0.54±0.16 | 68.03±34.09 | 1.43±0.76 | 1.79±1.07 |
| P-value | NS | NS | NS | NS | NS | NS | NS |
Immunohistochemical Scoring at the Center of the Highest Gleason-Graded Region in Relation to Clinical and Pathological Characteristics
| IHC Markers Mean positivity ± Standard Deviation | |||||||
|---|---|---|---|---|---|---|---|
| Characteristic | CD3+ | CD4+ | CD8+ | CD8+/CD3+ | AR+ % | AR Intensity | AR H-Score |
| Race | |||||||
| Black (n = 21) | 137.20±83.37 | 55.20±86.45 | 76.45±61.57 | 0.54±0.18 | 63.30±35.75 | 1.50±0.76 | 1.73±1.16 |
| White (n = 18) | 137.67±113.91 | 74.06±88.68 | 65.39±53.21 | 0.51±0.19 | 67.33±33.34 | 1.72±0.83 | 1.97±1.08 |
| P-value | NS | NS | NS | NS | NS | NS | NS |
| Pre-treatment PSA (ng/mL) | |||||||
| <10 (n = 34) | 137.35±100.61 | 62.74±87.99 | 71.65±58.99 | 0.53±0.18 | 68.44±33.74 | 1.59±0.78 | 1.92±1.11 |
| 10-20 (n = 2) | 139.67±96.42 | 85.33±104.67 | 59.00±52.60 | 0.39±0.16 | 40.33±34.06 | 2.00±1.00 | 1.40±1.23 |
| >20 (n = 3) | 133.00±0.00 | 48.00±0.00 | 93.00±0.00 | 0.70±0.00 | 30.00±0.00 | 1.00±0.00 | 0.60±0.00 |
| P-value | NS | NS | NS | NS | NS | NS | NS |
| Clinical Stage | |||||||
| T1c (n = 27) | 135.78±82.97 | 61.44±88.67 | 74.89±61.93 | 0.53±0.17 | 68.41±33.90 | 1.41±0.69 | 1.76±1.05 |
| T2a (n = 5) | 79.60±50.13 | 29.00±23.05 | 44.80±27.28 | 0.62±0.27 | 68.00±38.99 | 1.40±0.89 | 1.90±1.20 |
| T2b (n = 2) | 76.50±88.39 | 4.50±2.12 | 53.00±27.28 | 0.48±0.37 | 45.00±63.64 | 1.50±2.12 | 1.80±2.55 |
| T2c (n = 3) | 108.50±34.65 | 48.50±41.72 | 61.50±27.58 | 0.55±0.08 | 35.50±48.79 | 2.00±1.41 | 1.40±1.98 |
| P-value | NS | NS | NS | NS | NS | NS | NS |
| Biopsy Gleason Score | |||||||
| 3+3 (n = 15) | 110.87±70.26 | 53.87±95.12 | 68.67±68.66 | 0.59±0.20 | 60.47±38.90 | 1.53±0.74 | 1.71±1.21 |
| 3+4 (n = 12) | 152.25±84.88 | 58.67±80.89 | 80.33±53.25 | 0.52±0.18 | 57.58±36.82 | 1.17±0.58 | 1.35±0.95 |
| 4+3 (n = 5) | 187.80±137.17 | 84.80±74.85 | 83.40±45.53 | 0.49±0.14 | 72.00±26.83 | 1.80±0.84 | 2.04±0.88 |
| 4+4 (n = 5) | 96.25±100.61 | 53.00±59.21 | 40.25±40.48 | 0.41±0.18 | 85.00±10.00 | 2.50±0.58 | 2.95±0.44 |
| 4+5,5+4(n = 2) | 204.00±239.00 | 144.50±173.24 | 67.00±72.12 | 0.39±0.10 | 90.00±0.00 | 2.50±0.71 | 3.15±0.64 |
| P-value | NS | NS | NS | 0.047 | NS | NS | NS |
| Surgical Gleason Score | |||||||
| 3+3 (n = 7) | 175.29±107.94 | 89.71±97.40 | 95.00±60.89 | 0.61±0.24 | 50.14±38.95 | 1.00±0.58 | 1.13±0.98 |
| 3+4 (n = 16) | 123.06±63.64 | 55.56±92.56 | 73.44±65.57 | 0.55±0.16 | 66.69±37.66 | 1.50±0.63 | 1.78±1.14 |
| 4+3 (n = 13) | 125.92±106.74 | 49.77±58.22 | 56.92±42.53 | 0.46±0.17 | 67.69±28.91 | 2.00±0.91 | 2.18±1.10 |
| 4+4 (n = 1) | 16.00±0.00 | 6.00±0.00 | 8.00±0.00 | 0.50±0.00 | 90.00±0.00 | 2.00±0.00 | 2.70±0.00 |
| 4+5,5+4(n = 2) | 112.00±0.00 | 267.00±0.00 | 118.00±0.00 | 0.32±0.00 | 90.00±0.00 | 2.00±0.00 | 2.70±0.00 |
| P-value | NS | NS | NS | NS | NS | 0.002 | 0.017 |
| Pathological Stage | |||||||
| T2a (n = 3) | 196.33±54.02 | 148.67±47.62 | 119.00±86.89 | 0.56±0.17 | 60.33±51.38 | 1.00±0.00 | 1.21±1.03 |
| T2b (n = 2) | 67.50±66.16 | 14.50±58.32 | 33.00±0.00 | 0.69±0.53 | 45.00±63.64 | 1.50±2.12 | 1.80±2.55 |
| T2c (n = 27) | 119.56±18.01 | 49.30±15.87 | 65.56±56.55 | 0.53±0.16 | 65.07±33.62 | 1.56±0.70 | 1.79±1.06 |
| T3a (n = 5) | 203.80±41.85 | 85.00±36.88 | 79.00±49.04 | 0.41±0.20 | 78.00±26.83 | 2.00±0.71 | 2.46±1.11 |
| T3b/T4 (n = 2) | 251.00±93.57 | 206.00±82.47 | 118.00±0.00 | 0.47±0.00 | 60.00±0.00 | 3.00±0.00 | 2.40±0.00 |
| P-value | NS | NS | NS | NS | NS | 0.026 | NS |
| Perineural Invasion | |||||||
| Absent (n = 6) | 88.0±55.68 | 23.67±15.38 | 44.67±28.47 | 0.57±0.26 | 51.83±44.23 | 1.67±1.03 | 1.70±1.52 |
| Present (n=33) | 146.69±101.56 | 71.72±92.67 | 76.19±60.17 | 0.52±0.17 | 67.72±32.27 | 1.59±0.76 | 1.87±1.05 |
| P-value | NS | NS | NS | NS | NS | NS | NS |
Immunohistochemical Scoring at the Periphery of the Highest Gleason Graded Region in Relation to Clinical and Pathological Characteristics
| IHC Markers Mean positivity ± Standard Deviation | |||||||
|---|---|---|---|---|---|---|---|
| Characteristic | CD3+ | CD4+ | CD8+ | CD8+/CD3+ | AR+ % | AR Intensity | AR H-Score |
| Race | |||||||
| Black (n = 21) | 144.24±112.56 | 60.10±64.91 | 76.19±58.78 | 0.55±0.16 | 70.48±29.41 | 1.67±0.80 | 2.02±1.01 |
| White (n = 18) | 120.50±77.93 | 52.41±44.29 | 67.06±34.54 | 0.60±0.19 | 79.44±17.31 | 2.17±0.62 | 2.54±0.83 |
| P-value | NS | NS | NS | NS | NS | 0.045 | NS |
| Pre-treatment PSA (ng/mL) | |||||||
| <10 (n = 34) | 126.12±98.65 | 51.27±50.92 | 64.47±38.90 | 0.56±0.17 | 73.82±26.06 | 1.85±0.78 | 2.23±1.02 |
| 10-20 (n = 2) | 161.33±40.77 | 79.50±12.02 | 89.33±6.43 | 0.58±0.18 | 76.67±15.28 | 2.33±0.58 | 2.50±0.21 |
| >20 (n = 3) | 213.00±0.00 | 125.50±137.89 | 173.50±129.40 | 0.79±0.07 | 85.00±7.07 | 2.00±0.00 | 2.55±0.17 |
| P-value | NS | NS | NS | NS | NS | NS | NS |
| Clinical Stage | |||||||
| T1c (n = 27) | 126.67±97.14 | 51.22±48.63 | 64.85±39.67 | 0.56±0.19 | 72.59±26.69 | 1.78±0.80 | 2.15±0.99 |
| T2a (n = 5) | 158.40±129.58 | 63.20±75.42 | 78.20±41.82 | 0.58±0.13 | 82.00±13.04 | 2.00±0.71 | 2.52±0.86 |
| T2b (n = 2) | 98.50±17.68 | 27.00±1.41 | 64.00±25.46 | 0.64±0.14 | 85.00±7.07 | 2.00±0.00 | 2.55±0.21 |
| T2c (n = 3) | 171.67±125.16 | 139.50±118.09 | 136.00±113.58 | 0.74±0.12 | 70.00±34.64 | 2.00±0.00 | 2.10±1.04 |
| P-value | NS | NS | NS | NS | NS | NS | NS |
| Biopsy Gleason Score | |||||||
| 3+3 (n = 15) | 114.93±86.64 | 40.21±30.55 | 58.00±36.39 | 0.54±0.15 | 75.33±24.16 | 1.87±0.74 | 2.28±0.91 |
| 3+4 (n = 12) | 157.67±103.41 | 63.75±64.16 | 85.75±39.11 | 0.58±0.18 | 65.83±29.06 | 1.50±0.80 | 1.75±0.99 |
| 4+3 (n = 5) | 97.80±59.63 | 38.80±28.12 | 56.40±29.26 | 0.61±0.13 | 84.00±15.17 | 2.60±0.55 | 3.02±0.74 |
| 4+4 (n = 5) | 119.00±110.78 | 72.20±85.79 | 88.00±99.33 | 0.70±0.25 | 78.00±26.83 | 2.00±0.00 | 2.34±0.80 |
| 4+5,5+4(n = 2) | 249.00±172.53 | 135.00±82.02 | 93.00±57.98 | 0.39±0.03 | 90.00±0.00 | 2.50±0.71 | 3.15±0.64 |
| P-value | NS | NS | NS | NS | NS | NS | NS |
| Surgical Gleason Score | |||||||
| 3+3 (n = 7) | 99.71±43.28 | 37.00±24.17 | 67.29±39.59 | 0.65±0.16 | 61.43±28.54 | 1.29±0.76 | 1.53±0.78 |
| 3+4 (n = 16) | 147.94±116.95 | 61.60±60.66 | 69.38±41.21 | 0.52±0.16 | 75.63±27.32 | 1.94±0.77 | 2.36±1.03 |
| 4+3 (n = 13) | 107.77±48.93 | 41.54±24.28 | 59.85±30.98 | 0.55±0.13 | 76.92±20.57 | 2.15±0.69 | 2.45±0.94 |
| 4+4 (n = 1) | 46.00±0.00 | 14.00±0.00 | 49.00±0.00 | 1.07±0.00 | 90.00±0.00 | 2.00±0.00 | 2.70±0.00 |
| 4+5,5+4(n = 2) | 343.00±39.60 | 208.00±21.21 | 199.50±92.63 | 0.60±0.34 | 90.00±0.00 | 2.00±0.00 | 2.70±0.00 |
| P-value | NS | NS | NS | NS | 0.032 | 0.041 | 0.032 |
| Pathological Stage | |||||||
| T2a (n = 3) | 94.00±38.04 | 37.33±16.17 | 73.67±49.22 | 0.74±0.21 | 80.00±10.00 | 1.67±0.58 | 2.13±0.55 |
| T2b (n = 2) | 69.50±12.02 | 18.00±18.38 | 35.50±9.19 | 0.53±0.22 | 75.00±21.21 | 2.00±1.41 | 2.40±1.70 |
| T2c (n = 27) | 128.07±97.21 | 52.65±49.45 | 65.22±37.70 | 0.56±0.17 | 71.48±28.11 | 1.81±0.79 | 2.14±1.02 |
| T3a (n = 5) | 161.80±121.40 | 65.00±71.93 | 79.00±40.06 | 0.54±0.15 | 88.00±8.37 | 2.20±0.45 | 2.84±0.67 |
| T3b/T4 (n = 2) | 255.00±84.85 | 155.50±95.46 | 179.50±120.92 | 0.66±0.25 | 75.00±21.21 | 2.50±0.71 | 2.55±0.21 |
| P-value | 0.036 | NS | NS | NS | NS | NS | NS |
| Perineural Invasion | |||||||
| Absent (n = 6) | 64.83±30.63 | 19.40±13.09 | 39.33±27.77 | 0.58±0.16 | 76.67±17.51 | 2.00±0.63 | 2.35±0.88 |
| Present (n=33) | 145.73±100.65 | 62.30±57.97 | 77.91±49.62 | 0.57±0.18 | 74.24±25.98 | 1.88±0.78 | 2.25±0.98 |
| P-value | 0.009 | 0.029 | 0.018 | NS | NS | NS | NS |
Spearman Correlations Between Cellular Protein Expression in the Center of the Dominant Nodule vs. the Center of the Highest Gleason Graded Region (left) and the Periphery of the Dominant Nodule vs. the Periphery of the Highest Gleason Graded Region (right) for African American and Caucasian Patients, with Tests of Differences
| Correlation between centers of DN and HGG | Correlation between peripheries of DN and HGG | |||||||||
|---|---|---|---|---|---|---|---|---|---|---|
| Marker | Black (n = 20) | White (n = 18) | Z* | P-value | Marker | Black (n = 20) | White (n = 18) | Z* | P-value | |
| CD3+ | 1.00 | 0.313 | 9.81 | <0.001 | CD3+ | 0.999 | 0.595 | 8.79 | <0.001 | |
| CD4+ | 0.853 | 0.597 | 1.63 | 0.103 | CD4+ | 0.984 | 0.714 | 4.28 | <0.001 | |
| CD8+ | 0.998 | 0.399 | 8.56 | <0.001 | CD8+ | 0.990 | 0.254 | 6.74 | <0.001 | |
| CD8/CD3 | 0.953 | 0.793 | 2.21 | 0.027 | CD8/CD3 | 0.991 | 0.719 | 5.06 | <0.001 | |
| AR+% | 0.986 | 0.862 | 3.32 | <0.001 | AR+% | 0.970 | 0.699 | 3.46 | <0.001 | |
| AR Intensity | 0.976 | 0.853 | 2.65 | 0.008 | AR Intensity | 0.900 | 0.599 | 2.20 | 0.03 | |
| AR H Score | 0.968 | 0.893 | 1.76 | 0.08 | AR H Score | 0.945 | 0.609 | 3.04 | 0.002 | |
*Fisher r-to-z transformation.
DN, dominant nodule; HGG, highest Gleason grade.
Despite the small sample size of this preliminary cohort, we found statistically relevant differences in the expression of TIL markers (CD3, CD4, CD8 and the CD8/CD3 ratio) between normal/benign tissues and within/between the different regions of the tumor, and also in relation to some measures of disease severity [e.g., surgical Gleason grade (Tables 3-6)], as expected, given the known involvement of TILs in PCa tumorigenesis [36, 37, 39, 41, 65]. These data support the technical validity of this platform. There were also trends (though not yet statistically significant) suggesting correlations between TIL markers and peri-neural invasion, surgical Gleason grade, and pre-treatment serum PSA. We also identified expected variations in the expression of AR, in both intensity and H-score, like previous studies [14, 47].
A second objective of this study was to begin to explore differences in TIL invasion and AR expression in racially diverse PCa specimens. This premise was based on studies that found racially-based differences in the expression of genes related to TIL proliferation, activation, and signaling [25-30], as well as androgen signaling [14-17]. Despite a small sample size in this study, we were already able to find statistically relevant racial differences in the intensity of AR expression at the periphery of the highest surgical Gleason graded tissue (Table 6). Most strikingly, we also found strong correlations between the TIL expression profiles at clinically-relevant sites in the PCa specimens of Black men, but not necessarily White men (Table 7). For example, if a PCa specimen had high expression of CD3 at the center of the dominant nodule and was from a Black man, in our study, that specimen always also had high expression of CD3 at the center of the highest Gleason-graded region (Spearman correlation of 1.00; Table 7). Correlation was similarly high for the expression of all TIL markers and AR intensity and scoring for PCa specimens from Black men. This suggests that PCa tumors from Black men may have more homogenous TIL invasion and AR expression across the tumor, and that profiling these markers at any clinically-relevant site (e.g., dominant nodule or area of highest Gleason grade) would provide as much information as profiling at all sites. Conversely, this correlation was not as consistent in PCa specimens from White men, suggesting that TIL infiltration in White men may be more heterogeneous and that certain combinations of marker/location may correlate more significantly with disease outcome than others. Future studies testing this hypothesis are warranted.
It is important to note the limitations of this study. First and foremost, as this was a preliminary study aimed primarily at developing methodology, the sample size was small and is likely to have contributed to the high variability in scoring data. This variability is expected to become smaller as additional samples are profiled and will ultimately serve to refine our ability to detect statistically relevant differences in TIL profiling between subgroups of PCa patients. Second, to best inform larger-scale, future studies utilizing this platform, we explored and report upon a wide variety of factors and parameters, including but not limited to: four markers of TILs, three measures of AR status, four clinically-relevant geographical locations within the tumor, and a host of clinicopathological variables (i.e., pre-treatment PSA, Gleason grade at biopsy and surgery, clinical and pathological stage, and presence of peri-neural invasion). While the study was not sufficiently powered to assess differences within and between all these variables, we think it is important to report on these findings since there were notable trends and patterns in the data that are provocative and will generate testable hypotheses for future studies.
Colorectal cancer has been the model for proof-of-principle research, development, and validation of the Immunoscore. Noteworthy progress has been made in the immunophenotyping of tumors of the colon and rectum to enhance the: characterization of the tumor microenvironment or immune landscape, staging of disease, prognostic scoring, predicting disease outcome, and providing clinical decision support (66-69). Galon et al. as part of a global task force have sought to gain prognostic, predictive and mechanistic insights through a standardized, immune classification and stratification system for colorectal cancer, the Immunoscore. This worldwide collaborative group has demonstrated the predictive value of the Immunscore and its researchers have recently found the Immunoscore to be superior to microsatellite instability in predicting recurrence-free and disease-specific survival in colorectal cancer (70).
The current Immunoscore classification for colorectal cancer, is based on positivity to CD3 and CD8—both along the margin and center of the tumor (67). CD45RO was of interest initially but was not chosen by the Task Force due to high background staining and technical limitations. A low density of cell types in both tumor regions results in an Immunoscore of “0”; when high densities are found, the sample is given an Immunoscore of “4”.
Our intent is to develop a modified Immunoscore, incorporating quantitation of CD4+ cell populations, given their supposed involvement in prostate tumorigenesis. In this study we showed the technical feasibility of TMA expression multi-marker profiling of TILs in primary resected PCa in a racially diverse cohort. Specifically, CD3, CD4, CD8, and CD8/CD3 cellular protein expression differed from normal in the periphery of the dominant nodule, the center of the highest Gleason grade, and the periphery of the highest Gleason grade (P < 0.05). Correlations were found to be robust between TIL expression in the center and periphery of the dominant nodule, with corresponding center and periphery of the highest Gleason grade, respectively, and the magnitude of these correlations differed significantly according to race (P < 0.05).
Significant correlations have been found between the type, density, and spatial distribution of infiltrating lymphocytes and outcome in patients with PCa. Immunotherapy-based approaches to enhance host anti-tumor immune responses are exciting and transformative areas of current research in difficult-to-treat cancer such as castrate-refractory metastatic PCa. The development and validation of methods such as biomarker-based clinical decision support tools that reliably quantify and localize clinically-relevant immune infiltrates in the prostate microenvironment [harnessing high-throughput tumor microarray (TMA)-based immunoprofiling] will be important to screening and selecting PCa patients for immunotherapy-based anti-PCa therapy. We believe that this will enable the delivery of personalized prostate cancer care with precision.
Conclusion
In conclusion, these findings support the continued use of a TMA-based platform to characterize TIL infiltration in PCa in a larger cohort, particularly with respect to short- and long-term survival outcomes and responses to various modalities of treatment and in relation to race.
Abbreviations
AR: androgen receptor
CaP: carcinoma of the prostate
FFPE: formalin-fixed paraffin embedded
H&E: hematoxylin and eosin
IHC: immunohistochemistry
PCa: prostate cancer
PSA: prostate-specific antigen
TILs: tumor-infiltrating lymphocytes
TMA: tissue microarray
WITF: Worldwide Immunoscoring Task Force
Acknowledgements
We are grateful to Nada Wood of Virginia Urology for her administrative support of and data management related to this research effort, and to Dr. Alixanna M. Norris for her scientific grant review and writing support of our work. We also acknowledge the support of the Biorepository of Eastern Virginia Medical School and MaryAnn Clements, Biorepository Supervisor. This work was supported by NIH/NCI R21 funding (1R21CA1900767-01).
Contributing Author Declaration
We certify that all individuals who qualify as authors have been listed and that each has participated in one or more of the following areas:
- conception and design of this work;
- acquisition and/or analysis of data;
- writing and/or critical revision of the document;
- supervision of this cooperative research effort.
All contributing authors approve of the submission of this version of the manuscript and assert that the document represents valid work. If information derived from another source was used in this manuscript, then we obtained all necessary approvals to use it, and made appropriate acknowledgements in the document.
All contributing authors take public responsibility for this work.
Competing Interests
The authors have declared that no competing interest exists.
References
1. Surveillance Epidemiology, End Results (SEER) Program. Seer Cancer Stat Facts: Prostate Cancer. Bethesda, MD: National Cancer Institute. 2017
2. Tsodikov A, Gulati R, de Carvalho TM. et al. Is prostate cancer different in black men? Answers from 3 natural history models. Cancer. 2017;123(12):2312-2319
3. Wang C, Kamrava M, King C, Steinberg ML. Racial disparity in prostate cancer-specific mortality for high-risk prostate cancer: A population-based study. Cureus. 2017;9(1):e961
4. DeSantis CE, Siegel RL, Sauer AG. et al. Cancer statistics for African Americans, 2016: Progress and opportunities in reducing racial disparities. CA: A Cancer Journal for Clinicians. 2016;66(4):290-308
5. Surveillance Epidemiology, End Results (SEER) Program. Seer*stat database: Mortality—all cod, aggregated with state, total U.S. (1969-2012). National Cancer Institute. 2015
6. Marlow NM, Halpern MT, Pavluck AL. et al. Disparities associated with advanced prostate cancer stage at diagnosis. Journal of Health Care for the Poor and Underserved. 2010;21(1):112-131
7. Kane CJ, Im R, Amling CL. et al. Outcomes after radical prostatectomy among men who are candidates for active surveillance: Results from the search database. Urology. 2010;76(3):695-700
8. Odom BD, Mir MC, Hughes S. et al. Active surveillance for low-risk prostate cancer in African American men: A multi-institutional experience. Urology. 2014;83(2):364-368
9. Xin H. Racial disparity in localized prostate cancer mortality. Journal of the National Medical Association. 2017;109(2):86-92
10. He T, Mullins CD. Age-related racial disparities in prostate cancer patients: A systematic review. Ethn Health. 2017;22(2):184-195
11. Leapman MS, Freedland SJ, Aronson WJ. et al. Pathological and biochemical outcomes among African-American and Caucasian men with low risk prostate cancer in the search database: Implications for active surveillance candidacy. The Journal of Urology. 2016;196(5):1408-1414
12. Taksler GB, Keating NL, Cutler DM. Explaining racial differences in prostate cancer mortality. Cancer. 2012;118(17):4280-4289
13. Sundi D, Ross AE, Humphreys EB. et al. African American men with very low-risk prostate cancer exhibit adverse oncologic outcomes after radical prostatectomy: Should active surveillance still be an option for them? J Clin Oncol. 2013;31(24):2991-2997
14. Gaston KE, Kim D, Singh S. et al. Racial differences in androgen receptor protein expression in men with clinically localized prostate cancer. The Journal of Urology. 2003;170(3):990-993
15. Edwards A, Hammond HA, Jin L. et al. Genetic variation at five trimeric and tetrameric tandem repeat loci in four human population groups. Genomics. 1992;12(2):241-253
16. Irvine RA, Yu MC, Ross RK, Coetzee GA. The cag and ggc microsatellites of the androgen receptor gene are in linkage disequilibrium in men with prostate cancer. Cancer Res. 1995;55(9):1937-1940
17. Sartor O, Zheng Q, Eastham JA. Androgen receptor gene cag repeat length varies in a race-specific fashion in men without prostate cancer. Urology. 1999;53(2):378-380
18. Di Lorenzo G, Tortora G, D'Armiento FP. et al. Expression of epidermal growth factor receptor correlates with disease relapse and progression to androgen-independence in human prostate cancer. Clin Cancer Res. 2002;8(11):3438-3444
19. Shuch B, Mikhail M, Satagopan J. et al. Racial disparity of epidermal growth factor receptor expression in prostate cancer. J Clin Oncol. 2004;22(23):4725-4729
20. Winter DL, Hanlon AL, Raysor SL. et al. Plasma levels of IGF-1, IGF -2, and IGFBP-3 in White and African-American men at increased risk of prostate cancer. Urology. 2001;58(4):614-618
21. Ricks-Santi L, Mason T, Apprey V. et al. P53 pro72arg polymorphism and prostate cancer in men of African descent. Prostate. 2010;70(16):1739-1745
22. Guo Y, Sigman DB, Borkowski A, Kyprianou N. Racial differences in prostate cancer growth: Apoptosis and cell proliferation in Caucasian and African-American patients. Prostate. 2000;42(2):130-136
23. Spratt DE, Chan T, Waldron L. et al. Racial/ethnic disparities in genomic sequencing. JAMA Oncol. 2016;2(8):1070-1074
24. Hoffmann TJ, Van Den Eeden SK, Sakoda LC. et al. A large multiethnic genome-wide association study of prostate cancer identifies novel risk variants and substantial ethnic differences. Cancer Discov. 2015;5(8):878-891
25. Rose AE, Satagopan JM, Oddoux C. et al. Copy number and gene expression differences between African American and Caucasian American prostate cancer. Journal of Translational Medicine. 2010;8:70
26. Reams RR, Agrawal D, Davis MB. et al. Microarray comparison of prostate tumor gene expression in African-American and Caucasian American males: A pilot project study. Infectious agents and cancer. 2009;4(Suppl 1):S3
27. Venkatesh K, Lajwanti D, Kiran SP. et al. Differentially expressed genes in tumors of prostate cancer in American patients with European and African origin. J Pharm Res. 2013;6:583-588
28. Martin DN, Starks AM, Ambs S. Biological determinants of health disparities in prostate cancer. Curr Opin Oncol. 2013;25(3):235-241
29. Wallace TA, Prueitt RL, Yi M. et al. Tumor immunobiological differences in prostate cancer between African-American and European-American men. Cancer Res. 2008;68(3):927-936
30. Powell IJ, Bollig-Fischer A. Minireview: The molecular and genomic basis for prostate cancer health disparities. Mol Endocrinol. 2013;27(6):879-891
31. Friedlander DF, Trinh QD, Krasnova A. et al. Racial disparity in delivering definitive therapy for intermediate/high-risk localized prostate cancer: The impact of facility features and socioeconomic characteristics. European Urology. 2017 Aug 1. pii: S0302-2838(17)30652-8
32. Holmes JA, Bensen JT, Mohler JL. et al. Quality of care received and patient-reported regret in prostate cancer: Analysis of a population-based prospective cohort. Cancer. 2017;123(1):138-143
33. Galon J, Costes A, Sanchez-Cabo F. et al. Type, density, and location of immune cells within human colorectal tumors predict clinical outcome. Science. 2006;313(5795):1960-1964
34. Chornokur G, Dalton K, Borysova ME, Kumar NB. Disparities at presentation, diagnosis, treatment, and survival in African American men, affected by prostate cancer. Prostate. 2011;71(9):985-997
35. Valdman A, Jaraj SJ, Comperat E. et al. Distribution of FOXP3-, CD4- and CD8-positive lymphocytic cells in benign and malignant prostate tissue. APMIS. 2010;118(5):360-365
36. Davidsson S, Ohlson AL, Andersson SO. et al. CD4 helper t cells, CD8 cytotoxic t cells, and FoxP3(+) regulatory T cells with respect to lethal prostate cancer. Modern pathology. 2013;26(3):448-455
37. Kiniwa Y, Miyahara Y, Wang HY. et al. CD8+ FOXP3+ regulatory T cells mediate immunosuppression in prostate cancer. Clin Cancer Res. 2007;13(23):6947-6958
38. Man YG, Stojadinovic A, Mason J. et al. Tumor-infiltrating immune cells promoting tumor invasion and metastasis: Existing theories. Journal of Cancer. 2013;4(1):84-95
39. Karja V, Aaltomaa S, Lipponen P. et al. Tumour-infiltrating lymphocytes: A prognostic factor of PSA-free survival in patients with local prostate carcinoma treated by radical prostatectomy. Anticancer Res. 2005;25(6C):4435-4438
40. Comperat E, Egevad L, Camparo P. et al. Clinical significance of intratumoral CD8+ regulatory T cells in prostate carcinoma. The International Academy of Cytology [and] American Society of Cytology. 2010;32(1):39-44
41. Nardone V, Botta C, Caraglia M. et al. Tumor infiltrating t lymphocytes expressing FOXP3, CCR7 or PD-1 predict the outcome of prostate cancer patients subjected to salvage radiotherapy after biochemical relapse. Cancer Biol Ther. 2016;17(11):1213-1220
42. Kinseth MA, Jia Z, Rahmatpanah F. et al. Expression differences between African American and Caucasian prostate cancer tissue reveals that stroma is the site of aggressive changes. Int J Cancer. 2014;134(1):81-91
43. Matuszak EA, Kyprianou N. Androgen regulation of epithelial-mesenchymal transition in prostate tumorigenesis. Expert Review of Endocrinology & Metabolism. 2011;6(3):469-482
44. Lo UG, Lee CF, Lee MS, Hsieh JT. The role and mechanism of epithelial-to-mesenchymal transition in prostate cancer progression. International Journal of Molecular Sciences. 2017 Sep 30; 18(10). pii: E2079
45. Bennett CL, Price DK, Kim S. et al. Racial variation in cag repeat lengths within the androgen receptor gene among prostate cancer patients of lower socioeconomic status. J Clin Oncol. 2002;20(17):3599-3604
46. Powell IJ, Land SJ, Dey J. et al. The impact of cag repeats in exon 1 of the androgen receptor on disease progression after prostatectomy. Cancer. 2005;103(3):528-537
47. Kim HS, Moreira DM, Jayachandran J. et al. Prostate biopsies from black men express higher levels of aggressive disease biomarkers than prostate biopsies from white men. Prostate Cancer Prostatic Dis. 2011;14(3):262-265
48. Stark TW, Hensley PJ, Spear A. et al. Predictive value of epithelial-mesenchymal-transition (emt) signature and parp-1 in prostate cancer radioresistance. Prostate. 2017;77(16):1583-1591
49. Ren R, Koti M, Hamilton T. et al. A primer on tumour immunology and prostate cancer immunotherapy. Can Urol Assoc J. 2016;10(1-2):60-65
50. Schlom J. Therapeutic cancer vaccines: Current status and moving forward. J Natl Cancer Inst. 2012;104(8):599-613
51. Drake CG. Prostate cancer as a model for tumour immunotherapy. Nature reviews. Immunology. 2010;10(8):580-593
52. Noguchi M, Koga N, Moriya F, Itoh K. Immunotherapy in prostate cancer: Challenges and opportunities. Immunotherapy. 2016;8(1):69-77
53. Kantoff PW, Higano CS, Shore ND. et al. Sipuleucel-t immunotherapy for castration-resistant prostate cancer. N Engl J Med. 2010;363(5):411-422
54. Huber ML, Haynes L, Parker C, Iversen P. Interdisciplinary critique of sipuleucel-t as immunotherapy in castration-resistant prostate cancer. J Natl Cancer Inst. 2012;104(4):273-279
55. Higano CS, Small EJ, Schellhammer P. et al. Sipuleucel-t. Nat Rev Drug Discov. 2010;9(7):513-514
56. Gulley JL, Mulders P, Albers P. et al. Perspectives on sipuleucel-t: Its role in the prostate cancer treatment paradigm. Oncoimmunology. 2016 Dec 10; 5(4): e1107698
57. Maia MC, Hansen AR. A comprehensive review of immunotherapies in prostate cancer. Crit Rev Oncol Hematol. 2017;113:292-303
58. Galon J, Pages F, Marincola FM. et al. Cancer classification using the immunoscore: A worldwide task force. Journal of Translational Medicine. 2012 Oct 3; 10: 205
59. Myers L, Sirois MJ. Spearman correlation coefficients, differences between. Encyclopedia of statistical sciences. Chichester, West Sussex, UK: John Wiley & Sons, Inc. 2004
60. Droeser RA, Hirt C, Viehl CT. et al. Clinical impact of programmed cell death ligand 1 expression in colorectal cancer. Eur J Cancer. 2013Jun;49(9):2233-42
61. Galon J, Mlecnik B, Bindea G. et al. Towards the introduction of the 'immunoscore' in the classification of malignant tumours. J Pathol. 2014;232(2):199-209
62. Galon J, Mlecnik B, Marliot F. et al. Abstract 3500: Validation of the immunoscore (IM) as a prognostic marker in stage I/II/III colon cancer: Results of a worldwide consortium-based analysis of 1,336 patients. Journal of Clinical Oncology. 2016;34(15):3500
63. Mlecnik B, Tosolini M, Kirilovsky A. et al. Histopathologic-based prognostic factors of colorectal cancers are associated with the state of the local immune reaction. J Clin Oncol. 2011;29(6):610-618
64. Santoiemma PP, Reyes C, Wang LP. et al. Systematic evaluation of multiple immune markers reveals prognostic factors in ovarian cancer. Gynecol Oncol. 2016;143(1):120-127
65. Bronte V, Kasic T, Gri G. et al. Boosting antitumor responses of T lymphocytes infiltrating human prostate cancers. J Exp Med. 2005;201(8):1257-1268
66. Galon J, Pagès F, Marincola FM, Thurin M, Trinchieri G, Fox BA, Gajewski TF, Ascierto PA. The immune score as a new possible approach for the classification of cancer. J Transl Med. 2012Jan3;10:1
67. Galon J, Pagès F, Marincola FM. et al. Cancer classification using the Immunoscore: a worldwide task force. J Transl Med. 2012Oct3;10:205
68. Ascierto PA, Capone M, Urba WJ, Bifulco CB, Botti G, Lugli A, Marincola FM, Ciliberto G, Galon J, Fox BA. The additional facet of immunoscore: immunoprofiling as a possible predictive tool for cancer treatment. J Transl Med. 2013Mar3;11:54
69. Galon J, Mlecnik B, Bindea G. et al. Towards the introduction of the 'Immunoscore' in the classification of malignant tumours. J Pathol. 2014Jan;232(2):199-209
70. Mlecnik B, Bindea G, Angell HK. et al. Integrative Analyses of Colorectal Cancer Show Immunoscore Is a Stronger Predictor of Patient Survival Than Microsatellite Instability. Immunity. 2016Mar15;44(3):698-711
Author contact
![]() Corresponding author: Timothy J. Wallace, M.D., Ph.D., Bon Secours Cancer Institute, Richmond, Virginia, U.S.A. Phone: (804) 651-0452; Email: timothy_wallaceorg
Corresponding author: Timothy J. Wallace, M.D., Ph.D., Bon Secours Cancer Institute, Richmond, Virginia, U.S.A. Phone: (804) 651-0452; Email: timothy_wallaceorg