Journal of Cancer
ISSN: 1837-9664
3.2
Impact Factor
ISSN: 1837-9664

 Global reach, higher impact
J Cancer 2018; 9(8):1414-1420. doi:10.7150/jca.23685 This issue Cite
Research Paper
LncRNA PCAT1 and its genetic variant rs1902432 are associated with prostate cancer risk
Qinbo Yuan1,2,3,4,†, Haiyan Chu1,2,†, Yuqiu Ge1,2,†, Gaoxiang Ma1,2, Mulong Du1,2, Meilin Wang1,2, Zhengdong Zhang1,2, ![]() , Wei Zhang4,
, Wei Zhang4, ![]()
1. Department of Environmental Genomics, Jiangsu Key Laboratory of Cancer Biomarkers, Prevention and Treatment, Collaborative Innovation Center For Cancer Personalized Medicine, Nanjing Medical University, Nanjing, China
2. Department of Genetic Toxicology, The Key Laboratory of Modern Toxicology of Ministry of Education, School of Public Health, Nanjing Medical University, Nanjing, China
3. Department of Urology, Huaiyin Hospital of Huai'an City, Huai'an, China
4. Department of Urology, The First Affiliated Hospital of Nanjing Medical University, Nanjing, China
†These authors contributed equally to this work.
Received 2017-11-6; Accepted 2018-2-26; Published 2018-4-6
Citation:
Yuan Q, Chu H, Ge Y, Ma G, Du M, Wang M, Zhang Z, Zhang W. LncRNA PCAT1 and its genetic variant rs1902432 are associated with prostate cancer risk. J Cancer 2018; 9(8):1414-1420. doi:10.7150/jca.23685. https://www.jcancer.org/v09p1414.htm
Other stylesAbstract
Emerging evidence has showed that lncRNAs and trait-associated loci in lncRNAs play a crucial role in the progression of cancer including prostate cancer (PCa).This study aimed to investigate the molecular mechanisms of lncRNA PCAT1 involved in PCa development and its genetic variant associated with PCa risk. We applied cell proliferation and apoptosis assays to assess the effect of PCAT1 on PCa cell phenotypes. In addition, the genome-wide profiling of gene expression was assessed from three pairs of DU145 cells transfected with PCAT1 overexpression vector or negative control (NC) vector. Furthermore, a case-control study was conducted to explore the associations of four tagging single nucleotide polymorphisms (tagSNPs) and PCa risk in 850 PCa cases and 860 cancer-free controls. Our results showed that lncRNA PCAT1 promoted cell proliferation and inhibited cell apoptosis. Ingenuity pathway analysis (IPA) indicated that dysregulated mRNAs induced by overexpression of PCAT1 were primarily enriched in androgen-independent prostate tumor term and implicated in the disease and functions networks, such as cell death and survival, cell proliferation and gene expression. Besides, rs1902432 in PCAT1 was significantly associated with increased risk of PCa (Additive model: OR = 1.19, P = 0.014; Co-dominant model: CC vs. TT, OR = 1.45, P =0.012; Recessive model: CC vs. TT/CT, OR= 1.34, P = 0.027). This study suggests that PCAT1 may act as an oncogene through promoting cell proliferation and suppressing cell apoptosis in PCa development, and genetic variant in PCAT1 contributes to the susceptibility to PCa.
Keywords: PCAT1, lncRNA, genetic variant, prostate cancer, molecular epidemiology
Introduction
Previous genome-wide association studies (GWASs) have identified more than 100 loci related to prostate cancer (PCa) susceptibility[1]. However, more than 90% of these loci are located in intronic or intergenic regions, whereas others are located in encoding areas[2-4]. In addition, studies have mainly focused on protein-coding genes, but definitive evidence revealed functions of noncoding genes.
Long non-coding RNAs (lncRNAs) are defined as RNAs longer than 200 nucleotides that do not have potential to encode functional proteins. LncRNAs are frequently tissue-specific and have lower expression levels than mRNA[5]. Accumulating evidence has shown that lncRNAs play an important role in the development of diseases. LncRNAs were involved in a variety of cellular and pathological processes such as cis regulation of gene expression, post-transcriptional regulation of mRNA and participation in differentiation of embryonic stem cells[6-8].
Some studies have reported that multiple lncRNAs are often altered in human urologic cancers, including PCa. Chakravartyet al. reported that lncRNA NEAT1 significantly overexpresssed in PCa, and promoted oncogenic growth by regulating the epigenetic signatures of target gene promoters[9]. It is well known that genetic variants located in 8q24 gene desert play an important role in susceptibility of PCa[10]. Recently, Walsh et al. has found that lncRNA prostate cancer-associated transcript 1 (PCAT1) at 8q24 participated in various biological processes in PCa cells. PCAT1 is originally identified as an attractive biomarkers for PCa[11, 12]. Furthermore, it has been reported that upregulation of PCAT1 implicates in cell migration, proliferation and inhibit apoptosis in hepatocellular carcinoma[13]. In addition, dysregulation of PCAT1 has also been reported to be involved in progression of non-small cell lung cancer and bladder cancer[14, 15].
Recent studies have revealed that many GWAS or trait-associated loci are enriched in regulatory regions, including lncRNAs[16-19]. It has been reported that Single Nucleotide Polymorphism (SNP) rs3787016 in an lncRNA region at 19q13 is related with the risk of PCa[20]. Another study found that trait-associated SNP rs6983267 in 8q24 is significantly associated with the expression of lncRNA CARLos-5. Besides, CARLos-5 has a long-range interaction with MYC enhance thus involved in the development of cancer[21]. Investigation of lncRNAs and the corresponding trait-associated SNPs may provide new insights to understand the molecular mechanisms underlying cancer susceptibility and provide valuable biomarkers[22]. In the present study, we found that lncRNA PCAT1 promoted PCa cell proliferation and inhibited cell apoptosis. Ingenuity Pathway Analysis (IPA) revealed that the differentially expressed mRNAs induced by overexpression of PCAT1 were primarily enriched in androgen-independent prostate tumor term and remarkably involved in the top five networks targeting cell proliferation, gene expression and so on. Additionally, tagSNP rs1902432 in PCAT1 is a new risk locus for PCa in a Chinese population.
Methods
Study populations
All subjects were unrelated Han Chinese population. A total of 850 PCa cases and 860 cancer-free controls were recruited from the First Affiliated Hospital of Nanjing Medical University. The cases were diagnosed and histologically confirmed as PCa by at least two pathologists. All cases are not suffering from other tumors and have not taken chemotherapy or radiotherapy. The cancer-free controls were randomly collected from the local hospital in the same geographical region, and matched on sex and age (±5 years) distribution of the PCa cases. All subjects were collected between January 2010 and June 2015 and informed consent at recruitment. A total of 10 ml EDTA blood was obtained from each subject. This study was approved by the institutional review board of Nanjing Medical University.
Construction of reporter plasmids, transient transfections
To detect the effect of PCAT1 stable overexpression on proliferation and apoptosis of PCa cells, the full length of complementary DNA encoding PCAT1 was synthesized and cloned into pEGFP-C1 (GENEray) using the BglII and KpnI restriction sites. The constructs were confirmed by DNA sequencing analysis (Supplementary Fig.1a). The PCa cell, DU145 was transfected with PCAT1 overexpression plasmid using Lipofectamine 2000 transfection reagent (Invitrogen) according to the manufacturer's protocol (Supplementary Fig.1b).
Analysis of cell proliferation and apoptosis
Cells were seeded in 96-well plates after transfection with PCAT1 overexpression plasmid. The proliferation of PCa cells was measured at certain time interval (after 12 h, 24 h, 48 h and 72h of transfection) using Cell Counting Kit-8 (CCK-8; Dojindo, Kumamoto, Japan). The cell proliferation was represented by the absorbance value of each well at 450nm using the Infinite M200 spectrophotometer (Tecan, Switzerland). Each experiment with six replicates was repeated three times. For cell apoptosis analysis, PCa cells was collected and stained with the Annexin V-FITC Apoptosis Detection kit (Invitrogen), and the percentage of apoptotic cells was evaluated by flow cytometry.
Arraystar Human Gene Expression Array
Total RNA was extracted from DU145 PCa cells using TRIzol reagent (Invitrogen, Carlsbad, CA, USA) according to the manufacturer's instructions. The mRNA of three pairs of DU145 cells transfected with PCAT1 overexpression vector or corresponding NC vector was profiled with Arraystar Human Gene Expression Array. The mRNA with a P value ≤ 0.05 and Fold-change ≥ 2.0 is regarded as differentially expressed mRNA.
Ingenuity Pathway Analysis (IPA)
The differentially expressed mRNAs in two experimental groups were uploaded in the Ingenuity Pathway Analysis (IPA) software (Qiagen, Redwood City, CA, USA).
IPA was applied to map the molecular pathways and networks based on the library of canonical pathways[23].The canonical pathway analysis and related diseases and biofunctions analysis were performed to find out a specific pathway or function to be predominant associated with the differentially expressed genes. One sided Fisher exact test was used to assess the significance of altered pathways[24, 25].
SNP selection and genotyping
The location of PCAT1 and its flanking 2000-bp region (3'-UTR and 5'-UTR) was pinpointed to chromosome 8, position 128,092,581 - 128,100,441. Applying the genotyping data of Han Chinese from HapMap database, seven SNPs with an allele frequency of more than 0.05 were obtained. We applied a software, Haploview 3.32 to compute linkage disequilibrium and population haplotype patterns from genotype data[26]. Using Tagger pairwise method and a tagging threshold of r2> 0.8, and four tagSNPs were selected (rs4871771, rs1902432, rs16901904 and rs710886). TaqMan allelic discrimination was applied to detect the genotypes of the four tagSNPs. The call rates for all SNPs were more than 98%. Besides, we random selected 10% of the sample to repeat genotyping results and the concordance rate was 100%.
Statistical analysis
Chi-square (χ2) test was applied to estimate the distribution differences of demographic characteristics between cases and controls. The genotype frequencies of controls were used to calculate Hardy-Weinberg equilibrium (HWE) by goodness-of-fit chi-square test. The CCK8 results were expressed as a mean and standard deviation and Student's t-test was used to evaluate the difference between groups. Odds ratios (ORs) and corresponding 95% confidence intervals (95%CIs) were used to evaluate the association between PCAT1 tagSNPs and PCa risk from unconditional logistic regression analyses. The logistic regression was under four genetic models with adjustments for age and smoking. All statistical analyses were two-sided, and P < 0.05 was considered statistically significant. The analyses were performed using SAS (version 9.2, SAS Institute Ins., Cary, NC, USA).
Results
PCAT1 promoted prostate cancer cell proliferation
We assessed the effect of overexpression of PCAT1 on cell proliferation in PCa cell DU145. Compared with NC vector, the expression of PCAT1 was predominant higher in DU145 transfected with PCAT1 expression vector (Fig.1a), which confirmed the overexpression of PCAT1 induced by PCAT1 expression vector. Furthermore, cell proliferation was measured at 12 h, 24 h, 48 h and 72h after transfection using CCK8 assays. As shown in Fig.1b, overexpression of PCAT1 in PCa cell DU145 substantially increased the rate of cell proliferation, especially at 24h or later after transfection, although the effect was not observed at 12h after transfection.
PCAT1 inhibits prostate cancer cell apoptosis
To explore the effect of overexpression of PCAT1 on cell apoptosis, we conducted flow cytometry with the DU145 cell transfected with PCAT1 expression vector or NC vector. The results showed that overexpreesion of PCAT1 significantly inhibited DU145 cell apoptosis compared with NC vector (Fig.1c). The quantifications of cell apoptosis are shown in Fig.1d. Overexpression of PCAT1 had a remarkable effect on the cell apoptosis, suggesting PCAT1 may play a tumor-promoting role in the PCa cell.
Identification of differentially expressed mRNA
Arraystar Human Gene Expression Array was conducted to assess the genome-wide profiling of gene expression from PCa cell DU145 transfected with PCAT1 overexpression vector or NC vector. As shown in Supplementary Fig.2a, the heat map diagram depicted a differential gene expression pattern between overexpression of PCAT1 and NC vector. The volcano plot displayed the differentially expressed genes by comparison of two treatment groups. The red dot indicated significantly upregulated genes whereas, the green dot meant significant downregulated gene in response to overexpression of PCAT1 (Supplementary Fig.2b). In addition, the Supplementary Fig.3 showed the top KEGG pathways of differentially expressed genes and the VEGF signaling pathway was the most enrichment pathway.
Functional enrichment analysis of differentially expressed mRNA
The differentially expressed mRNAs in two experimental groups were uploaded in the IPA software to identify the implicated pathways and functional networks. As shown in Table 1, IPA results revealed the top five significantly enriched Disease and Biofunctions based on differentially expressed genes. Of the top five function categories, the most significant term was the androgen-independent prostate tumor (P = 4.56×10⁻⁵). Furthermore, molecular networks were applied to predict the interactions of the differentially expressed genes based on IPA molecular database. In this study, we found five enriched molecular networks, which principally related to cell death and survival, cell proliferation and gene expression (Table 2).
Table 1
The top five significantly enriched Disease and BioFunctions based on differentially expressed genes
| Categories | Diseases or functions annotation | P-value | Molecules |
|---|---|---|---|
| Cancer, Organismal Injury and Abnormalities, Reproductive System Disease | Androgen-independent prostate tumor | 4.56E-05 | 5 |
| Gene Expression | Transcription | 6.04E-05 | 138 |
| Cellular Development, Hematological System Development and Function | Differentiation of blood cells | 1.03E-04 | 35 |
| Gene Expression | Expression of RNA | 1.28E-04 | 144 |
| Infectious Diseases | Infection of cells | 1.48E-04 | 81 |
Table 2
The top five networks for interactions between differentially expression genes
| ID | Top Diseases and Functions | Score | Focus Molecules |
|---|---|---|---|
| 1 | Cell Death and Survival, Hematological Disease, Immunological Disease | 128 | 119 |
| 2 | DNA Replication, Recombination, and Repair, Cell Cycle, Cellular Growth and Proliferation | 46 | 68 |
| 3 | Gene Expression, Cellular Development, Hematological System Development and Function | 44 | 66 |
| 4 | Cell Death and Survival, Cellular Growth and Proliferation, DNA Replication, Recombination, and Repair | 37 | 60 |
| 5 | Cell Death and Survival, Cellular Movement, Cellular Development | 36 | 59 |
Fig 1
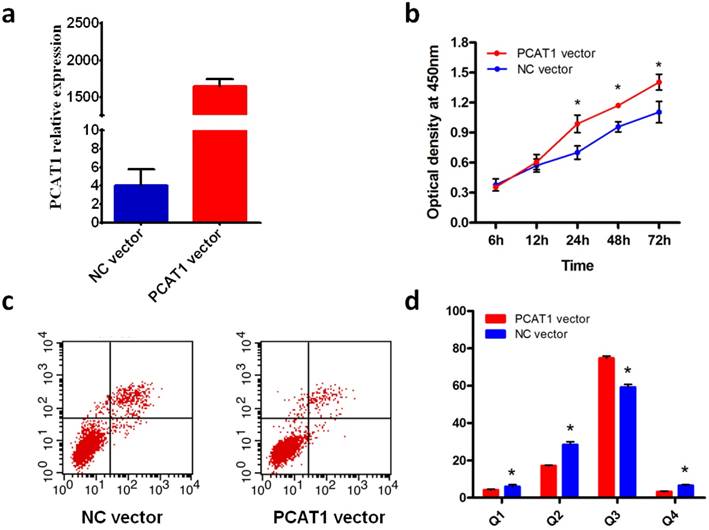
PCAT1 promote DU145 PCa cell proliferation and inhibits apoptosis. (a) Overexpression of PCAT1. DU145 cells were transfected with PCAT1 expression vector or NC vector. (b) PCAT1 promote DU145 cell proliferation. Cell proliferation was measured at 12, 24, 48,72h after transfection using CCK-8 assays. Results are shown as mean ± SD of three experiments. (c) PCAT1 inhibits cell apoptosis of PCa cell DU145. (d) Quantification of apoptosis rate of DU145 cell from c.
PCAT1 rs1902432 is associated with PCa susceptibility in Chinese
Given the important role of PCAT1 in the PCa, we investigated the associations between tagSNPs in PCAT1 and PCa risk. The demographic and clinical characteristics of PCa patients and controls are shown in Table 3. Totally, 850 cases and 860 controls were included in our study. There were no significant differences in age and drinking status between case and control groups. However, more individuals with smoking and family history distributed in cases than that in controls (both P< 0.05), indicating that family history and smoking play important roles in the carcinogenesis of PCa. As shown in Supplementary Table 1, we selected four tagSNPs (rs16901904, rs710886, rs1902432 and rs4871771), which captured all common SNPs in PCAT1. Of the four tagSNPs, three SNPs showed no significant deviation from HWE (P = 0.485 for rs710866, P = 0.753 for rs1902423, and P = 0.316 for rs4871771, respectively). However, SNP rs16901904 was deviated from HWE (P< 0.05). The logistic regression results of these four tagSNPs are presented in Table 4. In the additive model, only rs1902423 was remarkably associated with PCa risk (OR = 1.19, 95% CI = 1.04-1.37, P =0.014). The other three SNPs showed no significant relationships to the risk of PCa (all P > 0.05). In addition, we evaluated the association between rs1902432 polymorphism and risk of PCa in other genetic models. As shown in Table 5, rs1902432 T > C was predominant associated with increased the risk of PCa in co-dominant model (CC vs. TT, OR = 1.45, 95%CI = 1.09 -1.94, P =0.012) and in recessive model (CC vs. TT/CT, OR= 1.34, 95%CI = 1.03 -1.73, P = 0.027). To sum up, individual carrying rs1902432 CC genotype was significant associated with increased the risk of PCa compared with those with TT/CT genotype.
Table 3
Demographic and clinical characteristics of PCa patients and control subjects
| Variables | Cases (n = 850) | Controls (n = 860) | P |
|---|---|---|---|
| Age (mean ± SD) | 71.1± 8.3 | 70.8± 7.0 | 0.411 |
| Smoking status | |||
| No | 388 (45.9%) | 435 (50.9%) | 0.039 |
| Yes | 458 (54.1%) | 420 (49.1%) | |
| Drinking status | |||
| Never | 615 (73.2%) | 654 (76.7%) | 0.101 |
| Ever | 225 (26.8%) | 199 (23.3%) | |
| Family history of cancer | |||
| No | 670 (78.9%) | 769 (89.9%) | < 0.001 |
| Yes | 179 (21.1%) | 86 (10.1%) | |
| Gleason score | |||
| <7 | 325 (38.3%) | ||
| 7 | 255 (30.1%) | ||
| >7 | 268 (31.6%) | ||
| PSA (ng/ml) | |||
| ≤20 | 361 (42.6%) | ||
| >20 | 487 (57.4%) |
Table 4
Associations between four tagSNPs in PCAT1 and PCa risk
| SNP | Cases | Controls | MAFa | OR(95%CI)b | P |
|---|---|---|---|---|---|
| rs16901904 | TT/CT/CC | TT/CT/CC | |||
| 564/234/41 | 563/226/71 | 0.188/0.214 | 0.88(0.75-1.03) | 0.102 | |
| rs710886 | AA/AG/GG | AA/AG/GG | |||
| 208/421/212 | 219/439/200 | 0.498/0.489 | 1.06 (0.93-1.22) | 0.389 | |
| rs1902432 | TT/CT/CC | TT/CT/CC | |||
| 266/423/159 | 308/414/133 | 0.437/0.398 | 1.19(1.04-1.37) | 0.014 | |
| rs4871771 | TT/AT/AA | TT/AT/AA | |||
| 300/391/154 | 282/406/168 | 0.414/0.433 | 0.91(0.80-1.05) | 0.195 |
a MAF (minor allele frequency) between cases and controls.
b Logistic regression analysis with adjustment for age and smoking.
Table 5
The association between rs1902432 and the risk of PCa in four genetic models
| Genetic models | Genotypes | N(cases/controls) | Crude OR(95% CI) | Adjusted OR(95% CI)a | Pa |
|---|---|---|---|---|---|
| Additive | TT | 266/308 | 1.18 (1.03-1.35) | 1.19 (1.04-1.37) | 0.014 |
| CT | 423/414 | ||||
| CC | 159/133 | ||||
| Co-dominant | TT | 266/308 | 1.00 | 1.00 | |
| CT | 423/414 | 1.18(0.96-1.46) | 1.15(0.92-1.43) | 0.227 | |
| CC | 159/133 | 1.38(1.04-1.84) | 1.45(1.09-1.94) | 0.012 | |
| Dominant | TT | 266/308 | 1.00 | 1.00 | |
| CT/CC | 582/547 | 1.23(1.01-1.51) | 1.22(0.99-1.50) | 0.062 | |
| Recessive | TT/CT | 689/722 | 1.00 | 1.00 | |
| CC | 159/133 | 1.25(0.97-1.61) | 1.34(1.03-1.73) | 0.027 |
a Logistic regression analysis with adjustment for age and smoking
Discussion
In recent years, GWASs for PCa have identified multiple risk loci, however little is known of if the SNPs themselves increased disease risk and the molecular mechanism involved in PCa[2]. The majority of GWAS or trait-associated loci are located in non-coding regions, especially 8q24 gene desert region[27, 28]. There are a variety of susceptibility loci upstream of the oncogene MYC in the 8q24 region[29, 30].To data, the molecular functions of the variations in this region have not fully explored. One recent study indicated that lncRNAs originated from 8q24 locus play important roles in MYC regulation[31].
Another study revealed that rs7463708, a SNP located in the 8q24 region, modulated activity of the enhance of lncRNA PCAT1, which interacts with androgen receptor (AR) and lysine-specific demethylase 1 (LSD1) to promote PCa cell growth[19]. Emerging evidence has highlighted the need for further studies of the molecular mechanism of lncRNAs and its genetic variations underlying the development of cancers.
In this study, we have explored the effect of lncRNA PCAT1 on PCa cell phenotypes and the associations between tagSNPs in PCAT1 and the risk of PCa. The results showed that PCAT1 can promote PCa cell proliferation and inhibit cell apoptosis. Overexpression of PCAT1 contributed to multiple differentially expressed mRNA, which were mainly enriched in androgen-independent prostate tumor term and involved in the disease and functions networks, such as cell death and survival, cell proliferation and gene expression. In addition, rs1902432 is significantly associated with the risk of PCa.
Prensner et al. firstly identified that PCAT1 is a novel lncRNA implicated in PCa progression through transcriptome sequencing. They discovered that prostate-specific ncRNA PCAT1 may contribute to cell proliferation in PCa[12]. In the current study, we observed that overexpression of PCAT1 was remarkably increased the rate of cell proliferation in PCa cell DU145. Besides, compared with NC vector, the overexpression of PCAT1 significantly inhibited cell apoptosis. Furthermore, IPA indicated that compared with NC vector, the differential expressed genes with the treatment of overexpression of PCAT1 were most significantly enriched in androgen-independent prostate tumor term, which strengthened that dysregulated PCAT1 play a key role in the progression of PCa. Interestingly, One recent study reported that PCAT1 interacts with androgen receptor (AR) and lysine-specific demethylase 1 (LSD1) to promote PCa cell growth[19]. Besides, KEGG pathway results indicated that most significant pathway was VEGF signaling pathway, which involved in proliferation and migration of vascular endothelial cells and play a key role in tumorigenesis, including tumor initiation and function of cancer stem cells[32]. In line with the KEGG pathway results, our IPA molecular networks analysis results demonstrated that the significant five networks primarily implicated in cell death, cell proliferation and gene expression. Taken together, these results support a key role for PCAT1 in PCa, suggesting that PCAT1 may participate in tumorigenesis through regulating cell proliferation and apoptosis.
Although the effect of PCAT1 on cell phenotype of multiple cancers was widely investigated, the association between polymorphisms in PCAT1 and risk of PCa have not fully explored. One recent study has reported that three variants locate within or near several PCa associated lncRNA, including PCAT1, PCAT2, PRNCR1 were predominant associated with PCa susceptibility[33].We selected four tagSNPs, which captured all common SNPs in PCAT1, and evaluated the associations of these SNPs and the risk of PCa. We identified rs1902432 T > C in lncRNA PCAT1 is a new susceptibility locus to PCa in Han Chinese. Significant associations between rs1902432 and PCa risk were observed in additive, co-dominant and recessive models, suggesting that rs1902432 CC genotype was associated with a significantly increased incidence of PCa. To data, there have no reports about the association of PCAT1 polymorphism rs1902432 and the risk of diseases. Bioinformatic analyses demonstrated that rs1902432 could alter the affinity motifs to transcription factor binding (GR_known8, Nkx2_5, Nkx3_4 and Pou3f2_1). These results indicated that rs1902432 might involve in transcription regulation. Taken the importance of polymorphisms in lncRNA, examination the functional role of rs1902432 in PCa in the further studies wound be warranted.
There are several strengths and novelties in the present study. Firstly, the mechanisms and clinical implication of lncRNA PCAT1 were widely investigated in multiple cancers, but limited evidence is available of the associations between the genetic polymorphisms in PCAT1 and cancer risk. We found that rs1902432 T > C in PCAT1 was a novel risk locus for genetic predisposition to PCa in a case-control study. Furthermore, Gene Expression Array and IPA results systematically pinpointed the crucially altered pathways induced by overexpression of PCAT1, suggesting the underlying mechanism of PCAT1 in the carcinogenesis of PCa. Meanwhile, this study has some limitations. For example, the sample size in our study is relatively small, large well-designed studies in other independent populations are needed in the further study. Besides, whether rs1902432 has an eQTL effect on PCAT1 was also need to investigate in the future study.
In conclusion, PCAT1 may act as an oncogene in PCa through promoting cell proliferation and suppressing cell apoptosis. Furthermore, the genetic variation rs1902432 was significantly implicated in susceptibility to PCa, which should be noteworthy for further functional analysis in the carcinogenesis of PCa.
Supplementary Material
Supplementary figures and tables.
Acknowledgements
This study was partly supported by grants from Jiangsu Provincial Science and Technology Innovation Team, Collaborative Innovation Center For Cancer Personalized Medicine, and the Priority Academic Program Development of Jiangsu Higher Education Institutions (Public Health and Preventive Medicine).
Competing Interests
The authors have declared that no competing interest exists.
References
1. Wang M, Takahashi A, Liu F, Ye D, Ding Q, Qin C. et al. Large-scale association analysis in Asians identifies new susceptibility loci for prostate cancer. Nat Commun. 2015;6:8469
2. Pennisi E. The Biology of Genomes. Disease risk links to gene regulation. Science. 2011;332:1031
3. Zhang X, Bailey SD, Lupien M. Laying a solid foundation for Manhattan-'setting the functional basis for the post-GWAS era'. Trends Genet. 2014;30:140-9
4. Maurano MT, Humbert R, Rynes E, Thurman RE, Haugen E, Wang H. et al. Systematic localization of common disease-associated variation in regulatory DNA. Science. 2012;337:1190-5
5. Ulitsky I. Evolution to the rescue: using comparative genomics to understand long non-coding RNAs. Nat Rev Genet. 2016;17:601-14
6. Ulitsky I, Bartel DP. lincRNAs: genomics, evolution, and mechanisms. Cell. 2013;154:26-46
7. Prensner JR, Chinnaiyan AM. The emergence of lncRNAs in cancer biology. Cancer Discov. 2011;1:391-407
8. Guttman M, Donaghey J, Carey BW, Garber M, Grenier JK, Munson G. et al. lincRNAs act in the circuitry controlling pluripotency and differentiation. Nature. 2011;477:295-300
9. Chakravarty D, Sboner A, Nair SS, Giannopoulou E, Li R, Hennig S. et al. The oestrogen receptor alpha-regulated lncRNA NEAT1 is a critical modulator of prostate cancer. Nat Commun. 2014;5:5383
10. Al Olama AA, Kote-Jarai Z, Giles GG, Guy M, Morrison J, Severi G. et al. Multiple loci on 8q24 associated with prostate cancer susceptibility. Nat Genet. 2009;41:1058-60
11. Walsh AL, Tuzova AV, Bolton EM, Lynch TH, Perry AS. Long noncoding RNAs and prostate carcinogenesis: the missing 'linc'? Trends Mol Med. 2014;20:428-36
12. Prensner JR, Iyer MK, Balbin OA, Dhanasekaran SM, Cao Q, Brenner JC. et al. Transcriptome sequencing across a prostate cancer cohort identifies PCAT-1, an unannotated lincRNA implicated in disease progression. Nat Biotechnol. 2011;29:742-9
13. Wen J, Xu J, Sun Q, Xing C, Yin W. Upregulation of long non coding RNA PCAT-1 contributes to cell proliferation, migration and apoptosis in hepatocellular carcinoma. Mol Med Rep. 2016;13:4481-6
14. Zhao B, Hou X, Zhan H. Long non-coding RNA PCAT-1 over-expression promotes proliferation and metastasis in non-small cell lung cancer cells. Int J Clin Exp Med. 2015;8:18482-7
15. Liu L, Liu Y, Zhuang C, Xu W, Fu X, Lv Z. et al. Inducing cell growth arrest and apoptosis by silencing long non-coding RNA PCAT-1 in human bladder cancer. Tumour Biol. 2015;36:7685-9
16. Childs EJ, Mocci E, Campa D, Bracci PM, Gallinger S, Goggins M. et al. Common variation at 2p13.3, 3q29, 7p13 and 17q25.1 associated with susceptibility to pancreatic cancer. Nat Genet. 2015;47:911-6
17. Guffanti G, Galea S, Yan L, Roberts AL, Solovieff N, Aiello AE. et al. Genome-wide association study implicates a novel RNA gene, the lincRNA AC068718.1, as a risk factor for post-traumatic stress disorder in women. Psychoneuroendocrinology. 2013;38:3029-38
18. Zheng J, Huang X, Tan W, Yu D, Du Z, Chang J. et al. Pancreatic cancer risk variant in LINC00673 creates a miR-1231 binding site and interferes with PTPN11 degradation. Nat Genet. 2016;48:747-57
19. Guo H, Ahmed M, Zhang F, Yao CQ, Li S, Liang Y. et al. Modulation of long noncoding RNAs by risk SNPs underlying genetic predispositions to prostate cancer. Nat Genet. 2016;48:1142-50
20. Jin G, Sun J, Isaacs SD, Wiley KE, Kim ST, Chu LW. et al. Human polymorphisms at long non-coding RNAs (lncRNAs) and association with prostate cancer risk. Carcinogenesis. 2011;32:1655-9
21. Kim T, Cui R, Jeon YJ, Lee JH, Sim H, Park JK. et al. Long-range interaction and correlation between MYC enhancer and oncogenic long noncoding RNA CARLo-5. Proc Natl Acad Sci U S A. 2014;111:4173-8
22. Iyer MK, Niknafs YS, Malik R, Singhal U, Sahu A, Hosono Y. et al. The landscape of long noncoding RNAs in the human transcriptome. Nat Genet. 2015;47:199-208
23. Hamada S, Masamune A, Kanno A, Shimosegawa T. Comprehensive Analysis of Serum microRNAs in Autoimmune Pancreatitis. Digestion. 2015;91:263-71
24. Guo CC, Dadhania V, Zhang L, Majewski T, Bondaruk J, Sykulski M. et al. Gene Expression Profile of the Clinically Aggressive Micropapillary Variant of Bladder Cancer. Eur Urol. 2016
25. Roychowdhury A, Samadder S, Das P, Mandloi S, Addya S, Chakraborty C. et al. Integrative genomic and network analysis identified novel genes associated with the development of advanced cervical squamous cell carcinoma. Biochim Biophys Acta. 2016;1861:2899-911
26. Barrett JC, Fry B, Maller J, Daly MJ. Haploview: analysis and visualization of LD and haplotype maps. Bioinformatics. 2005;21:263-5
27. Panagiotou OA, Travis RC, Campa D, Berndt SI, Lindstrom S, Kraft P. et al. A genome-wide pleiotropy scan for prostate cancer risk. Eur Urol. 2015;67:649-57
28. Huppi K, Pitt JJ, Wahlberg BM, Caplen NJ. The 8q24 gene desert: an oasis of non-coding transcriptional activity. Front Genet. 2012;3:69
29. Ghoussaini M, Song H, Koessler T, Al Olama AA, Kote-Jarai Z, Driver KE. et al. Multiple loci with different cancer specificities within the 8q24 gene desert. J Natl Cancer Inst. 2008;100:962-6
30. Meyer KB, Maia AT, O'Reilly M, Ghoussaini M, Prathalingam R, Porter-Gill P. et al. A functional variant at a prostate cancer predisposition locus at 8q24 is associated with PVT1 expression. PLoS Genet. 2011;7:e1002165
31. Xiang JF, Yang L, Chen LL. The long noncoding RNA regulation at the MYC locus. Curr Opin Genet Dev. 2015;33:41-8
32. Goel HL, Mercurio AM. VEGF targets the tumour cell. Nat Rev Cancer. 2013;13:871-82
33. Han Y, Rand KA, Hazelett DJ, Ingles SA, Kittles RA, Strom SS. et al. Prostate Cancer Susceptibility in Men of African Ancestry at 8q24. J Natl Cancer Inst. 2016:108
Author contact
![]() Corresponding author: Zhengdong Zhang, Department of Environmental Genomics, School of Public Health, Nanjing Medical University, 101 Longmian Avenue, Jiangning District, Nanjing 211166, Nanjing, China. Tel: +86-25-8686-8423, Fax: +86-25-8686-8499, e-mail: drzdzhangcom or Wei Zhang, Department of Urology, The First Affiliated Hospital of Nanjing Medical University, Nanjing, China. Tel: +86-25-6813-6823, Fax: +86-25-8378-0079, e-mail: zhangweiedu.cn
Corresponding author: Zhengdong Zhang, Department of Environmental Genomics, School of Public Health, Nanjing Medical University, 101 Longmian Avenue, Jiangning District, Nanjing 211166, Nanjing, China. Tel: +86-25-8686-8423, Fax: +86-25-8686-8499, e-mail: drzdzhangcom or Wei Zhang, Department of Urology, The First Affiliated Hospital of Nanjing Medical University, Nanjing, China. Tel: +86-25-6813-6823, Fax: +86-25-8378-0079, e-mail: zhangweiedu.cn
Citation styles
APA
Yuan, Q., Chu, H., Ge, Y., Ma, G., Du, M., Wang, M., Zhang, Z., Zhang, W. (2018). LncRNA PCAT1 and its genetic variant rs1902432 are associated with prostate cancer risk. Journal of Cancer, 9(8), 1414-1420. https://doi.org/10.7150/jca.23685.
ACS
Yuan, Q.; Chu, H.; Ge, Y.; Ma, G.; Du, M.; Wang, M.; Zhang, Z.; Zhang, W. LncRNA PCAT1 and its genetic variant rs1902432 are associated with prostate cancer risk. J. Cancer 2018, 9 (8), 1414-1420. DOI: 10.7150/jca.23685.
NLM
Yuan Q, Chu H, Ge Y, Ma G, Du M, Wang M, Zhang Z, Zhang W. LncRNA PCAT1 and its genetic variant rs1902432 are associated with prostate cancer risk. J Cancer 2018; 9(8):1414-1420. doi:10.7150/jca.23685. https://www.jcancer.org/v09p1414.htm
CSE
Yuan Q, Chu H, Ge Y, Ma G, Du M, Wang M, Zhang Z, Zhang W. 2018. LncRNA PCAT1 and its genetic variant rs1902432 are associated with prostate cancer risk. J Cancer. 9(8):1414-1420.
This is an open access article distributed under the terms of the Creative Commons Attribution (CC BY-NC) license (https://creativecommons.org/licenses/by-nc/4.0/). See http://ivyspring.com/terms for full terms and conditions.