Journal of Cancer
ISSN: 1837-9664
3.2
Impact Factor
ISSN: 1837-9664

 Global reach, higher impact
J Cancer 2018; 9(7):1231-1238. doi:10.7150/jca.23714 This issue Cite
Research Paper
Prognostic Value of Bone Marrow FDG Uptake Pattern of PET/CT in Newly Diagnosed Diffuse Large B-cell Lymphoma
Yumei Chen1*, Mingge Zhou1*, Jianjun Liu1 ![]() , Gang Huang1,2,3
, Gang Huang1,2,3 ![]()
1. Department of Nuclear Medicine, Ren Ji Hospital, School of Medicine, Shanghai Jiao Tong University, Shanghai, China
2. Department of Cancer Metabolism, Institute of Health Sciences, Chinese Academy of Sciences and Shanghai Jiao Tong University School of Medicine, Shanghai, China
3. Key Lab. For Molecular Biology & Imaging, Shanghai University of Medicine and Health Sciences, Shanghai, China
*contributed equally to this work.
Received 2017-11-7; Accepted 2018-2-28; Published 2018-3-14
Citation:
Chen Y, Zhou M, Liu J, Huang G. Prognostic Value of Bone Marrow FDG Uptake Pattern of PET/CT in Newly Diagnosed Diffuse Large B-cell Lymphoma. J Cancer 2018; 9(7):1231-1238. doi:10.7150/jca.23714. https://www.jcancer.org/v09p1231.htm
Other stylesAbstract
Purpose: The value of 18F-fluorodeoxyglucose positron emission tomography /computed tomography (18F-FDG PET/CT) in assessing bone marrow involvement (BMI) of lymphoma remains controversial. The present study aims to evaluate the prognostic meaning of bone marrow FDG uptake pattern in PET/CT of newly diagnosed diffuse large B-cell lymphoma (DLBCL) patients.
Materials and Methods: 193 newly diagnosed DLBCL patients were retrospectively analyzed. All patients received 6-8 cycles of rituximab plus cyclophosphamide, doxorubicin, vincristine and prednisone (R-CHOP). The type of BM FDG uptake pattern was recorded by two blinded reviewers independently. The relationship between clinicopathologic features and BM patterns was analyzed. The prognostic value of different BM patterns was evaluated by Log-rank test and Cox-regression analysis.
Results: Out of 193 patients, 28 (15%) patients had focal BM FDG uptake higher than liver (fPET+), 18 (9%) patients showed diffuse BM uptake higher than liver (dPET+) and 147 (76%) patients had normal BM uptake (lower than liver) (nPET). BMB positive was found in 35.7% (10/28) of fPET+ patients, in 16.7% (3/18) of dPET+ patients and in 0.7% (1/147) of nPET patients. Diffuse BM pattern was associated with lower hemoglobin level and a trend of higher erythrocyte sedimentation rate (ESR). dPET+ patients had similar 3y-progression-free survival (3y-PFS) and 3y-overall survival (3y-OS) compared with nPET patients (80.5% vs 81.5%, p=0.701; 94.1% vs 90.6%, p=0.809, respectively), while fPET+ patients had worse 3y-PFS and 3y-OS compared with fPET- patients (32.7% vs 81.4%, p<0.001; 69.4% vs 90.9%, p=0.003, respectively). Multivariate analysis showed fPET+ (HR=2.270, p=0.025) and stage III/IV (HR=4.909, p=0.026) were independent predictors for PFS, but no factors were independently predictive for OS.
Conclusion: PET/CT-directed BM patterns are meaningful in predicting prognosis of newly diagnosed DLBCL patients. Focal BM pattern is an independent predictor for PFS.
Keywords: DLBCL, PET/CT, bone marrow, FDG uptake pattern, prognosis
Introduction
Diffuse large B-cell lymphoma is the most common type of non-Hodgkin's lymphomas (NHL) and is characterized by a relatively high frequency of extra-nodal spread[1]. Bone marrow involvement is diagnosed in approximately 15% of newly diagnosed DLBCL and accounts for 1 point in the International Prognostic Index (IPI) score.
Bone marrow biopsy (BMB) has been the gold standard for bone marrow evaluation for many decades and is still recommended in the conventional staging of all patients with DLBCL by guidelines[4]. However, BMB is an invasive and painful procedure that has a small but non-negligible risk of complications such as pain, anxiety, hemorrhage and infection[5, 6]. Furthermore, the small sample size from biopsy or the BMI focal status may cause the omission of BMI lesions, which is the main reason for the poor sensitivity of BMB[2].
18F-FDG PET/CT, as a noninvasive whole-body metabolic imaging technique, is now routinely applied in the clinical work-up of DLBCL, especially in staging, restaging as well as prognostic analysis, owing to its ability to accurately evaluate both nodal and extra-nodal disease sites[7-9]. The diagnostic and prognostic value of PET/CT-ascertained BMI remains controversial in the recent retrospective studies[2, 10-14]. The lack of standardized interpretation of diffuse BM pattern could explain the conflicting conclusions. As we all know, focally increased FDG uptake of BM is generally accepted as a sign of BMI, but it is difficult to identify whether the diffuse pattern is BMI. The diffuse BM FDG uptake has been extensively reported to be associated with both malignant infiltration and benign etiologies([15-18]). Up to now, there has been no consensus on the interpretation of diffuse BM pattern in DLBCL. Unlike the previous studies, our large sample, single-center study was designed to determine the prognostic meaning of different BM FDG uptake patterns of PET/CT. In the present study, the focal, diffuse and normal BM uptake patterns in DLBCL were investigated individually instead of simply being interpreted as BMI or non-BMI. To our knowledge, very little was found in the literature about the prognostic value of PET/CT-based BM patterns in DLBCL.
Materials and Methods
Study population and data extraction
The study has been approved by the institutional review board of Ren Ji Hospital Shanghai Jiao Tong University School of Medicine. 193 consecutive patients undergoing pre-therapy staging for newly diagnosed DLBCL in our PET/CT center between January 2007 and June 2016 were retrospectively enrolled in this study. All patients were treated with 6-8 cycles of R-CHOP therapy. Our study exclusion criteria were as follows: patients with transformed lymphoma or coexistence of another lymphoma subtype in the diagnostic biopsy, those who had received hematopoietic growth factor, chemotherapy or glucocorticoids prior to PET/CT imaging, those with time interval between PET/CT and BMB exceeding 30 days. Patient data were recorded in details as follows: age, sex, Ann Arbor stage, International Prognostic Index, presence of B symptoms, extra-nodal involvement. All of them were extracted from medical records. Patient follow-up data were searched to detect presence of disease progression and progression-free survival times. PFS and OS were calculated from diagnosis to disease progression or death from any cause.
18F -FDG PET/CT Acquisition
The study was performed by dedicated PET/CT scanners (2007-2012, GE Discovery LS PET/CT system; after 2012, Siemens Biograph PET/CT system) according to standard protocol. All patients enrolled have received an intravenous injection of 0.1mCi/kg 18F-FDG after fasting for at least 6 hours. The blood glucose level of each patient was strictly confirmed under 150 mg/dL right before the injection. The patients were free to rest on the bed and relax for 45 to 60 min after the FDG administration. Diagnostic-quality unenhanced CT images were acquired before PET data acquisition and were used for attenuation correction in the PET image reconstruction.
Identification of BM uptake patterns by PET/CT
The CT, PET, and fused PET/CT images were reviewed in transaxial, coronal, and sagittal planes along with maximum intensity projection whole-body images. Two experienced nuclear medicine physicians (Chen Y and Liu J) blinded to treatment outcome and other clinical information, analyzed PET/CT images visually and semi-quantitatively with standardized uptake value.
Focal BM uptake was defined as focally increased FDG uptake higher than normal liver FDG uptake (Figure 1A). Diffusely increased FDG uptake was interpreted as diffuse homogenous FDG uptake higher than that of normal liver (Figure 1B). Normal uptake was considered as a mild homogenous uptake lower than that of normal liver (Figure 1C). Structural abnormalities including osteolytic, osteosclerotic lesion, mixed lesions or no abnormalities were observed through CT images.
Figure 1
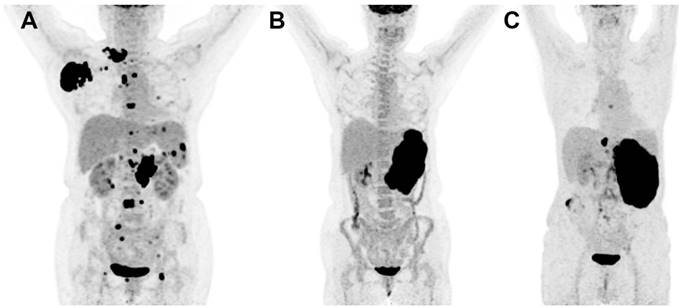
MIP images of focal (A), diffuse (B) and normal (C) FDG uptake patterns of bone marrow in DLBCL.
Bone marrow biopsy
In our hospital, unilateral iliac crest trephine biopsy and marrow aspirate were routinely performed in all newly diagnosed DLBCL patients. All BMBs were performed according to standard procedures and the BMB results were obtained from the pathology reports. BMB material was routinely formalin fixed and paraffin embedded and subsequently evaluated morphologically on the basis of a standard immunohistochemistry, including antibodies to identify CD3, CD79a, and CD20-positive cells.
Data analysis
Differences in clinicopathological factors between groups were analyzed by chi-square test, T test and Wilcoxon test, according to the types of variables. The prognostic significance of the BM uptake patterns was derived by the Kaplan-Meier method and the between groups difference was evaluated by Log-rank test. Cox regression model was used to identify independently predictive variables from clinical, pathologic and imaging variables. The hazard ratio (HR) and its 95%CI were also calculated by Cox-regression model. All the statistical analyses were performed using SPSS, version 20.0 (IBM corporation, NY, USA). Double sided p values <0.05 were considered statistically significant.
Results
Patient characteristics
193 patients newly diagnosed with DLBCL were included in our retrospective study. The median age was 58y (range, 14-87y), and the ratio of male to female was 0.87. According to Ann Arbor Stage, the number of patients in Stage I, II, III and IV were 31 (16.1%), 53 (27.5%), 22(11.4%) and 87 (45%), respectively. After 6-8 cycles of R-CHOP chemotherapy, 159 (82.4%) out of 193 patients achieved complete remission (CR) or partial remission (PR). Detailed baseline clinical characteristics were summarized in Table 1.
Table 1
Baseline clinical characteristics of DLBCL patients
| Patient characteristics (N=193) | No. of patients (%) |
|---|---|
| Age | |
| ≤60y | 99 (51.3) |
| >60y | 94 (48.7) |
| Male Sex | 90 (46.6) |
| Ann Arbor Stage | |
| I | 31 (16.1) |
| II | 53 (27.5) |
| III | 22 (11.4) |
| IV | 87 (45.0) |
| B symptom | 106 (54.9) |
| IPI score | |
| 0-2 | 110 (57) |
| 3-5 | 83 (43) |
| Subtype* | |
| GCB | 45 (23.3) |
| Non-GCB | 95 (49.2) |
*Missing data in 53 patients
Correlations between PET/CT and BMB
We separated the patients into 3 groups according to their BM uptake pattern on baseline PET/CT. 147 (76.2%) patients had normal FDG uptake (nPET) on bone marrow (compared with normal liver). In patients with BM uptake higher than normal liver, 28 (14.5%) patients were presented with focal uptake (fPET+), and 18 (9.3%) patients had diffuse uptake on BM (dPET+). BMB was routinely performed in all the patients. BMB positive was found in 14 (7.3%) out of 193 patients. Of fPET+ and dPET+ patients, BMB positive accounted for 36% (10/28) and 17% (3/18), respectively. For nPET patients, BM involvement assessed by BMB was found only in 1 out of 147 patients. The case contribution of BM involvement assessed by PET/CT BM uptake pattern and BMB is shown in Figure 2. When using both fPET+ and BMB+ as reference standards, the sensitivity, negative predictive value and accuracy of PET/CT and BMB were 87.5%, 97.6% and 97.9% versus 43.8%, 89.9% and 90.7%, respectively. We also analyzed the relationship between different BM uptake patterns and BMB results. fPET+ patients had a larger proportion of positive BMB compared with fPET- (dPET+ or nPET) patients (35.7% vs 2.4%, p<0.001), while dPET+ patients had a relatively higher proportion of positive BMB than dPET- patients without significant difference (16.7% vs 6.3%, p=0.106) (Table 2).
Figure 2
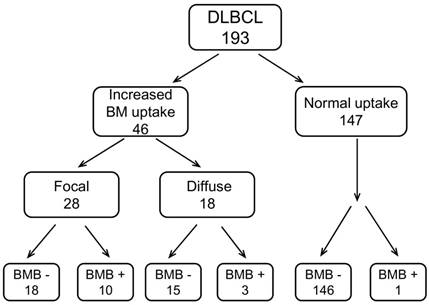
The case contribution of BMI assessed by PET/CT-based BM pattern and BMB
Table 2
Clinical-imaging correlations according to bone marrow uptake patterns
| Characteristics | fPET | dPET | ||||
|---|---|---|---|---|---|---|
| + (N=28) | - (N=165) | p | + (N=18) | - (N=175) | p | |
| BMB+ (%) | 10 (35.7) | 4(2.4) | <0.001 | 3 (16.7) | 11 (6.3) | 0.106 |
| Age (Mean±SD) | 60±13 | 57±15 | 0.336 | 56±14 | 58±15 | 0.553 |
| Male sex (%) | 12 (42.9) | 78 (47.2) | 0.665 | 3 (16.7) | 87 (49.7) | 0.007 |
| IV Stage (%) | 28 (100) | 59 (35.8) | <0.001 | 11 (61.1) | 76 (43.4) | 0.151 |
| B symptoms (%) | 22 (78.5) | 84 (50.9) | 0.007 | 12 (66.7) | 94 (53.7) | 0.293 |
| Progression (%) | 16 (57.1) | 31 (18.8) | <0.001 | 4 (22.2) | 43 (24.6) | 0.825 |
| Death (%) | 7 (25) | 13 (7.9) | 0.006 | 1 (5.6) | 19 (10.9) | 0.482 |
| WBC (×109/L) Median (IQR) | 5.3 (4.5, 7.9) | 5.8 (4.6,7.1) | 0.698 | 5.7 (4.4, 14.2) | 5.8 (4.6, 7.1) | 0.290 |
| Hemoglubin (g/dL) | 110±26 | 120±21 | 0.025 | 105±28 | 120±20.4 | 0.005 |
| ESR (mm/h) Median (IQR) | 29 (12, 67) | 18 (10, 34) | 0.063 | 33 (10, 50) | 19 (11, 34) | 0.097 |
Figure 3
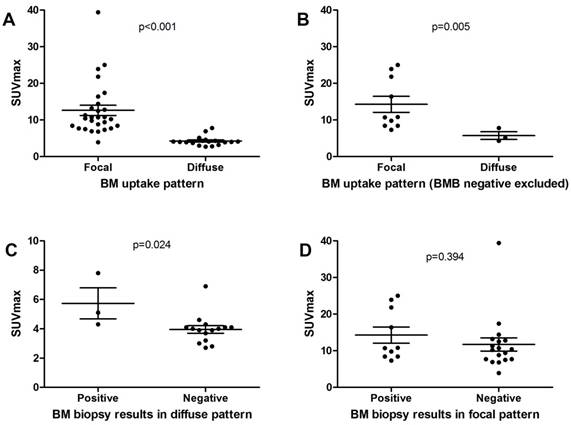
Comparison of SUVmax on BM between different groups.
Figure 4
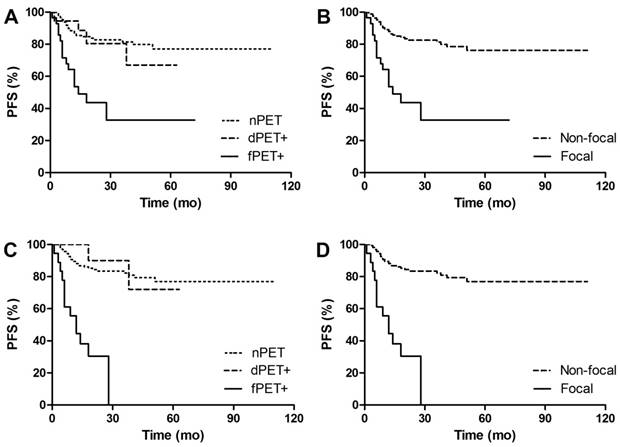
PFS Kaplan Meier Curves of DLBCL patients in groups. A. Comparison of PFS between different BM patterns. 3y-PFS of dPET+ vs nPET was 80.5% vs 81.5%, p=0.701; 3y-PFS of fPET+ vs nPET was 32.7% vs 81.5%, p<0.001. B. Comparison of PFS between focal pattern and non-focal pattern. 3y-PFS of fPET+ vs fPET- was 32.7% vs 81.4%, p<0.001. C. Comparison of PFS between different BM patterns in BMB negative patients. 3y-PFS of dPET+ vs nPET was 90% vs 81.4%, p=0.618; 3y-PFS of fPET+ vs nPET was 0% vs 81.4%, p<0.001. D. Comparison of PFS between focal pattern and non-focal pattern in BMB negative patients. 3y-PFS of fPET+ vs fPET- was 0% vs 82.2%, p<0.001.
Figure 5
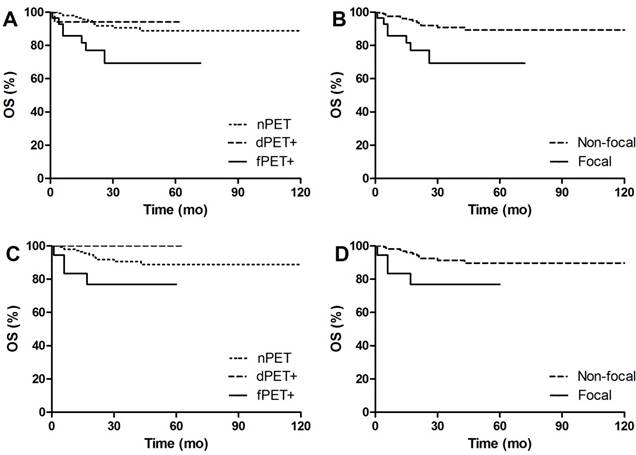
OS Kaplan Meier Curves of DLBCL patients in groups. A. Comparison of OS between different BM patterns. 3y-OS of dPET+ vs nPET was 94.1% vs 90.6%, p=0.809; 3y-OS of fPET+ vs nPET was 69.4% vs 90.6%, p<0.001. B. Comparison of OS between focal pattern and non-focal pattern. 3y-OS of fPET+ vs fPET- was 69.4% vs 90.9%, p=0.003. C. Comparison of OS between different BM patterns in BMB negative patients. 3y-OS of dPET+ vs nPET was 100% vs 90.6%, p=0.300; 3y-OS of fPET+ vs nPET was 76.9% vs 90.6%, p=0.037. D. Comparison of OS between focal pattern and non-focal pattern in BMB negative patients. 3y-OS of fPET+ vs fPET- was 76.9% vs 91.3%, p=0.023.
Characteristics and prognosis in relation to different BM patterns
Table 2 reveals the differences in clinical characteristics between different groups. Compared with fPET- patients, fPET+ patients had higher frequency of B symptoms (p=0.007) and lower level of hemoglobin (p=0.025). dPET+ patients were proved to have lower hemoglobin levels than dPET- patients (p=0.005). Both fPET+ and dPET+ patients tended to have higher ESR level than the overall population (p=0.063 and 0.097, respectively). No differences were found in age and WBC level between groups. We also compared SUVmax of BM in different groups in order to investigate whether BM metabolic status was associated with BM patterns or BMB results (Figure 3). We found fPET+ had higher SUVmax than dPET+ (12.6±7.4 vs 4.3±1.3, p<0.001). SUVmax of fPET+/BMB+ was similar to that of fPET+/BMB- (14.3±6.9 vs 11.7±7.6, p=0.394), but was significantly higher than that of dPET+/BMB+ (14.3±6.9 vs 5.7±1.8, p=0.005). Interestingly, significant difference in SUVmax was also revealed between dPET+/BMB+ and dPET+/BMB- (5.7±1.8 vs 4.0±1.0, p=0.024).
After a median follow-up of 30 (12-124) months, 47 (24%) out of 193 patients had disease progression or relapse, and 20 (10%) patients died. Figure 4-5 shows PFS and OS Kaplan Meier Curves of patients in groups. fPET+ patients had inferior 3y-PFS compared with nPET patients (32.7% vs 81.5%, p<0.001), but dPET+ had similar 3y-PFS to nPET (80.5% vs 81.5%, p=0.701). 3y-PFS of fPET+ and fPET- were 32.7% and 76.2, respectively (p<0.001), while 3y-PFS of BMB+ and BMB- were 60.6% and 81.2%, respectively (p=0.205) (Figure 6A). We further analyzed PFS of different BM patterns in patients with negative BMB. We found a poor 3y-PFS of fPET+/BMB- patients compared with nPET/BMB- and fPET-/BMB- patients (0% vs 81.4%, p<0.001; 0% vs 82.2%, p<0.001), and we found no difference between dPET+/BMB- and nPET/BMB- (90% vs 81.4%, p=0.618). The OS Kaplan Meier Curves also revealed similar results to PFS curves. In univariate analysis, stage III/IV (HR 13.454, p<0.001), B symptoms (HR 3.687, p<0.001), IPI>2 (HR 8.061, p<0.001) and fPET+ (HR 4.428, p<0.001) were significantly related to poor PFS, while stage III/IV (HR 54.711, p=0.030), BMB+ (HR 3.969, p=0.014), IPI>2 (HR 103.927, p=0.015) and fPET+ (HR 3.699, p=0.005) were associated with poor OS. In multivariate analysis of PFS, stage III/IV (HR 4.909, p=0.026) and fPET+ (HR 2.270, p=0.025) were independent predictors. There were no independent predictors in the multivariate analysis of OS (Table 3).
Table 3
Univariate and multivariate analysis of PFS and OS.
| Univariate analysis | PFS | OS | ||
|---|---|---|---|---|
| HR (95% CI) | p | HR (95% CI) | p | |
| Age>60y | 1.319 (0.744-2.338) | 0.343 | 1.540 (0.638-3.720) | 0.337 |
| Stage III/IV | 13.454 (4.176-43.343) | <0.001 | 54.711 (1.463-2046.131) | 0.03 |
| B symptoms | 3.687 (1.783-7.627) | <0.001 | 2.370 (0.861-6.523) | 0.095 |
| IPI score>2 | 8.061 (3.762-17.272) | <0.001 | 103.927 (2.508-4306.619) | 0.015 |
| Non-GCB | 1.035 (0.495-2.164) | 0.928 | 1.095 (0.343-3.496) | 0.878 |
| BMB + | 1.801 (0.712-4.558) | 0.214 | 3.969 (1.324-11.895) | 0.014 |
| fPET + | 4.428 (2.405-8.153) | <0.001 | 3.699 (1.472-9.298) | 0.005 |
| dPET + | 0.870 (0.313-2.429) | 0.792 | 0.574 (0.077-4.287) | 0.588 |
| Multivariate analysis | PFS | OS | ||
| HR (95% CI) | p | HR (95% CI) | p | |
| Stage III/IV | 4.909 (1.206-19.986) | 0.026 | / | / |
| fPET + | 2.270 (1.106-4.658) | 0.025 | / | / |
Figure 6
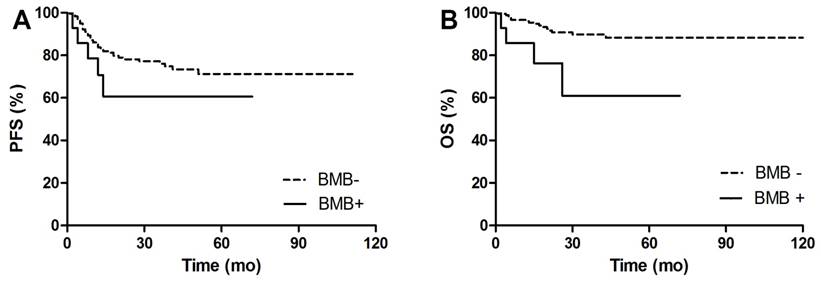
PFS and OS Kaplan Meier Curves between BMB positive and BMB negative patients. A. Comparison of PFS between BMB+ and BMB- patients. 3y-PFS of BMB+ vs BMB- was 60.6% vs 76.1%, p=0.205. B. Comparison of OS between BMB+ and BMB- patients. 3y-OS of BMB+ vs BMB- was 61% vs 89.8%, p=0.008.
Discussions
This retrospective study with large sample from single-center aimed to investigate the prognostic significance of BM assessment in newly diagnosed DLBCL based on FDG uptake pattern from PET/CT imaging compared with BMB.
Our study first gave a detailed description of BM FDG uptake patterns to assess bone marrow status in DLBCL patients. In a series of 193 patients, 28 patients had fPET+ and 18 patients had dPET+ while the other 147 patients had nPET. We found BMB+ was not concordant with fPET+, as BMB+ only accounted for 36% (10/28) of fPET+ patients. Since fPET+ was generally interpreted as BMI, this missing rate of 64% (18/28) questioned the value of the BMB as a single examination for assessing BMI of DLBCL. The small size of the BMB sample and the focal disease of BMI away from the iliac crest are reasonable explanations for this result.
The finding of dPET+ of BM is not rare in DLBCL. In some studies, this kind of BM pattern was interpreted negative for BMI[2], while some other researchers considered it as positive[11, 19, 20]. The disagreement on the interpretation made it difficult to accurately assess the value of dPET+ in DLBCL. In our study, we separated 18 patients with dPET+ as a single group. In dPET+ group, three patients were BMB positive but no one was upstaged by BMB. No significant difference was found in the ratio of BMB positive between dPET+ patients and the overall population. We observed a clear correlation between dPET+ and low hemoglobin level, which suggested that dPET+ was mostly related to reactive myelopoiesis. The fact that ESR level tended to be higher in dPET+ patients than in the overall population implied dPET+ might also be associated with inflammation. Interestingly, the BM SUVmax of dPET+/BMB+ patients was higher than dPET+/BMB- patients but lower than fPET+ patients, which may be attributed to the diffuse but low-density malignant infiltration of BM.
In our study, PET/CT only missed one BMB positive patient out of 147 nPET patients, who had already been staged as stage IV according the PET/CT imaging. It means we must do 147 BMBs to catch only one BMI missed by PET/CT. This may suggest that BMB could be safely omitted in nPET patients, because of extremely high negative predictive value of nPET. A meta-analysis from Adams et al. suggested that BMI cannot be excluded for patients with negative PET findings on BM, because they found that PET/CT can miss BMI in about 3.1% of patients[21]. We think this opinion not appropriate because they didn't mention whether BMB+ upstaged nPET patients and how much patients would benefit from BMB. And the heterogeneity of the nPET reference in their analysis also made the conclusion not convincing enough.
The prognostic value of BMI based on FDG PET/CT is still not demonstrated clearly. Some studies indicated the excellent prognostic value of PET-BMI in DLBCL patients [2, 11, 13, 22], while some studies drew the opposite conclusion [14, 19, 20]. In their studies, the diffuse BM pattern was interpreted differently, thus more or less leading to different conclusions. We have already demonstrated that the diffuse BM pattern was associated with anemia, inflammation or malignant infiltration. It's difficult to accurately identify BMI from the diffuse BM pattern. Liang et al defined the diffuse BM pattern with concomitant disappearance of BM uptake on post-therapy PET as BMI[13]. In our opinion, this definition is not appropriate because post-therapy PET can also exhibit diffuse BM uptake caused by the administration of hematopoietic cytokines and myeloid hyperplasia[15, 23]. So we explored the prognostic value of PET/CT-based BM uptake pattern instead of PET-ascertained BMI. Our results showed fPET+ patients had significant inferior prognosis compared with nPET patients, while 3y-PFS of BMB+ and BMB- didn't exist statistical difference. We further found fPET+ was able to identified the patients with poor prognosis from BMB negative patients (Figure 4C,4D,5C,5D). In multivariate analysis of PFS, only stage III/IV and fPET+ were proved to be independent predictors of PFS. To sum up, the focal pattern of BM is of better prognostic value than BMB. Unlike Chen-Liang 's and Khan's results, we didn't obtain the result that BMB was independently predictive for PFS and OS[14, 19]. We found the BMB+ rate in our study and previous studies differed in a considerable disparity, ranging from 6.0% to16.4%[2, 24]. This heterogeneity may lead to different conclusions on prognostic value of BMB. But fPET+ failed to independently predict OS in the present study. The relatively small number of deaths during follow-up in our study (10.4%, 20/193) may be the main reason for this result. Then we evaluated the prognostic value of dPET+. Although there was a small portion of BMB+ in dPET+ group, no significant difference in patients' survival was found between dPET+ and nPET groups.
In conclusion, 18F- FDG PET/CT could be a reliable tool for evaluating BM status and predicting prognosis in DLBCL patients. Only focal uptake pattern of BM, not diffuse pattern, is an independent predictor of inferior outcomes. Compared with BM pattern assessed by PET/CT, BMB seems to be unnecessary for the management of DLBCL as its low accuracy and limited ability of prognostic prediction. Further efforts should be made to confirm the prognostic value of PET/CT-based BM patterns in prospective and multicenter studies.
Acknowledgements
Supported by the National Natural Science Foundation of China (30830038, 30970842, 81071180, 81571710, 81530053, 81471685, 81471687), the Major State Basic Research Development Program of China (2012CB932604), the New Drug Discovery Project (2012ZX09506-001-00), and the Shanghai Science and Technology Commission, China (Grant No. 17411953200).
Abbreviations
18F-FDG PET/CT: 18F-fluorodeoxyglucose positron emission tomography /computed tomography; DLBCL: diffuse large B-cell lymphoma; BMI: bone marrow involvement; BMB: bone marrow biopsy; PFS: progression-free survival; OS: overall survival; R-CHOP: rituximab, cyclophosphamide, doxorubicin, vincristine and prednisone; ESR: erythrocyte sedimentation rate; NHL: non-Hodgkin's lymphoma; IPI: International Prognostic Index; GCB: germinal center B-cell like; IQR: interquartile range; MIP: maximum intensity projection.
Competing Interests
The authors have declared that no competing interest exists.
References
1. Siegel R, Naishadham D, Jemal A. Cancer statistics, 2013. CA: a cancer journal for clinicians. 2013;63:11-30
2. Berthet L, Cochet A, Kanoun S. et al. In newly diagnosed diffuse large B-cell lymphoma, determination of bone marrow involvement with 18F-FDG PET/CT provides better diagnostic performance and prognostic stratification than does biopsy. Journal of nuclear medicine: official publication, Society of Nuclear Medicine. 2013;54:1244-50
3. Flowers CR, Sinha R, Vose JM. Improving outcomes for patients with diffuse large B-cell lymphoma. CA: a cancer journal for clinicians. 2010;60:393-408
4. Tilly H, Vitolo U, Walewski J. et al. Diffuse large B-cell lymphoma (DLBCL): ESMO Clinical Practice Guidelines for diagnosis, treatment and follow-up. Annals of oncology: official journal of the European Society for Medical Oncology. 2012;23(Suppl 7):vii78-82
5. Bain BJ. Morbidity associated with bone marrow aspiration and trephine biopsy - a review of UK data for 2004. Haematologica. 2006;91:1293-4
6. Brunetti GA, Tendas A, Meloni E. et al. Pain and anxiety associated with bone marrow aspiration and biopsy: a prospective study on 152 Italian patients with hematological malignancies. Annals of hematology. 2011;90:1233-5
7. Barrington SF, Mikhaeel NG, Kostakoglu L. et al. Role of imaging in the staging and response assessment of lymphoma: consensus of the International Conference on Malignant Lymphomas Imaging Working Group. Journal of clinical oncology: official journal of the American Society of Clinical Oncology. 2014;32:3048-58
8. Cheson BD, Fisher RI, Barrington SF. et al. Recommendations for initial evaluation, staging, and response assessment of Hodgkin and non-Hodgkin lymphoma: the Lugano classification. Journal of clinical oncology: official journal of the American Society of Clinical Oncology. 2014;32:3059-68
9. D'Souza M M, Jaimini A, Bansal A. et al. FDG-PET/CT in lymphoma. The Indian journal of radiology & imaging. 2013;23:354-65
10. Adams HJ, Kwee TC, Fijnheer R. et al. Bone marrow 18F-fluoro-2-deoxy-D-glucose positron emission tomography/computed tomography cannot replace bone marrow biopsy in diffuse large B-cell lymphoma. American journal of hematology. 2014;89:726-31
11. Soydal C, Koksoy EB, Yasar A. et al. Prognostic Importance of Bone Marrow Uptake on Baseline 18F-FDG Positron Emission Tomography in Diffuse Large B Cell Lymphoma. Cancer biotherapy & radiopharmaceuticals. 2016;31:361-5
12. El Karak F, Bou-Orm IR, Ghosn M. et al. PET/CT Scanner and Bone Marrow Biopsy in Detection of Bone Marrow Involvement in Diffuse Large B-Cell Lymphoma. PloS one. 2017;12:e0170299
13. Liang JH, Sun J, Wang L. et al. Prognostic significance of bone marrow infiltration detected by PET-CT in newly diagnosed diffuse large B cell lymphoma. Oncotarget. 2016;7:19072-80
14. Khan AB, Barrington SF, Mikhaeel NG. et al. PET-CT staging of DLBCL accurately identifies and provides new insight into the clinical significance of bone marrow involvement. Blood. 2013;122:61
15. Elstrom RL, Tsai DE, Vergilio J-A. et al. Enhanced Marrow [18F]Fluorodeoxyglucose Uptake Related to Myeloid Hyperplasia in Hodgkin's Lymphoma Can Simulate Lymphoma Involvement in Marrow. Clinical Lymphoma. 2004;5:62-4
16. Chiang SB, Rebenstock A, Guan L. et al. Diffuse bone marrow involvement of Hodgkin lymphoma mimics hematopoietic cytokine-mediated FDG uptake on FDG PET imaging. Clinical nuclear medicine. 2003;28:674-6
17. Plantade A, Montravers F, Selle F. et al. Diffusely increased F-18 FDG uptake in bone marrow in a patient with acute anemia and recent erythropoietin therapy. Clinical nuclear medicine. 2003;28:771-2
18. Arimoto MK, Nakamoto Y, Nakatani K. et al. Increased bone marrow uptake of 18F-FDG in leukemia patients: preliminary findings. SpringerPlus. 2015;4:521
19. Chen-Liang TH, Martin-Santos T, Jerez A. et al. Bone marrow biopsy superiority over PET/CT in predicting progression-free survival in a homogeneously-treated cohort of diffuse large B-cell lymphoma. Cancer medicine. 2017
20. Hong J, Lee Y, Park Y. et al. Role of FDG-PET/CT in detecting lymphomatous bone marrow involvement in patients with newly diagnosed diffuse large B-cell lymphoma. Annals of hematology. 2012;91:687-95
21. Adams HJ, Kwee TC, de Keizer B. et al. FDG PET/CT for the detection of bone marrow involvement in diffuse large B-cell lymphoma: systematic review and meta-analysis. European journal of nuclear medicine and molecular imaging. 2014;41:565-74
22. Cerci JJ, Gyorke T, Fanti S. et al. Combined PET and biopsy evidence of marrow involvement improves prognostic prediction in diffuse large B-cell lymphoma. Journal of nuclear medicine: official publication, Society of Nuclear Medicine. 2014;55:1591-7
23. Akin O, Brennan SB, Dershaw DD. et al. Advances in oncologic imaging: update on 5 common cancers. CA: a cancer journal for clinicians. 2012;62:364-93
24. Alzahrani M, Elgalaly TC, Hutchings M. et al. The value of routine bone marrow biopsy in patients with diffuse large B-cell lymphoma staged with PET/CT: A Danish-Canadian study. Annals of Oncology Official Journal of the European Society for Medical Oncology. 2016;27:mdw137
Author contact
![]() Corresponding author: Gang Huang, 1630 Dongfang Road, Shanghai 200127, China, Tel: +86 21 63867812, 63853125, Fax: +86 21 63842916, E-mail: huang2802com and Jianjun Liu, 1630 Dongfang Road, Shanghai 200127, China, Tel: +86 21 68383530, Fax: +86 21 63842916, E-mail: nuclearjcom
Corresponding author: Gang Huang, 1630 Dongfang Road, Shanghai 200127, China, Tel: +86 21 63867812, 63853125, Fax: +86 21 63842916, E-mail: huang2802com and Jianjun Liu, 1630 Dongfang Road, Shanghai 200127, China, Tel: +86 21 68383530, Fax: +86 21 63842916, E-mail: nuclearjcom
Citation styles
APA
Chen, Y., Zhou, M., Liu, J., Huang, G. (2018). Prognostic Value of Bone Marrow FDG Uptake Pattern of PET/CT in Newly Diagnosed Diffuse Large B-cell Lymphoma. Journal of Cancer, 9(7), 1231-1238. https://doi.org/10.7150/jca.23714.
ACS
Chen, Y.; Zhou, M.; Liu, J.; Huang, G. Prognostic Value of Bone Marrow FDG Uptake Pattern of PET/CT in Newly Diagnosed Diffuse Large B-cell Lymphoma. J. Cancer 2018, 9 (7), 1231-1238. DOI: 10.7150/jca.23714.
NLM
Chen Y, Zhou M, Liu J, Huang G. Prognostic Value of Bone Marrow FDG Uptake Pattern of PET/CT in Newly Diagnosed Diffuse Large B-cell Lymphoma. J Cancer 2018; 9(7):1231-1238. doi:10.7150/jca.23714. https://www.jcancer.org/v09p1231.htm
CSE
Chen Y, Zhou M, Liu J, Huang G. 2018. Prognostic Value of Bone Marrow FDG Uptake Pattern of PET/CT in Newly Diagnosed Diffuse Large B-cell Lymphoma. J Cancer. 9(7):1231-1238.
This is an open access article distributed under the terms of the Creative Commons Attribution (CC BY-NC) license (https://creativecommons.org/licenses/by-nc/4.0/). See http://ivyspring.com/terms for full terms and conditions.