Journal of Cancer
ISSN: 1837-9664
3.2
Impact Factor
ISSN: 1837-9664

 Global reach, higher impact
J Cancer 2018; 9(4):683-689. doi:10.7150/jca.22279 This issue Cite
Research Paper
Clinical and Diagnostic Significance of Homer1 in hepatitis B virus-induced Hepatocellular Carcinoma
Ping Luo1, Xiaobo Feng2, Wei Jing3, Man Zhu1, Nandi Li1, Hu Zhou1, paul F worley4, Hongyan Chai1 ![]() , Jiancheng Tu1
, Jiancheng Tu1 ![]()
1. Department of Clinical Laboratory Medicine & Center for Gene Diagnosis, Zhongnan Hospital of Wuhan University, Wuhan 430071, China;
2. Department of Pain, Zhongnan Hospital of Wuhan University, Wuhan 430071, China;
3. Department of Clinical Laboratory, First Affiliated Hospital of Zhengzhou University, Henan, 450000, China.
4. Department of Neuroscience, Johns Hopkins University School of Medicine, Baltimore, MD 21205.
Received 2017-8-8; Accepted 2017-12-2; Published 2018-1-11
Citation:
Luo P, Feng X, Jing W, Zhu M, Li N, Zhou H, worley pF, Chai H, Tu J. Clinical and Diagnostic Significance of Homer1 in hepatitis B virus-induced Hepatocellular Carcinoma. J Cancer 2018; 9(4):683-689. doi:10.7150/jca.22279. https://www.jcancer.org/v09p0683.htm
Other stylesAbstract
Background: Hepatocellular carcinoma (HCC) is a malignant tumor worldwide. Attributed to the lack of early diagnosis index, most patients are diagnosed in their late stage. Homer1, as a member of scaffold protein family, is made up of two different isoforms: Homer1a and Homer1b/c. More and more evidences show that Homer1 is dysregulated in cancers. Here, in this study, we investigated the expression profile, clinical, diagnostic and prognostic significance of Homer1 in hepatitis B virus-induced HCC (HBV-HCC).
Methods: We first tested the expression of Homer1 in HCC cell lines by quantitative real-time PCR (qRT-PCR), western blot. Then, 86 pairs of tumorous and adjacent normal tissues from HCC together with a total number of 245 peripheral blood samples were enrolled to check the expression levels of Homer1 by quantitative real-time PCR (qRT-PCR).
Results: The results revealed that the levels of Homer1 were both downregulated in HCC cell line and tissue and were associated with tumor size, but were not related to the prognosis of HBV-HCC. Receiver-operating characteristic curve analyses indicated that the sensitivity of Homer1 to differentiate HCC patients from the controls was high to 100.0% and the combination of Homer1 and AFP got a higher prediction value of HCC (AUC=0.890).
Conclusion: Our data highlighted that Homer1 played a critical role in HCC tumorigenesis and might be a potential diagnostic marker for HCC.
Keywords: Homer1, HCC, Tumorigenesis, Diagnosis: Down-regulated
Introduction
Hepatocellular carcinoma (HCC) is one of the sixth most common and aggressive malignancies, and ranks as the third leading cause of cancer-related death all over the world [1, 2]. Although many factors can accelerate the development of HCC, it has been reported that cirrhosis is the leading risk factor for HCC[3], and hepatitis B virus (HBV) infection represents the majority of cirrhosis cases[4]. Over the past 20 years, the mortality rate resulted from HCC has rose significantly [5]. At present, the most common clinical biomarkers to diagnose HCC is α- fetoprotein (AFP), however, the sensitivity of serum AFP is only 39-65% [6, 7], leading to the patients that with early stage HCC undiagnosed. It is reported that serum AFP levels may remain normal even in 15-30% of advanced HCC [8]. In addition, AFP level can increase in benign liver diseases, such as hepatitis and cirrhosis[9]. Therefore, the development of non-invasive biomarkers with high sensitivity and specificity for the early detection of HCC would be highly beneficial.
It is known to us all that Homer protein families are made up of three subtypes: Homer1, Homer2, and Homer3 [10, 11]. Homer1 as a member of Homer families consists the following two different isoforms: Homer1a and Homer1b/c. Homer1a which is the first identified Homer protein is a short variant of Homer1 [12]. In contrast to homer1a, the long form Homer1b/c contains additional amino acids at the C terminus and is consistently expressed[13]. Intracellular calcium, as a versatile second messenger plays a vital role in tumor cells, through apoptosis, proliferation, invasion and metastasis [14, 15]. Homer1 has been reported to interact directly or indirectly with Ca2+ signaling proteins, such as the canonical TRPC (transient receptor potential channel) [16], STIM1 (stromal interaction molecule1)[17], IP3R (inositol-1,4,5-triphosphate) [18] and Orai1 [17]. Furthermore, Homer1 is involved in modulating the trafficking of mGluR5 (metabotropic glutamate receptor 5) from the cytoplasma to the plasma membrane[19] and activity of mGlu5 might regulate cell survival in HCC[20]. Thus, we assumed that there was a correlation between Homer1 and tumors. Wu et al.[21] found that the expression of Homer1 in intrahepatic cholangiocarcinoma was higher than that in the adjacent tissues and its expression was negatively correlated with the 5 year survival rate of the patients. Meanwhile, Shin et al.[22] revealed that various tumor cells (HeLa, HCT116, HEK 293, DU145, and A549) originated from tissues of cervix, colon, kidney, and lung express the significant amounts of Homer1 protein, indicating that Homer1 may play some roles in tumorigenesis. However, the role of Homer1 in HBV-HCC has not been previously described.
In this study, we set out to evaluate the expression profile of Homer1 in HBV-HCC patients, then to analyze the correlation between Homer1 expression and clinicopathological characteristics of patients with HBV-HCC, and to explore whether Homer1 could be a new biomarker for HBV-HCC.
Materials and Methods
Sample collection and ethics statement
Eighty-six HBV-HCC (79 men and 7 women, mean age 58±10) tissues and their adjacent normal tissues (located >3 cm away from the tumor) were collected from Zhongnan hospital of Wuhan university between 2012 and 2017. A number of 245 individuals' blood samples were also recruited in the same hospital during 2016, including 80 healthy controls, 52 patients with hepatitis B, 53 HBV-related cirrhosis patients, and 60 HBV-HCC patients. We chose all subjects based on medical or pathology reports. All the patients included in our experiment were HBsAg positive and without any other liver diseases, such as alcoholic, autoimmune, hepatitis C and metabolic liver diseases. Patients who underwent any chemotherapy or radiotherapy were not included in our study. Healthy blood samples were got from donors who underwent routine medical examinations at the Physical Examination Center. The study protocol was approved by the Medical Ethical Committee of Zhongnan Hospital of Wuhan University (ethical approval 2013059, April 2013).
Isolation of peripheral blood leukocytes
One milliliter peripheral blood collected in EDTA tubes was placed directly into RNase-free tubes, then 3 milliliter red blood cell lysis buffer was added into it and then it was put on ice for 30 minutes. Thirty minutes later, the diluted blood was centrifuged at 12,000 g for 10 min at 4℃. After centrifugation, the supernatant was discarded. Subsequently, the deposition was washed with red blood cell lysis buffer to remove plasma and erythrocyte by centrifuging at 12, 000 g for 5 min at 4℃. The supernatant was discarded, and the cell pellet was suspended in Trizol reagent. Then these samples were stored at 80℃ until RNA extraction.
RNA extraction and reverse transcription
Total RNA was extracted from tissues and peripheral blood leukocytes using Trizol reagent (Invitrogen, Carlsbad, CA, USA). Nanodrop 2000 spectrophotometer (Thermo Scientific Inc., Waltham, MA, USA) was used to measure the concentration of the RNA. 1μg RNA was reversely transcribed in a final reaction volume of 20μL using PrimeScriptTM RT reagent Kit with gDNA Eraser (Takara, Japan) and the primer used for RT was random hexamer. Reverse transcription conditions were as follows: 42℃ for 2 min, and then 37℃ for 15 min, 85℃ for 5 sec. All cDNA samples were stored at -80°C before real-time PCR analysis.
Real-Time Polymerase Chain Reaction
The expression of Homer1 was measured on the Bio-Rad CFX96 (Bio-Rad Laboratories, Inc., Hercules, CA, USA) using SYBR-Green I Premix Ex Taq following manufacturer's instructions. GAPDH was chosen as endogenous control gene to normalize Homer1 levels. The sequences of the PCR primers for GAPDH and Homer1 were as follows: 5′- AGAAGGCTGGGGCTCATTTG-3′ (sense) and 5′- GCAGGAGGCATTGCTGATGAT-3′ (anti-sense) for GAPDH, 5'-GATCCTGCCTAGCCTTCT-3'(sense) and 5'-GGAGCGAGCAACCAAACG-3' (anti-sense) for Homer1. Real-time PCR was performed in a volume of 20μL including 1.5μL cDNA, 10μL SYBR Green mix, 1.6μL gene-specific forward and reverse primers (10μM), and 6.9μL nuclease-free water. The reactions started at 95 °C for 5 min, followed by 40 cycles of 95 °C for 30 s, 62 °C for 30 s and 72 °C for 30 s. All reactions were amplified in duplicate with no-template controls included. The relative expression levels of Homer1 were calculated using 2-ΔCt.
Cells and cell culture
Human HCC cell lines HepG2 were bought from the China Center for Type Culture Collection (CCTCC, Wuhan, China), the normal human hepatocyte cell line L-02 were purchased from the Procell Inc. (Wuhan, China). HCCLM-9 were maintained at our laboratory. All the Cells were cultured in RPMI 1640 medium (Gibco, USA) supplemented with 10 % fetal bovine serum (FBS, Gibco, USA), 50 U/ml penicillin and 50 U/ml streptomycin in flasks at 37 °C in a humidified atmosphere of 5 % CO2.
Western blot analysis
Homer1 protein expression was detected by western blot analysis. The stable cells were lysed using RIPA lysis buffer in the presence of PMSF proteinase inhibitor (Beyotime, China) and the lysates were harvested by centrifuging (12, 000 rpm) at 4°C for 30 min. Protein samples of approximately 40 ug were electrophoresed on 12% sodium dodecyl sulphate polyacrylamide gel and were transferred onto polyvinylidene difluoride (PVDF) membrane. After blocking the nonspecific binding sites for 1h with 5% non-fat milk in PBST, the membrane were incubated at 4℃ overnight with a rabbit polyclonal antibody against Homer1 (1:3, 000 dilution). GAPDH was used as a loading control. After incubated with secondary antibody for 1h at room temperature, the signals were detected by the enhanced chemiluminescence reagents (ECL) (Beyotime, China). The Image J software was used to quantify the optical density of each band.
Statistical Analysis
Statistical analyses were performed using SPSS 17.0 software (SPSS, Chicago, IL, USA) and GraphPad Prism 5 software (GraphPad software, La Jolla, CA, USA). Normally distributed data were presented as mean ± standard deviation (SD). Skewed data were described by the median and inter-quartile range. The Shapiro-Wilk test was done to check the normality of the distribution. Student's t test was operated to detect normally distributed data, while non-normally distributed variables were analyzed by Kruskal-Wallis variance analysis. Categorical variables were tested using Chi-square test. One-way ANOVA was used for the comparison among multiple groups if the variance was homogeneous. ROC curves were constructed to evaluate the diagnostic value of Homer1 as a biomarker. Samples with Ct value >37 were removed from the study for its uncertainty. All statistical tests were two-sided and P<0.05 was considered statistically significant.
Results
Homer1 expression in HCC cell lines
To explore the association between Homer1 and HCC, we tested the expression levels of Homer1 in one normal cell line L-02 and two HCC cell lines (Hep-G2, and HCCLM-9) both in RNA and protein level. The results revealed that Homer1 were down expressed in HCC cell lines than that in normal cell line (Figure. 1).
Homer1 expression in HBV-HCC tissues
RT-qPCR was performed to evaluate the expression levels of Homer1 in HBV-HCC tissues and adjacent normal liver tissues derived from 86 HBV-HCC patients. It is reported that GAPDH was the most frequently used reference gene for RT-qPCR analysis in HCC[23], so we chose GAPDH as our reference gene. No significant alteration of GAPDH expression levels between HBV-HCC tumor tissues and matched paracancerous tissues were existed (P=0.125). The expression level of Homer1 was significantly lower than that in matched adjacent tissues (P<0.001; Figure 2A). Waterfall plot showed that the expression of Homer1 was downregulated in 62.8% (54/86) of HCC tissues and Homer1 was reduced by at least twofold in 48.8% (42/86) of the HCC patients (Figure 2B).
Correlation between Homer1 and clinic features
We analyzed the relationship between Homer1 levels and clinicopathological characteristics of the 86 HBV-HCC patients. No significant correlations were found between Homer1 levels and gender, age, smoking, alcoholism, TNM (tumor-node-metastasis stage), HBV DNA levels, cirrhosis, AFP (α-fetoprotein), ALT (alanine aminotransferase), AST (aspartate aminotransferase) and GGT (γ-glutamyl transferase) (P > 0.05), whereas the levels of Homer1 were significantly associated with tumor sizes. (P = 0.040) (Table 1)
Association between Homer1 levels and patients' survival
To explore the prognostic value of Homer1 in HBV-HCC, we assessed the relationship between Homer1 expression and overall survival (OS) in 53 patients. Patients were divided into two group, and 24 of them were in the high Homer1 group, 29 patients were in the low group. The Kaplan-Meier plots and Log-rank tests were applied. Unfortunately, no association between Homer1 expression and overall survival was found. (P=0.193, Figure 3)
Figure 1
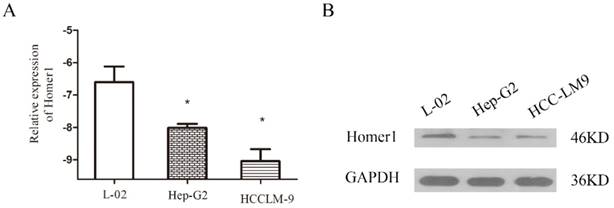
Evaluation of Homer1 in two HCC cell lines compared to a normal liver cell line L-02.
Figure 2
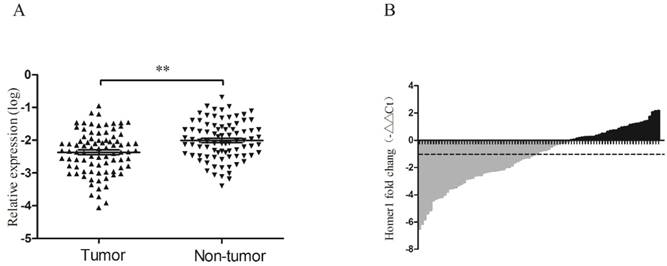
Homer1 expression in HCC tissues. The relative Homer1 expression was determined by RT-qPCR.
The expression of Homer1 in peripheral blood among subgroups
In addition to evaluate Homer1 expression in cell lines and tissues, we also tested its expression in peripheral blood in 60 HBV-HCC patients, 53 cirrhosis patients, 52 hepatitis B, and 80 control cases. The main demographic and clinical characteristics of the studied subjects were summarized in Table 2. There were no differences in risk factors including gender, age, smoking, alcoholism whereas a significant difference in ALT, AST, TBIL, GGT and GLU among the groups were found.
As shown in Figure 4, we found that the expression of Homer1 in HBV-HCC was lower than that in hepatitis B, cirrhosis and control groups (HBV-HCC vs cirrhosis: P<0.05; HCC vs hepatitis B: P<0.001; HCC vs the controls: P<0.001). Despite that no significant difference was observed when we compared the expression levels of Homer1 in other three subgroups (cirrhosis, hepatitis B and the controls), the level of Homer1 had a decline tendency from control cases, HBV, cirrhosis to HCC which was in accordance with the development hallmark of HCC.
Figure 3
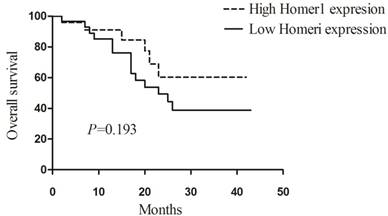
Association between the expression of Homer1 and prognosis in HBV-HCC.
Diagnostic value of Homer1 in peripheral blood as a biomarker
ROC curve analysis was carried out to evaluate the diagnostic value of Homer1 in HBV-HCC. Results revealed that the diagnostic value of Homer1 in discriminating HBV-HCC from hepatitis B and cirrhosis was not obvious (Figure 5 A-B). However, Homer1 can discriminate HBV-HCC patients from the controls with a sensitivity of 100.0% based on the cutoff value of -2.483 (AUC=0.724, 95%CI: 0.634-0.814) (Figure 5C). The combination of Homer1 and AFP possessed a moderate ability for discriminating HCC patients from the controls with an area equal to 0.890 (95%CI: 0.81-0.969) (Figure 5D and Table 3).
Table 1
Association between Homer1 expression and clinical characteristics in HCC
| Characteristics | N | Homer1 relative expression(log) | ||
|---|---|---|---|---|
| Mean ± SD | t | P | ||
| Tissue** | -5.378 | 0.0001 | ||
| HCC | 86 | -2.34±0.62 | ||
| Adjacent non-cancerous liver | 86 | -2.06±0.56 | ||
| Gender | -0.749 | 0.456 | ||
| Male | 79 | -2.39±0.67 | ||
| Female | 7 | -2.19±0.46 | ||
| Age | 1.727 | 0.088 | ||
| <55 | 44 | -2.25±0.67 | ||
| ≧55 | 42 | -2.49±0.63 | ||
| Alcoholism | -1.558 | 0.124 | ||
| Negative | 40 | -2.48±0.66 | ||
| Positive | 26 | -2.22±0.64 | ||
| Differentiation | 1.376 | 0.173 | ||
| High/ Moderate | 62 | -2.41±0.69 | ||
| Low | 12 | -2.12±0.55 | ||
| Size* | 2.092 | 0.040 | ||
| <5 cm | 23 | -2.11±0.53 | ||
| ≧5 cm | 56 | -2.45±0.70 | ||
| TNM stage | -0.533 | 0.596 | ||
| Ⅰ~Ⅱ | 28 | -2.37±0.66 | ||
| Ⅲ~Ⅳ | 40 | -2.28±0.70 | ||
| HBV DNA (IU/ml) | -1.366 | 0.179 | ||
| <500 | 20 | -2.56±0.60 | ||
| ≧500 | 27 | -2.32±0.60 | ||
| Cirrhosis | -0.332 | 0.741 | ||
| Negative | 8 | -2.28±0.79 | ||
| Positive | 41 | -2.36±0.65 | ||
| AFP (ng/l) | -1.842 | 0.069 | ||
| <200 | 40 | -2.51±0.66 | ||
| ≧200 | 41 | -2.24±0.65 | ||
| ALT (U/l) | -1.958 | 0.054 | ||
| <46 | 51 | -2.48±0.68 | ||
| ≧46 | 35 | -2.20±0.60 | ||
| AST (U/l) | -1.534 | 0.129 | ||
| <46 | 49 | -2.46±0.68 | ||
| ≧46 | 37 | -2.24±0.61 | ||
| GGT (U/l) | 0.965 | 0.338 | ||
| <55 | 35 | -2.28±0.69 | ||
| ≧55 | 51 | -2.42±0.64 | ||
Data are shown as mean ± standard deviation. Since we failed to collect all characteristics of the patients, the total number may not be 86. TNM, tumor-node-metastasis. AFP, α-fetoprotein; ALT, alanine aminotransferase; AST, aspartate aminotransferase; GGT, γ-glutamyl transferase; * P<0.05, ** P<0.001.
Discussion
HCC is one of the most common solid tumors with highly aggressive and poor prognosis worldwide [24]. In China, chronic HBV infection is a major contributing factor to HCC. In the past few years, numerous researches were performed to explore appropriate biomarkers to diagnose HCC [25]. However, there is still no reliable and effective non-invasive biomarkers. Presently, AFP is the most frequently used biomarker for the diagnosis of HCC, but the sensitivity and specificity remain unsatisfactory[26]. Hence, novel biomarkers to monitor the status of HBV infection patients and diagnose HCC at an early stage are urgently needed. Homer, as scaffold proteins, are newly studied in tumors. Considering its vital role in keeping the homestasis of calcium in intracellular, we believe that Homer1 is involved in tumorigenesis. Furthermore, Wu et al.[21] demonstrated that the expression of Homer1 in intrahepatic cholangiocarcinoma was higher than that in the adjacent tissues. Thus, it is particularly prospective to explore whether Homer1 can be a new biomarker for HCC.
Table 2
Characteristics of the studied participants
Characteristics | HCC | Cirrhosis | Hepatitis B | Control | P |
|---|---|---|---|---|---|
| N =60 | N =53 | N =52 | N =80 | ||
| Gender | 0.589a | ||||
| Male | 48 | 41 | 43 | 56 | |
| Female | 12 | 12 | 9 | 24 | |
| Age | 0.839a | ||||
| <55 | 25 | 22 | 24 | 38 | |
| ≧55 | 35 | 31 | 28 | 42 | |
| Smoking | 0.943a | ||||
| Negative | 31 | 30 | 29 | 45 | |
| Positive | 29 | 23 | 23 | 35 | |
| Alcoholism | 0.943a | ||||
| Negative | 41 | 38 | 35 | 57 | |
| Positive | 19 | 15 | 17 | 23 | |
| ALT (U/l) | 48 (27,78) ** | 25 (20,37) * | 79(31,308) ** | 21(16,27) | <0.001b |
| AST (U/l) | 50 (32,100) ** | 36 (25,45) ** | 50 (31,96) ** | 22(20,26) | <0.001b |
| TBIL (μmol/l) | 20 (14,27) * | 23 (13,34) ** | 22 (13,79) * | 13 (11,16) | 0.002b |
| GGT (U/l) | 154 (70,260)* * | 39 (22,128)* | 54 (20,102)* * | 22(18,37) | <0.001b |
| GLU (mmol/l) | 5.2 (4.6,6.0)* | 4.8 (4.2,6.1) | 4.5(4.2,5.2) | 4.4 (4.8,5.3) | 0.010b |
Data are shown as Median (25 Percentiles, 75 Percentiles).* P < 0.05, ** P < 0.001 vs Control. aChi-square test; bKruskal-Wallis. Abbreviation: ALT, alanine aminotransferase; AST, aspartate aminotransferase; GGT, γ-glutamyl transferase; GLU, glucose; AFP, α-fetoprotein.
Figure 4
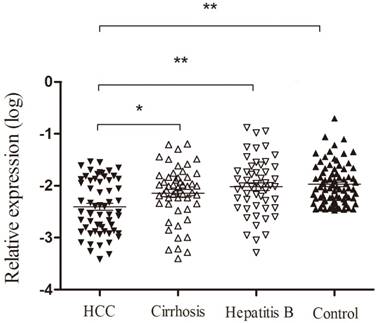
Homer1 expression in peripheral blood among subgroups.
This is the first study to our knowledge to examine the role of Homer1 in HCC patients. We found that the levels of Homer1 were down expressed in HCC cell lines than that in normal cell line both in RNA and in protein level. In addition we also revealed that Homer1 were obviously downregulated in HCC tissues than that in corresponding noncancerous tissues. At the same time, our data indicated that Homer1 expression was highly related to tumor size and no association between Homer1 expression and overall survival was revealed. Peripheral blood appear to be well-suited for the study of gene expression [27], and it is well defined that HCC is systemic disease of the whole body. Besides, it is known to us that HCC is a prototype of inflammation-associated cancer that generally occurred on a background of chronic hepatitis, irrespective of the triggering etiology[28]. Thus we also detected the expression of Homer1 in peripheral blood leukocytes. In consistent with the tissues, the levels of Homer1 in HCC were much lower than that in cirrhosis, hepatitis B and the controls. Additionally, ROC curve suggested that the combination of Homer1 and AFP had a valid diagnostic value for HCC with the AUC of 0.890.
Figure 5
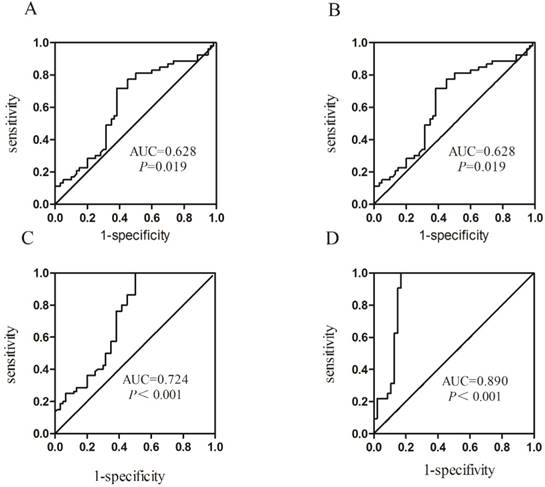
Receiver operating characteristic (ROC) curves.
There were some strengths of this study that should be paid attention to. First, we focused our study on the HBV-HCC, which makes the results more specific. Second we explored the expression level of Homer1 in cell lines, tissues and peripheral blood cells which greatly increased the research persuasive power. Third, the controls and the cases were matched on age, and the baseline characteristic distributions in our control group were similar to case group. Therefore, it is highly believed that selection bias was not significant and not likely to influence the results of our study. However, several limitations may exist in our study. First, the sample size of our study was not large, and the statistical power of the study may be limited. Second, the comparison of the expression level of Homer1 in HCC with that in adjacent non-cancerous lesion where chronic inflammation, including chronic hepatitis and liver cirrhosis, followed by regeneration existed [29] may affect our result.
Table 3
Presentation of the AUC of Homer1 among subgroups
| Group | AUC | 95%CI | P | Se(%) | Sp(%) |
|---|---|---|---|---|---|
| HCC vs Cirrhosis | 0.628 | 0.523-0.733 | 0.019 | 71.7 | 61.7 |
| HCC vs HBV | 0.685 | 0.587-0.784 | <0.001 | 73.1 | 61.8 |
| HCC vs Controls | 0.724 | 0.634-0.814 | <0.001 | 100.0 | 50.0 |
| HCC vs Controls* | 0.890 | 0.812-0.969 | <0.001 | 100.0 | 83.0 |
Abbreviation: Se: Sensitivity; Sp: Specificity. * Combination of Homer1 and AFP differentiates HBV-HCC patients from the controls.
In our study, we found a possible tumor suppressive role of Homer1 in HCC. In contrast to our study, Wu et al.[21] demonstrated that the expression of Homer1 in intrahepatic cholangiocarcinoma was higher than that in the adjacent tissues, suggesting an oncogenic role of Homer1. Interestingly, mRNA annexin A4 has been found to be decreased in prostate cancer [30] but increased in HCC[31] which revealed that there are genes act as oncogene or tumor suppressor in different cancers, we therefore deemed that Homer1 may play a diverse role in different tumors. Ni et al.[32] found that serum stimulated hepatocyte proliferation was dependent on calcium and depletion of calcium using thapsigargin or EGTA inhibited the proliferation. El Boustany et al.[33] demonstrated that TRPC6 was weakly expressed in isolated hepatocytes from healthy patients and expressed more strongly in tumoral samples from the liver of a cancer patient, indicating a role of calcium channels in liver oncogenesis. Homer, as a scaffolding protein can interact with a series of calcium channels, such as TRPC, STIM1, IP3R and Orai1. Thus, the hypothesis that Homer1 may inhibit the progress of HCC through interacting with calcium channels, then to mediate the intracellular Ca2+ concentration was made. However, the exact mechanism needs to be further researched.
In conclusion, we firstly identified that the expression of Homer1 was lower in HCC and its level was associated with tumor size. When we detected the expression of Homer1 in HCC peripheral blood, we discovered that Homer1was downregulated in HCC compared to cirrhosis, hepatitis B and the controls. ROC curve showed that Homer1 had a good diagnostic value to differentiate HCC from normal person and the combination of Homer1 and AFP would achieve better diagnostic accuracy. These findings for the first time revealed that the expression of Homer1 could be used as a novel diagnostic marker for HCC. However, large-scale studies are needed to confirm our findings and further investigations are still essential to explore the exact molecular mechanism of unregulated expression of Homer1 HCC.
Acknowledgements
This study was supported by the Research of Homer ELISA Kit for Breast Cancer (201260523173-2) and National Basic Research Program of China (973 Program) (2012CB720605).
Competing Interests
The authors have declared that no competing interest exists.
References
1. Tian J, Hu X, Gao W. et al. Identification a novel tumor-suppressive hsa-miR-599 regulates cells proliferation, migration and invasion by targeting oncogenic MYC in hepatocellular carcinoma. Am J Transl Res. 2016;8:2575-84
2. Fernandez-Rodriguez CM, Gutierrez-Garcia ML. Prevention of hepatocellular carcinoma in patients with chronic hepatitis B. World J Gastrointest Pharmacol Ther. 2014;5:175-82
3. Waghray A, Murali AR, Menon KN. Hepatocellular carcinoma: From diagnosis to treatment. World J Hepatol. 2015;7:1020-9
4. Chen KW, Ou TM, Hsu CW. et al. Current systemic treatment of hepatocellular carcinoma: A review of the literature. World J Hepatol. 2015;7:1412-20
5. Quagliata L, Matter MS, Piscuoglio S. et al. Long noncoding RNA HOTTIP/HOXA13 expression is associated with disease progression and predicts outcome in hepatocellular carcinoma patients. Hepatology. 2014;59:911-23
6. Chen S, Chen H, Gao S. et al. Differential expression of plasma miR-125b in hepatitis B virus related liver diseases and diagnostic potential for hepatitis B virus induced hepatocellular carcinoma. Hepatol Res. 2016
7. Collier J, Sherman M. Screening for hepatocellular carcinoma. Hepatology. 1998;27:273-8
8. Han LL, Lv Y, Guo H. et al. Implications of biomarkers in human hepatocellular carcinoma pathogenesis and therapy. World J Gastroenterol. 2014;20:10249-61
9. Qi J, Wang J, Katayama H. et al. Circulating microRNAs (cmiRNAs) as novel potential biomarkers for hepatocellular carcinoma. Neoplasma. 2013;60:135-42
10. Tu JC, Xiao B, Yuan JP. et al. Homer binds a novel proline-rich motif and links group 1 metabotropic glutamate receptors with IP3 receptors. Neuron. 1998;21:717-26
11. Jing X, Chen SS, Jing W. et al. Diagnostic potential of differentially expressed Homer1, IL-1beta, and TNF-alpha in coronary artery disease. Int J Mol Sci. 2015;16:535-46
12. Brakeman PR, Lanahan AA, O'Brien R. et al. Homer: a protein that selectively binds metabotropic glutamate receptors. Nature. 1997;386:284-8
13. Duncan RS, Hwang SY, Koulen P. Effects of Vesl/Homer proteins on intracellular signaling. Exp Biol Med (Maywood). 2005;230:527-35
14. Berridge MJ, Bootman MD, Roderick HL. Calcium signalling: dynamics, homeostasis and remodelling. Nat Rev Mol Cell Biol. 2003;4:517-29
15. Wen L, Liang C, Chen E. et al. Regulation of Multi-drug Resistance in hepatocellular carcinoma cells is TRPC6/Calcium Dependent. Sci Rep. 2016;6:23269
16. Yuan JP, Kiselyov K, Shin DM. et al. Homer binds TRPC family channels and is required for gating of TRPC1 by IP3 receptors. Cell. 2003;114:777-89
17. Jardin I, Albarran L, Bermejo N. et al. Homers regulate calcium entry and aggregation in human platelets: a role for Homers in the association between STIM1 and Orai1. Biochem J. 2012;445:29-38
18. Kim JY, Zeng W, Kiselyov K. et al. Homer 1 mediates store- and inositol 1,4,5-trisphosphate receptor-dependent translocation and retrieval of TRPC3 to the plasma membrane. J Biol Chem. 2006;281:32540-9
19. Luo P, Li X, Fei Z. et al. Scaffold protein Homer 1: implications for neurological diseases. Neurochem Int. 2012;61:731-8
20. Wu YL, Wang NN, Gu L. et al. The suppressive effect of metabotropic glutamate receptor 5 (mGlu5) inhibition on hepatocarcinogenesis. Biochimie. 2012;94:2366-75
21. Wu SY, Yu MX, Li XG. et al. Identification of Homer1 as a potential prognostic marker for intrahepatic cholangiocarcinoma. Asian Pac J Cancer Prev. 2014;15:3299-304
22. Shin JN, Piya S, Yun CW. et al. Homer1 regulates the susceptibility to TRAIL. Exp Cell Res. 2009;315:2249-55
23. Matsumura M, Ijichi M, Shiratori Y. et al. Simple quantitative assay of alpha-fetoprotein mRNA in liver tissue using the real-time detection polymerase chain reaction assay - its application for clinical use. Hepatol Res. 2001;20:84-96
24. Li C, Chen J, Zhang K. et al. Progress and Prospects of Long Noncoding RNAs (lncRNAs) in Hepatocellular Carcinoma. Cell Physiol Biochem. 2015;36:423-34
25. Li J, Wang X, Tang J. et al. HULC and Linc00152 Act as Novel Biomarkers in Predicting Diagnosis of Hepatocellular Carcinoma. Cell Physiol Biochem. 2015;37:687-96
26. Jang ES, Jeong SH, Kim JW. et al. Diagnostic Performance of Alpha-Fetoprotein, Protein Induced by Vitamin K Absence, Osteopontin, Dickkopf-1 and Its Combinations for Hepatocellular Carcinoma. PLoS One. 2016;11:e0151069
27. Liu Z, Hao C, Huang X. et al. Peripheral blood leukocyte expression level of lncRNA steroid receptor RNA activator (SRA) and its association with polycystic ovary syndrome: a case control study. Gynecol Endocrinol. 2015;31:363-8
28. Berasain C, Castillo J, Perugorria MJ. et al. Inflammation and liver cancer: new molecular links. Ann N Y Acad Sci. 2009;1155:206-21
29. Ito Y, Sasaki Y, Horimoto M. et al. Activation of mitogen-activated protein kinases/extracellular signal-regulated kinases in human hepatocellular carcinoma. Hepatology. 1998;27:951-8
30. Xin W, Rhodes DR, Ingold C. et al. Dysregulation of the annexin family protein family is associated with prostate cancer progression. Am J Pathol. 2003;162:255-61
31. Chen W, Chen L, Cai Z. et al. Overexpression of annexin A4 indicates poor prognosis and promotes tumor metastasis of hepatocellular carcinoma. Tumour Biol. 2016;37:9343-55
32. Ni HM, Baty CJ, Li N. et al. Bid agonist regulates murine hepatocyte proliferation by controlling endoplasmic reticulum calcium homeostasis. Hepatology. 2010;52:338-48
33. El Boustany C, Bidaux G, Enfissi A. et al. Capacitative calcium entry and transient receptor potential canonical 6 expression control human hepatoma cell proliferation. Hepatology. 2008;47:2068-77
Author contact
![]() Corresponding authors: Jiancheng Tu & Hongyan Chai, E-Mail: jianchengtuedu.cn; chy1127com
Corresponding authors: Jiancheng Tu & Hongyan Chai, E-Mail: jianchengtuedu.cn; chy1127com
Citation styles
APA
Luo, P., Feng, X., Jing, W., Zhu, M., Li, N., Zhou, H., worley, p.F., Chai, H., Tu, J. (2018). Clinical and Diagnostic Significance of Homer1 in hepatitis B virus-induced Hepatocellular Carcinoma. Journal of Cancer, 9(4), 683-689. https://doi.org/10.7150/jca.22279.
ACS
Luo, P.; Feng, X.; Jing, W.; Zhu, M.; Li, N.; Zhou, H.; worley, p.F.; Chai, H.; Tu, J. Clinical and Diagnostic Significance of Homer1 in hepatitis B virus-induced Hepatocellular Carcinoma. J. Cancer 2018, 9 (4), 683-689. DOI: 10.7150/jca.22279.
NLM
Luo P, Feng X, Jing W, Zhu M, Li N, Zhou H, worley pF, Chai H, Tu J. Clinical and Diagnostic Significance of Homer1 in hepatitis B virus-induced Hepatocellular Carcinoma. J Cancer 2018; 9(4):683-689. doi:10.7150/jca.22279. https://www.jcancer.org/v09p0683.htm
CSE
Luo P, Feng X, Jing W, Zhu M, Li N, Zhou H, worley pF, Chai H, Tu J. 2018. Clinical and Diagnostic Significance of Homer1 in hepatitis B virus-induced Hepatocellular Carcinoma. J Cancer. 9(4):683-689.
This is an open access article distributed under the terms of the Creative Commons Attribution (CC BY-NC) license (https://creativecommons.org/licenses/by-nc/4.0/). See http://ivyspring.com/terms for full terms and conditions.