Journal of Cancer
ISSN: 1837-9664
3.2
Impact Factor
ISSN: 1837-9664

 Global reach, higher impact
J Cancer 2018; 9(4):660-666. doi:10.7150/jca.22016 This issue Cite
Research Paper
Lymph node staging systems in patients with gastric cancer treated with D2 resection plus adjuvant chemotherapy
Yi-Xin Zhou1*, Lu-Ping Yang2*, Zi-Xian Wang2*, Ming-Ming He2*, Jing-Ping Yun3, Dong-Sheng Zhang2, Feng Wang2, Rui-Hua Xu2 ![]()
1. Department of VIP Region, Sun Yat-sen University Cancer Center; State Key Laboratory of Oncology in South China; Collaborative Innovation Center for Cancer Medicine, Guangzhou 510060, China;
2. Department of Medical Oncology, Sun Yat-sen University Cancer Center; State Key Laboratory of Oncology in South China; Collaborative Innovation Center for Cancer Medicine, Guangzhou 510060, China;
3. Department of Pathology, Sun Yat-sen University Cancer Center; State Key Laboratory of Oncology in South China; Collaborative Innovation Center for Cancer Medicine, Guangzhou 510060, China.
*These authors contributed equally as first authors.
Received 2017-7-20; Accepted 2017-12-5; Published 2018-1-6
Citation:
Zhou YX, Yang LP, Wang ZX, He MM, Yun JP, Zhang DS, Wang F, Xu RH. Lymph node staging systems in patients with gastric cancer treated with D2 resection plus adjuvant chemotherapy. J Cancer 2018; 9(4):660-666. doi:10.7150/jca.22016. https://www.jcancer.org/v09p0660.htm
Other stylesAbstract
Background: The optimal nodal staging scheme for gastric cancer remains unsettled. We compared the prognostic performances of the metastatic lymph node, lymph node ratio, and log odds of metastatic lymph nodes based on nomograms among 801 patients with D2-resected gastric cancer treated with adjuvant chemotherapy.
Methods: When assessed as a continuous covariate, each nodal staging variable was incorporated into a prognostic nomogram with other significant prognosticators to predict the 5-year overall survival. The discriminatory abilities of the nomograms were compared using the concordance index. Patients were divided into subgroups using each nomogram, and the prognostic homogeneity of the nomograms was assessed using the Kaplan-Meier method with log-rank tests.
Results: The discriminatory abilities of the three nomograms were comparable (P > 0.05 for all pairwise comparisons). However, for patients within each lymph node ratio subgroup, overall survival was homogenous when stratified by subgroups of the other two staging schemes, while it differed significantly among the different lymph node ratio subgroups for patients within some of the other two staging subgroups.
Conclusion: The lymph node ratio-based staging scheme performs the best for the prediction of survival in patients with locally advanced gastric cancer treated with D2 resection followed by adjuvant chemotherapy.
Keywords: gastric cancer, metastatic lymph node, lymph node ratio, log odds of metastatic lymph nodes, nomogram
Introduction
Gastric cancer (GC) is the fifth most common malignancy and the third leading cause of cancer-related deaths worldwide, although its incidence is especially high in East Asia[1-3]. At present, the prognosis remains poor for patients with locally advanced tumors, and advanced tumor invasion and lymph node (LN) involvement are the best indicators of poor prognosis in patients with resectable GC [4-6].
Besides nodal status being a prognostic factor in GC, the number of total harvested nodes (THNs) reportedly may be associated with improved survival [7-9]. However, the N staging system of the current American Joint Committee on Cancer (AJCC) classification is merely based on the number of metastatic lymph nodes (MLNs) and has been criticized for disregarding the influence of THNs on survival [10, 11]. To refine the prediction of prognosis in patients with GC, two ratio-based LN staging systems have been proposed: the lymph node ratio (LNR) [12], defined as the ratio between MLNs and THNs, and the log odds of metastatic lymph nodes (LODDS) [13], defined as the log of the ratio between the number of MLNs and the number of negative lymph nodes (NLNs). Both systems have mostly shown better discriminatory accuracy than MLN-based staging for predicting prognosis in patients with resectable GC [13-17]. However, in studies solely including patients who have undergone D2 lymphadenectomy, findings regarding the best LN staging system have been inconsistent [13, 16, 18, 19].
Both the ACTS-GC and CLASSIC trials demonstrated that adjuvant chemotherapy (AC) reduced locoregional and distant recurrence and improved survival among patients with D2-resected GC [20, 21]. Accordingly, AC is accepted as the standard treatment for patients with local advanced GC undergoing D2 resection[22]. In this context, it is necessary to investigate whether the LNR- and LODDS-based systems remain superior to MLN-based staging for predicting prognosis in patients treated with D2 resection followed by AC.
Thus, in the present study, we compared the prognostic performances of MLN-, LNR-, and LODDS-based nomograms in patients with D2-resected GC who had received AC. We used nomogram-related methods to allow for multivariable-adjusted comparisons among these systems.
Methods
Patient selection and treatment
Between October 2001 and July 2014, we identified 1729 patients who had been diagnosed with GC and undergone D2 lymphadenectomy at the Sun Yat-Sen University Cancer Center. The inclusion criteria were as follows: (1) histologically confirmed IB/IIIC gastric adenocarcinoma after R0 resection, (2) treated with AC, and (3) availability of complete clinicopathologic and follow-up data. The exclusion criteria were (1) presence of residual macroscopic or microscopic tumor, (2) presence of distant metastasis or concurrent malignancies in other organs, and (3) neoadjuvant chemo- or radiotherapy or adjuvant radiotherapy. This study was approved by the independent Ethics Committee of the Sun Yat-Sen University Cancer Center.
Statistical analysis
Categorical variables were presented numerically or as percentages, while continuous variables were presented as means with standard deviations and medians with interquartile range (IQR). Spearman's rank correlations and scatter plots were examined to evaluate relationships within MLN, LNR, and LODDS variables. Overall survival (OS) was defined as the time from surgery until final follow-up or death from any cause. Multivariable Cox regression analyses were used to assess the relationships between clinicopathologic factors and OS. To avoid multicollinearity, MLN, LNR, and LODDS were included in separate Cox models [23]. MLN, LNR, and LODDS were assessed as continuous variables to reduce the bias that can result from empirically selecting cut-off points for them. Restricted cubic splines were used to examine functional forms of continuous variables in relation to survival.[24] The final Cox models were obtained using backward stepwise selection (P < 0.050).
Nomograms were generated from the final models based on the MLN, LNR and LODDS variables. Concordance indices (C-indices) were used to compare discriminative power among the nomograms based on different LN-staging systems: a larger C-index indicated a greater discriminative capacity. For each nomogram, calibration was performed by comparing the plot of nomogram-predicted survival probabilities with the Kaplan-Meier-estimated probabilities [25]. Bootstraps with 1000 resamples were used to quantify model overfit and calculate Kaplan-Meier estimates. For each nomogram, patients were grouped according to the quartiles of the total points, and Kaplan-Meier curves with log-rank tests were used to compare OS among quartiles.
A P < 0.05 was considered statistically significant. Statistical analyses were performed using SPSS v.19.0 (SPSS, Chicago, IL) and R v.3.1.2 (R Project for Statistical Computing; http://www.r-project.org).
Results
Table 1 summarizes the patient characteristics. The cohort consisted of 801 patients (522 men and 279 women) with stage IB-IIIC GC. All patients underwent D2 lymphadenectomy and received AC. Further, 629 (78.5%) had T3/4-stage disease, and 587 (73.3%) had LN metastasis. More than 15 LNs were harvested from 644 (80.4%) patients. The median follow-up time for survivors was 41.6 months (IQR: 27.4-93.3 months).
As shown in Supplementary Figure 1, the three LN variables were highly correlated with each other (r > 0.900, P < 0.01 for all). After backward variable selection, we obtained final Cox models based on MLN-, LNR-, and LODDS and corresponding nomograms (Figure 1A-1C). The hazard ratios were significantly higher for more proximal tumor location, advanced T stage, decreased NLNs, and increased MLNs, LNR, and LODDS. After examined using restricted cubic splines, MLN, NLN, LNR, and LODDS all meet the linearity assumption of Cox regression analysis. Notably, a significant interaction was found between MLN and THN in relation to OS (Pinteraction < 0.01). When NLN was included in the model instead of THNs, it was found to be independently associated with OS and showed no significant interaction with MLN (Pinteraction = 0.34), and the system's discriminatory power remained unchanged (C-index, 0.719 for both).
The bootstrap-corrected C-indices were 0.715, 0.726, and 0.725 for the MLN-, LNR- and LODDS-based nomograms, respectively, indicating minimal evidence of overfit for all three models. Both the LNR- and LODDS-based nomograms had better prognostic performance than the MLN-based one, although the differences were not significant (Z test: P > 0.05 for both; Table 2). Further, when stratified by THNs, the C-indices of the three nomograms remained comparable when restricted to patients with both ≤15 or >15 THNs, although higher C-indices were observed in all three LN-staging systems when THNs > 15 (Table 2).
Figure 1
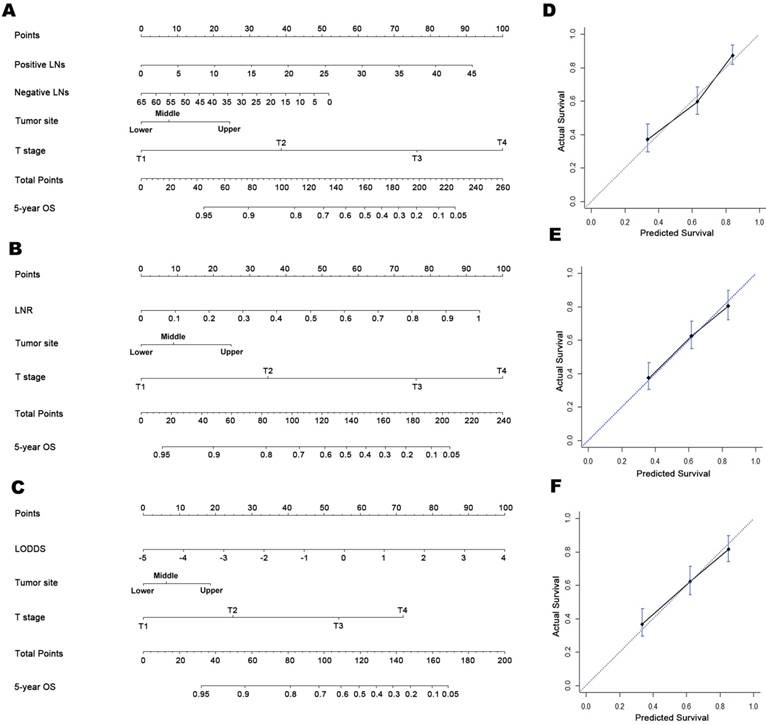
Prognostic nomograms for predicting OS in patients with D2-resected gastric cancer receiving AC and calibration plots. Prognostic nomogram of (A) tumor location, T stage, and number of MLNs and NLNs; (B) tumor location, T stage, and LNR; (C) tumor location, T stage, and LODDS. In the calibration plots for the (D) MLN-based, (E) LNR-based, and (F) LODDS-based nomograms, the nomogram-predicted OS shows close correlation with the ideal 45-degree reference line.
Table 1
Patient characteristics of the study cohort
| Variable | Mean (SD)/median (IQR)/N (%) | |
|---|---|---|
| Age (years) | ||
| Mean (SD) | 56.07 (11.30) | |
| Median (IQR) | 57.00 (49, 64) | |
| Sex | ||
| Male | 522 (65.2%) | |
| Female | 279 (34.8%) | |
| Tumor size | ||
| Mean (SD) | 4.45 (2.32) | |
| Median (IQR) | 4.00 (3, 6) | |
| Tumor location | ||
| Upper third | 205 (25.6%) | |
| Middle third | 163 (20.3%) | |
| Lower third | 433 (54.1%) | |
| Tumor differentiation | ||
| Poorly or undifferentiated | 589 (73.5%) | |
| Well or moderately differentiated | 112 (26.5%) | |
| T stage | ||
| T1 | 62 (7.7%) | |
| T2 | 110 (13.7%) | |
| T3 | 249 (31.1%) | |
| T4 | 380 (47.4%) | |
| MLN | ||
| Mean (SD) | 5.99 (7.48) | |
| Median (IQR) | 3.00 (0, 9) | |
| 0 | 214 (26.7%) | |
| 1/2 | 157 (19.6%) | |
| 3-6 | 165 (20.6%) | |
| ≥7 | 265 (33.1%) | |
| THN | ||
| Mean (SD) | 25.21 (12.10) | |
| Median (IQR) | 24.00 (16, 33) | |
| ≤15 | 157 (19.6%) | |
| >15 | 644 (80.4%) | |
| NLN | ||
| Mean (SD) | 19.22 (11.64) | |
| Median (IQR) | 18.00 (11, 26) | |
| LNR | ||
| Mean (SD) | 0.24 (0.26) | |
| Median (IQR) | 0.15 (0, 0.40) | |
| LODDS | ||
| Mean (SD) | -1.63 (1.71) | |
| Median (IQR) | -1.61 (-3.04, -0.39) | |
| AC regimen | ||
| Single fluoropyrimidines | 279 (38.5%) | |
| Fluoropyrimidine+ platin combinations | 381 (52.6%) | |
| Other fluoropyrimidine-based combinations | 65 (9.0%) | |
SD, standard deviation; IQR, interquartile range; GEJ, gastroesophaeal junction; MLN, metastatic lymph node; THN, total harvested nodes; NLN, negative lymph nodes; LNR, lymph node ratio; LODDS, log ratio of metastatic lymph node; AC, adjuvant chemotherapy.
Table 2
Discriminatory abilities of the MLN-, LNR- and LODDS-based nomograms
Models | Number of lymph nodes harvested | ||||
|---|---|---|---|---|---|
| All | ≤15 | > 15 | |||
| C-index | C-index | C-index | |||
| MLN | 0.723 | 0.703 | 0.740 | ||
| LNR | 0.734 | 0.703 | 0.745 | ||
| LODDS | 0.733 | 0.703 | 0.742 | ||
MLN, metastatic lymph node; LNR, lymph node ratio; LODDS, log ratio of metastatic lymph node; C-index, concordance index.
Calibration plots showed close agreement between the actual 5-year OS values in the study population and the OS predicted from the three nomograms (Figure 1D-1F). Using each nomogram, the patients were divided evenly into four subgroups based on the quartiles of the total points (total points from low to high: 1st quartile, MLNa/LNRa/LODDSa; 2nd quartile, MLNb/LNRb/LODDSb; 3rd quartile, MLNc/LNRc/LODDSc and 4th quartile: MLNd/LNRd/LODDSd). For each nomogram, the outcomes within subgroups were compared using Kaplan-Meier curves, and each group was found to represent a distinct prognosis (Figure 2A-2C).
As shown in Table 3, for patients within each LNR subgroup, the OS was homogenous when patients were divided according to MLNa-MLNd and LODDSa-LODDSd. However, for patients in the MLNc, MLNd, LODDSa, LODDSb, or LODDSc subgroup, OS differed significantly among the LNR subgroups. These results indicated that the LNR-based system had the best prognostic homogeneity within subgroups (Table 3).
Discussion
Accurate prediction of prognosis in patients with GC is essential for treatment and follow-up planning. Traditionally, the outcomes of resectable GC are predicted on the basis of tumor invasion depth and LN status, which are involved in the AJCC staging. However, these clinicopathological factors cannot present a complete prognostic picture, since other clinicopathological factors such as THNs that may be associated with prognosis are not considered [7, 8]. Two ratio-based LN-staging systems, namely, the LNR and LODDS systems, were proposed to refine prognosis prediction, and both have shown better performance than MLN-based staging in many studies [13-17]. However, the findings were inconsistent in studies that only included patients who had undergone D2 lymphadenectomy [13, 16, 18, 19]: Sun et al. [13] and Qiu et al. [16] found that the LODDS-based system had the greatest discriminatory power, while Liu et al. [19] found that it was the LNR-based system; Xu et al. [18] found that all three systems had comparable power. Similarly, Sun et al. [13] found that the LODDS-based had the best prognostic homogeneity, while Liu et al. [19] identified the LNR-based system as the one with the best prognostic homogeneity. In contrast, Xu et al. [18] found that all three systems had similar prognostic homogeneity within the LN substages.
The inconsistencies among these studies are most likely due to differences in analysis methodology. Since all three LN-staging systems are closely correlated, it is methodologically inappropriate to use stepwise model selection to determine the best-performing staging system [13, 15, 19], as was done in the studies by Sun et al. [13] and Liu et al. [19]. In addition, it is necessary to compare the prognostic performances of the nodal staging systems based on multivariate models to account for potential confounding. However, some of the studies that performed this analysis did not report the specific variables that were included in the multivariate models along with the nodal variables [14, 18]. Moreover, there is still no consensus on the ideal cutoff values for the three LN-staging systems, and the prognostic accuracy of all three systems reportedly improves when they are treated as continuous covariates [14]. In the present study, multivariate regression models were fitted when the MLN, LNR, and LODDS variables were assessed as continuous covariates, and prognostic nomograms were developed from these models to provide intuitive illustrations of these models. No significant differences in discriminatory power were found among the nomograms when MLN, LNR, and LODDS were assessed as continuous covariates. This was probably because of the close correlation among the three LN variables, as shown in Supplementary Figure 1.
The homogeneity within subgroups is considered an important feature to identify an ideal staging system [26]. In previous studies, patients were traditionally grouped according to substages of MLN/LNR/LODDS, in order to assess the prognostic homogeneity of the LN-staging systems within substages [13, 19]. However, in these studies, the effects of other significant prognosticators (e.g., T stage) on survival were not accounted for when establishing the cutoffs for MLN, LNR and LODDS. Therefore in the present study, patients were stratified by the total points, that is, the predicted OS in the MLN-, LNR-, or LODDS-based nomograms, which incorporated the effect of MLN, LNR, or LODDS, respectively, along with other significant prognosticcators for OS prediction. Using this method, we demonstrated that the LNR-based system has the best prognostic homogeneity within the nomogram-based substages, which is consistent with another study of patients with D2-resected GC [19].
Based on the results of the ACTS-GC and CLASSIC trials [20, 21], AC is recommended as the standard treatment for patients with local advanced GC undergoing D2 resection. In the present study of patients with D2-resected GC treated with AC, the MLN-, LNR-, and LODDS-based nomgrams showed comparable discriminatory abilities, while the LNR-based nomogram showed better prognostic homogeneity than the other two nomograms, suggesting that the LNR-based system is the best-performing prognostic model for these patients. Yet, thorough dissection and examination of LNs remains essential for accurate prediction of prognosis even in patients receiving AC, as the discrimination of all three LN-staging systems was considerably better when THNs exceeded 15 than when it was ≤15, which was consistent with previous studies [14, 17].
Figure 2
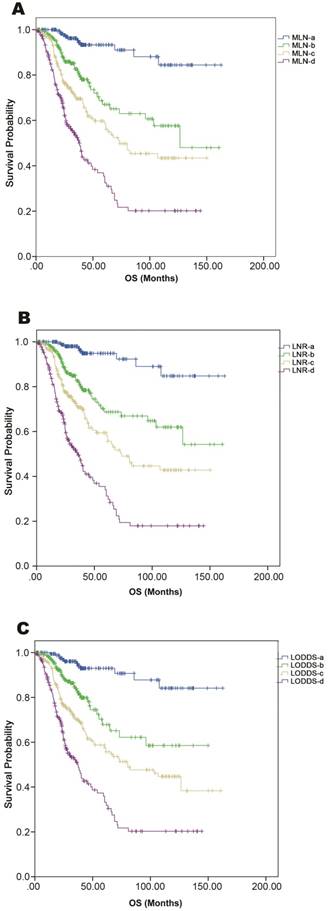
Kaplan-Meier curves of OS among patients grouped according to the quartiles of nomogram-predicted OS. Comparison of survival curves in (A) MLN-based, (B) LNR-based, and (C) LODDS-based nomograms.
Table 3
Overall survival (OS) rates on the basis of MLN and LODDS subgroups according to LNR subgroups
| LNR-a | LNR-b | LNR-c | LNR-d | P valuea | |||||
|---|---|---|---|---|---|---|---|---|---|
| No. | 5-y OS | No. | 5-y OS | No. | 5-y OS | No. | 5-y OS | ||
| MLN subgroups | |||||||||
| MLN-a | 182 | 91% | 17 | 84.4% | 0 | - | 0 | - | 0.18 |
| MLN-b | 0 | - | 201 | 75.8% | 19 | 68.6% | 0 | - | 0.39 |
| MLN-c | 0 | - | 18 | 68.0% | 176 | 57.0% | 9 | 31.1% | 0.04 |
| MLN-d | 0 | - | 0 | - | 16 | 57.7% | 167 | 22.9% | 0.01 |
| P valueb | - | 0.46 | 0.34 | 0.08 | |||||
| LODDS subgroups | |||||||||
| LODDS-a | 167 | 90% | 14 | 74.0% | 0 | - | 0 | - | 0.20 |
| LODDS-b | 15 | 100% | 186 | 76.6% | 40 | 68.1% | 0 | - | 0.02 |
| LODDS-c | 0 | - | 36 | 68.8% | 147 | 56.7% | 21 | 23.5% | <0.01 |
| LODDS-d | 0 | - | 0 | - | 20 | 60.9% | 155 | 22.5% | <0.01 |
| P valuec | 0.23 | 0.33 | 0.58 | 0.57 | |||||
MLN, metastatic lymph node; LNR, lymph node ratio; LODDS, log ratio of metastatic lymph node; C-index, concordance index.
a: Comparison of OS rates within different LNR subgroups. Bold P values have statistical significance (i.e., P < 0.05)
b: Comparison of OS rates within different MLN subgroups. Bold P values have statistical significance (i.e., P < 0.05)
c: Comparison of OS rates within different LODDS subgroups. Bold P values have statistical significance (i.e., P < 0.05)
The present study has some limitations. The wide time span (1998-2013) of this study resulted in the inclusion of a number of patients (19.6%) with ≤15 THNs after D2 lymphadenectomy, among whom the inadequate removal of LNs might have been influenced by factors that were not accounted for, because of the respective nature of this study. We did not exclude this group of patients in order to assess the performances of LN-staging systems in real-world clinical practice and draw comprehensive conclusions. Additionally, there might be certain discrepancies between the numbers of LNs dissected and counted. Nevertheless, our hospital is a high-volume center, and D2 lymphadenectomy followed by node counting is performed by experienced surgeons, which may have partially controlled these discrepancies. Moreover, there might be a concern with regard to the complexity of prognostic nomograms in comparison with the AJCC staging system. However, although the nomogram requires information on various prognostic factors beyond TNM stages, it is still a convenient tool which allows intuitive estimation of the survival probabilities of patients. In contrast, the AJCC staging system can only classify patients into several risk groups without telling the estimated survival probabilities of these subgroups. Furthermore, a “point” prediction of patient prognosis is available in nomograms, and hence there is no need to categorize continuous variables—the nodal staging variables in this study, avoiding potential biases from arbitrarily determined cutoff values. Finally, although the bootstrap-corrected C-indices for the three nomograms were comparable to previously reported C-indices in nomograms regarding resected GC (range, 0.68-0.80) [27-32], our nomograms were developed from a retrospective Chinese cohort and need to be externally validated using datasets from other countries, as well as using prospective cohorts.
Conclusion
To the best of our knowledge, this is not only the first study to assess the performances of MLN-, LNR-, and LODDS-based prognostic systems in patients with D2-resected GC receiving AC, but also the first to perform nomogram-based grouping for assessing the prognostic homogeneity of these systems. This study provides solid evidence that the LNR-based prognostic system is superior to the MLN- and LODDS-based systems in predicting patient OS for patients with locally advanced GC who receive AC after D2 lymphadenectomy, and further studies are warranted to verify the usefulness of LNR in the prognosis, follow-up and treatment planning for these patients.
Supplementary Material
Supplementary figures and tables.
Acknowledgements
We thank the staff of Department of Gastric Surgery, Sun Yat-Sen University Cancer Center for their constructive suggestions.
Competing Interests
The authors have declared that no competing interest exists.
References
1. Torre LA, Bray F, Siegel RL, Ferlay J, Lortet-Tieulent J, Jemal A. Global cancer statistics, 2012. CA Cancer J Clin. 2015;65:87-108
2. Chen W, Zheng R, Zeng H, Zhang S. The updated incidences and mortalities of major cancers in China, 2011. Chin J Cancer. 2015;34:53
3. Chen W, Zheng R, Baade PD, Zhang S, Zeng H, Bray F. et al. Cancer statistics in China, 2015. CA Cancer J Clin. 2016;66:115-32
4. Hohenberger P, Gretschel S. Gastric cancer. Lancet. 2003;362:305-15
5. Dicken BJ, Bigam DL, Cass C, Mackey JR, Joy AA, Hamilton SM. Gastric adenocarcinoma: review and considerations for future directions. Ann Surg. 2005;241:27-39
6. Zhang WH, Chen XZ, Liu K, Chen XL, Yang K, Zhang B. et al. Outcomes of surgical treatment for gastric cancer patients: 11-year experience of a Chinese high-volume hospital. Med Oncol. 2014;31:150
7. Smith DD, Schwarz RR, Schwarz RE. Impact of total lymph node count on staging and survival after gastrectomy for gastric cancer: data from a large US-population database. J Clin Oncol. 2005;23:7114-24
8. Schwarz RE, Smith DD. Clinical impact of lymphadenectomy extent in resectable gastric cancer of advanced stage. Ann Surg Oncol. 2007;14:317-28
9. Morgan JW, Ji L, Friedman G, Senthil M, Dyke C, Lum SS. The role of the cancer center when using lymph node count as a quality measure for gastric cancer surgery. JAMA Surg. 2015;150:37-43
10. Lee HK, Yang HK, Kim WH, Lee KU, Choe KJ, Kim JP. Influence of the number of lymph nodes examined on staging of gastric cancer. Br J Surg. 2001;88:1408-12
11. Shen JY, Kim S, Cheong JH, Kim YI, Hyung WJ, Choi WH. et al. The impact of total retrieved lymph nodes on staging and survival of patients with pT3 gastric cancer. Cancer. 2007;110:745-51
12. Wang W, Xu DZ, Li YF, Guan YX, Sun XW, Chen YB. et al. Tumor-ratio-metastasis staging system as an alternative to the 7th edition UICC TNM system in gastric cancer after D2 resection-results of a single-institution study of 1343 Chinese patients. Ann Oncol. 2011;22:2049-56
13. Sun Z, Xu Y, Li de M, Wang ZN, Zhu GL, Huang BJ. et al. Log odds of positive lymph nodes: a novel prognostic indicator superior to the number-based and the ratio-based N category for gastric cancer patients with R0 resection. Cancer. 2010;116:2571-80
14. Spolverato G, Ejaz A, Kim Y, Squires MH, Poultsides G, Fields RC. et al. Prognostic Performance of Different Lymph Node Staging Systems After Curative Intent Resection for Gastric Adenocarcinoma. Ann Surg. 2015
15. Calero A, Escrig-Sos J, Mingol F, Arroyo A, Martinez-Ramos D, de Juan M. et al. Usefulness of the log odds of positive lymph nodes to predict and discriminate prognosis in gastric carcinomas. J Gastrointest Surg. 2015;19:813-20
16. Qiu MZ, Qiu HJ, Wang ZQ, Ren C, Wang DS, Zhang DS. et al. The tumor-log odds of positive lymph nodes-metastasis staging system, a promising new staging system for gastric cancer after D2 resection in China. PLoS One. 2012;7:e31736
17. Wang X, Appleby DH, Zhang X, Gan L, Wang JJ, Wan F. Comparison of three lymph node staging schemes for predicting outcome in patients with gastric cancer. Br J Surg. 2013;100:505-14
18. Xu J, Bian YH, Jin X, Cao H. Prognostic assessment of different metastatic lymph node staging methods for gastric cancer after D2 resection. World J Gastroenterol. 2013;19:1975-83
19. Liu H, Deng J, Zhang R, Hao X, Jiao X, Liang H. The RML of lymph node metastasis was superior to the LODDS for evaluating the prognosis of gastric cancer. Int J Surg. 2013;11:419-24
20. Sasako M, Sakuramoto S, Katai H, Kinoshita T, Furukawa H, Yamaguchi T. et al. Five-year outcomes of a randomized phase III trial comparing adjuvant chemotherapy with S-1 versus surgery alone in stage II or III gastric cancer. J Clin Oncol. 2011;29:4387-93
21. Noh SH, Park SR, Yang H-K, Chung HC, Chung I-J, Kim S-W. et al. Adjuvant capecitabine plus oxaliplatin for gastric cancer after D2 gastrectomy (CLASSIC): 5-year follow-up of an open-label, randomised phase 3 trial. The Lancet Oncology. 2014;15:1389-96
22. National Comprehensive Cancer Network (NCCN). NCCN clinical practice guidelines in oncology (NCCN guidelines): gastric cancer. Available from URL:http://www.nccn.org/professionals/physician_gls/f_guidelines_nojava.asp [accessed January 15, 2017].
23. Leigh JP. Assessing the importance of an independent variable in multiple regression: is stepwise unwise? J Clin Epidemiol. 1988;41:669-77
24. Royston P, Sauerbrei W. Multivariable modeling with cubic regression splines: A principled approach. Stata Journal. 2007;7:45-70
25. Iasonos A, Schrag D, Raj GV, Panageas KS. How to build and interpret a nomogram for cancer prognosis. J Clin Oncol. 2008;26:1364-70
26. Ueno S, Tanabe G, Sako K, Hiwaki T, Hokotate H, Fukukura Y. et al. Discrimination value of the new western prognostic system (CLIP score) for hepatocellular carcinoma in 662 Japanese patients. Cancer of the Liver Italian Program. Hepatology. 2001;34:529-34
27. Kattan MW, Karpeh MS, Mazumdar M, Brennan MF. Postoperative nomogram for disease-specific survival after an R0 resection for gastric carcinoma. J Clin Oncol. 2003;21:3647-50
28. Han DS, Suh YS, Kong SH, Lee HJ, Choi Y, Aikou S. et al. Nomogram predicting long-term survival after d2 gastrectomy for gastric cancer. J Clin Oncol. 2012;30:3834-40
29. Kim Y, Spolverato G, Ejaz A, Squires MH, Poultsides G, Fields RC. et al. A nomogram to predict overall survival and disease-free survival after curative resection of gastric adenocarcinoma. Ann Surg Oncol. 2015;22:1828-35
30. Song KY, Park YG, Jeon HM, Park CH. A nomogram for predicting individual survival of patients with gastric cancer who underwent radical surgery with extended lymph node dissection. Gastric Cancer. 2014;17:287-93
31. Lai JF, Kim S, Kim K, Li C, Oh SJ, Hyung WJ. et al. Prediction of recurrence of early gastric cancer after curative resection. Ann Surg Oncol. 2009;16:1896-902
32. Dikken JL, Baser RE, Gonen M, Kattan MW, Shah MA, Verheij M. et al. Conditional probability of survival nomogram for 1-, 2-, and 3-year survivors after an R0 resection for gastric cancer. Ann Surg Oncol. 2013;20:1623-30
Author contact
![]() Corresponding author: Rui-Hua Xu, Department of Medical Oncology; Sun Yat-Sen University Cancer Center, 651 Dong Feng Road East, Guangzhou 510060, China; Tel and Fax: +86-20-8734 3468; E-mail: xurhorg.cn. Feng Wang, Department of Medical Oncology; Sun Yat-Sen University Cancer Center, 651 Dong Feng Road East, Guangzhou 510060, China; Tel and Fax: +86-20-8734 3795; E-mail: wangfengorg.cn.
Corresponding author: Rui-Hua Xu, Department of Medical Oncology; Sun Yat-Sen University Cancer Center, 651 Dong Feng Road East, Guangzhou 510060, China; Tel and Fax: +86-20-8734 3468; E-mail: xurhorg.cn. Feng Wang, Department of Medical Oncology; Sun Yat-Sen University Cancer Center, 651 Dong Feng Road East, Guangzhou 510060, China; Tel and Fax: +86-20-8734 3795; E-mail: wangfengorg.cn.
Citation styles
APA
Zhou, Y.X., Yang, L.P., Wang, Z.X., He, M.M., Yun, J.P., Zhang, D.S., Wang, F., Xu, R.H. (2018). Lymph node staging systems in patients with gastric cancer treated with D2 resection plus adjuvant chemotherapy. Journal of Cancer, 9(4), 660-666. https://doi.org/10.7150/jca.22016.
ACS
Zhou, Y.X.; Yang, L.P.; Wang, Z.X.; He, M.M.; Yun, J.P.; Zhang, D.S.; Wang, F.; Xu, R.H. Lymph node staging systems in patients with gastric cancer treated with D2 resection plus adjuvant chemotherapy. J. Cancer 2018, 9 (4), 660-666. DOI: 10.7150/jca.22016.
NLM
Zhou YX, Yang LP, Wang ZX, He MM, Yun JP, Zhang DS, Wang F, Xu RH. Lymph node staging systems in patients with gastric cancer treated with D2 resection plus adjuvant chemotherapy. J Cancer 2018; 9(4):660-666. doi:10.7150/jca.22016. https://www.jcancer.org/v09p0660.htm
CSE
Zhou YX, Yang LP, Wang ZX, He MM, Yun JP, Zhang DS, Wang F, Xu RH. 2018. Lymph node staging systems in patients with gastric cancer treated with D2 resection plus adjuvant chemotherapy. J Cancer. 9(4):660-666.
This is an open access article distributed under the terms of the Creative Commons Attribution (CC BY-NC) license (https://creativecommons.org/licenses/by-nc/4.0/). See http://ivyspring.com/terms for full terms and conditions.