Impact Factor ISSN: 1837-9664

 Global reach, higher impact
J Cancer 2018; 9(2):275-287. doi:10.7150/jca.22176 This issue Cite
Research Paper
Immunotherapy of patient with hepatocellular carcinoma using cytotoxic T lymphocytes ex vivo activated with tumor antigen-pulsed dendritic cells
Ying Wang1,2*, Xijing Yang3*, Yi Yu1, Zenghui Xu1, Yan Sun4, Hui Liu1, Jingbo Cheng4, Min Liu1, Bibo Sha1, Linfang Li1, Na Ding4, Zhong Li4, Huajun Jin1 ![]() , Qijun Qian1,3,4,5
, Qijun Qian1,3,4,5 ![]()
1. Department of Gene and Viral Therapy Laboratory, Shanghai Eastern Hepatobiliary Surgery Hospital, Shanghai, 200438, China;
2. Department of Life Science and Technology, Tongji University, Shanghai, 200092, China;
3. Department of Biotherapy, Shanghai Eastern Hepatobiliary Surgery Hospital, Shanghai, 200438, China;
4. Shanghai Cell Therapy Research Institute, Qianyang Road 75A, Shanghai, 201805, China;
5. Ningbo 5 th Hospital (Ningbo Cancer Hospital), Zhuangshi Avenue 1166, Ningbo, 315201, China.
* These authors contributed equally to this work
Received 2017-7-31; Accepted 2017-10-6; Published 2018-1-1
Abstract
Purpose The aim of this study was to evaluate the clinical response of immunotherapy with dendritic cell-cytotoxic T lymphocytes (DC-CTLs) in patients with hepatocellular carcinoma (HCC).
Method Sixty-eight patients with a confirmed diagnosis of HCC and who received follow-up until December 2015 were enrolled. We measured immune phenotypes of DCs and activated T cells using flow cytometry and clinical indexes using an electrochemiluminescence method.
Results DCs exhibited up-regulation of the maturation markers CD83, CD80, CD11c, and CD86 on day8. Levels of IFN-γ and TNF-α were higher in the DCs pulsed with tumor-associated antigens (TAAs) than in DCs with a non-proliferative recombinant adenovirus. The percentage of regulatory T cells (Tregs) decreased in patients after DC-CTLs therapy. In addition, serum levels of AFP, AFP-L3, ALT, and CA19-9 were significantly reduced in these patients. Quality of life was improved, especially on physical functioning scales. Median overall survival (OS) and progression-free survival (PFS) were 8.2 months and 4.3 months, respectively, for the control group and 12.8 months and 9 months, respectively, for the DC-CTL group. Patients treated with DC-CTLs therapy showed a statistically significant PFS and OS curve (OS: p=0.016; PFS: p<0.0001). In addition, no serious adverse reactions were observed.
Conclusion This study indicated that Tregs, as well as serum levels of AFP, AFP-L3, ALT, and CA19-9, which were correlated with a poor prognosis, decreased after DC-CTL treatments. The OS, PFS and the quality of life of HCC patients partially improved.
Keywords: Dendritic cell-cytotoxic T lymphocyte, immunotherapy, Treg, quality of life.
Introduction
HCC is one of the most common malignant cancers in China, which accounts for approximately 90% of all primary liver cancers (PLC). Surgery, orthotopic liver transplantation (OLT), hepatic-artery chemoembolization (TACE), percutaneous intra-tumor ethanol injection (PEI), hepatic artery ligation (HAL) with catheterized chemotherapy, and molecularly targeted therapy are the common therapeutic treatments for HCC [1, 2]. However, treating HCC remains difficult and challenging. Sorafenib has been shown to improve survival in the treatment of HCC. However, only a limited number of patients have responded beneficially [3]. Prognosis of HCC remains poor, and HCC-related mortality is high [4].
Nowadays, immunotherapy using DC-based antigen-specific CTLs has been used in clinical trials for the treatment of various malignant tumors [5-7]. DCs from the peripheral blood of patients were transfected with recombinant adenoviruses containing TAAs and produced high levels of IL-12 in response. Mature DCs co-cultured with T cells induced the activation of CTLs and promoted a tumor-killing effect of antigen-specific T cells that may provide effective adjuvant therapy for malignant tumors. Several studies have focused on the study of DC-based antigen-specific immunotherapy for HCC. Bray investigated the response of AFP-derived peptide-pulsed DC on immunity in patients with HCC [8]. Pardee compared the efficacy of antigen-specific CD8+ and CD4+ T cells using different forms of AFP fragments [9]. Zhou et al. used Hep3B cells that were transduced with recombinant adenoviruses carrying a human IFN-α promoter and an IFN‑γ gene to improve the effect of tumor-specific CTL against HCC [10]. O'Beirne et al. assessed the function of GPC-3 specific T cells in HCC [11]. Moreover, DC-CTLs therapy additionally held promise for the treatment of other malignant tumors, including non-small cell lung cancer (NSCLC) [12] and prostate cancer [13].
Therefore, it is important to determine the appropriate TAAs for DC activation and DC-CTLs therapy [14]. Several TAAs, such as TP53, Survivin, human telomerase reverse-transcriptase (hTERT), WT-1, and VEGFR2, frequently express on the cell surface of many malignant cancers including HCC and have been identified as promising TAAs for T cell recognition or DC-based immunotherapy [15-18]. Although TAAs, including TP53, hTERT, and Survivin, have been used as DC vaccines in clinical trials against tumors [19-21], it is still uncertain whether these antigen-primed DCs can be used for enhancing the response of CTLs in patients with HCC.
During our prophase research [22], we preliminary evaluated the changes of Tregs, MDSCs, AFP, CA19-9, CA242 and CA724 in five malignant tumors. To further study the comprehensive potential value of DC-CTL therapy for HCC patients, we investigated the activities of expanded and activated DCs and CTLs; analyzed the changes in the serological index and levels of CD3, CD4, CD8 and Tregs; and assessed the clinical response of OS, PFS and quality of life in HCC patients treated with DC-CTLs therapy.
Materials and Methods
Patients
A total of 42 pathologically diagnosed HCC patients have signed informed consent forms approved by the Department of Health of Chinese PLA, and they received immunotherapy at Eastern Hepatobiliary Surgery Hospital from January 2012 to December 2014.Twenty-six other patients, who were enrolled as control group, did not receive DC-CTLs immunotherapy. The study is non-randomized because we don't have enough patients to be randomized into two arms at the same time. The inclusion criteria included as follows:
1) The diagnosis was confirmed by pathology of HCC
2) Difficult or refusal to undergo surgery
3) Child-Pugh score <=9 (Class A or B)
4) Clinical Oncology Group Eastern (ECOG) score of 0, 1
5) Liver, kidney and blood tests meet the following criteria:
WBC>4×10⁹/L, Neutrophils cells>1×10⁹/L, Lymphocyte cells>1×10⁹/L, Hemoglobin>=100g/L and Platelet>=80×109/L. The prothrombin time is in a reference range or not extends for more than 3 seconds. Urea nitrogen and serum creatinine do not exceed 1.5 times of the upper limitation.
6) Sign the informed consent form before joining into this study.
Patients were excluded from the study based on the following criteria:
1) Autoimmune disease or organ transplant history undergoing immunosuppressive therapy
2) Human immunodeficiency virus (HIV) infection, syphilis infection
3) Image evidence of positive or infected blood culture
4) Cell therapy allergies history, cytokines (such as interleukins) allergic history
5) Uncontrolled heart, lung, kidney, digestion, nerve, metabolism, infectious diseases, mental illness, etc. or other serious diseases
6) Pregnant women
As shown in Table 1, 16 patients (n=5 in the control group; n=11 in the DC-CTL therapy group) underwent adjuvant radiation treatment, and 52 patients (n=21 in the control group; n=31 in the DC-CTL therapy group) received TACE therapy.
Demographics and clinical characteristics
| Cases (%) (n=68) | Control group (%) (n=26) | DC-CTL group (%) (n=42) | P-Value | |
|---|---|---|---|---|
| Sex | 0.745 | |||
| Male | 59 (86.8%) | 23 (88.5%) | 36 (85.7%) | |
| Female | 9 (13.2%) | 3 (11.5%) | 6 (14.3%) | |
| Age | 0.720 | |||
| <57 | 40 (58.8%) | 16 (61.5%) | 24 (57.1%) | |
| >=57 | 28 (41.2%) | 10 (38.5%) | 18 (42.9%) | |
| Median (range) | 57 (27-80) | 52 (30-80) | 57 (27-78) | |
| Radiotherapy | 0.511 | |||
| Yes | 16 (23.5%) | 5 (19.2%) | 11 (26.2%) | |
| No | 52 (76.5%) | 21 (80.8%) | 31 (73.8%) | |
| TACE therapy | 0.511 | |||
| Yes | 52 (76.5%) | 21 (80.8%) | 31 (73.8%) | |
| No | 16 (23.5%) | 5 (19.2%) | 11 (26.2%) | |
| T stage | 0.596 | |||
| T2 | 11 (16.2%) | 3 (11.5%) | 8 (19.0%) | |
| T3 | 49 (72.1%) | 19 (73.1%) | 30 (71.4%) | |
| T4 | 8 (11.8%) | 4 (15.4%) | 4 (9.5%) | |
| N stage | 0.811 | |||
| N0 | 42 (61.8%) | 17 (65.4%) | 25 (59.5%) | |
| N1 | 22 (32.4%) | 8 (30.8%) | 14 (33.3%) | |
| N2 | 4 (5.9%) | 1 (3.8%) | 3 (7.1%) | |
| M stage | 0.128 | |||
| M0 | 49 (72.1%) | 16 (61.5%) | 33 (78.6%) | |
| M1 | 19 (27.9%) | 10 (38.5%) | 9 (21.4%) | |
| TNM stage | 0.293 | |||
| II | 35 (51.5%) | 12 (46.2%) | 23 (54.8%) | |
| III | 14 (20.6%) | 4 (15.4%) | 10 (23.8%) | |
| IV | 19 (27.9%) | 10 (38.5%) | 9 (21.4%) |
Construction and production of recombinant adenoviruses that encode tumor-associated antigens
A replication-defective adenovirus containing the expression cassette of the required TAAs (TP53, hTERT and Survivin) was constructed, purified, and titrated according to the procedure described previously [23]. In brief, each expression cassette of the TAA was inserted into the shuttle vector of the recombinant adenoviral system and placed into the E1 region of the adenoviral genome. Then, the recombinant adenoviruses were purified by high-performance liquid chromatography. Titers of the purified adenoviruses were determined by plaque assays of the tissue culture infectious dose 50 methods and shown as plaque-forming units per milliliter (pfu/ml). The sequences of TP53, hTERT and Survivin are recorded in Supplementary Table S1.
Generation of mature DCs with cancer-associated antigens
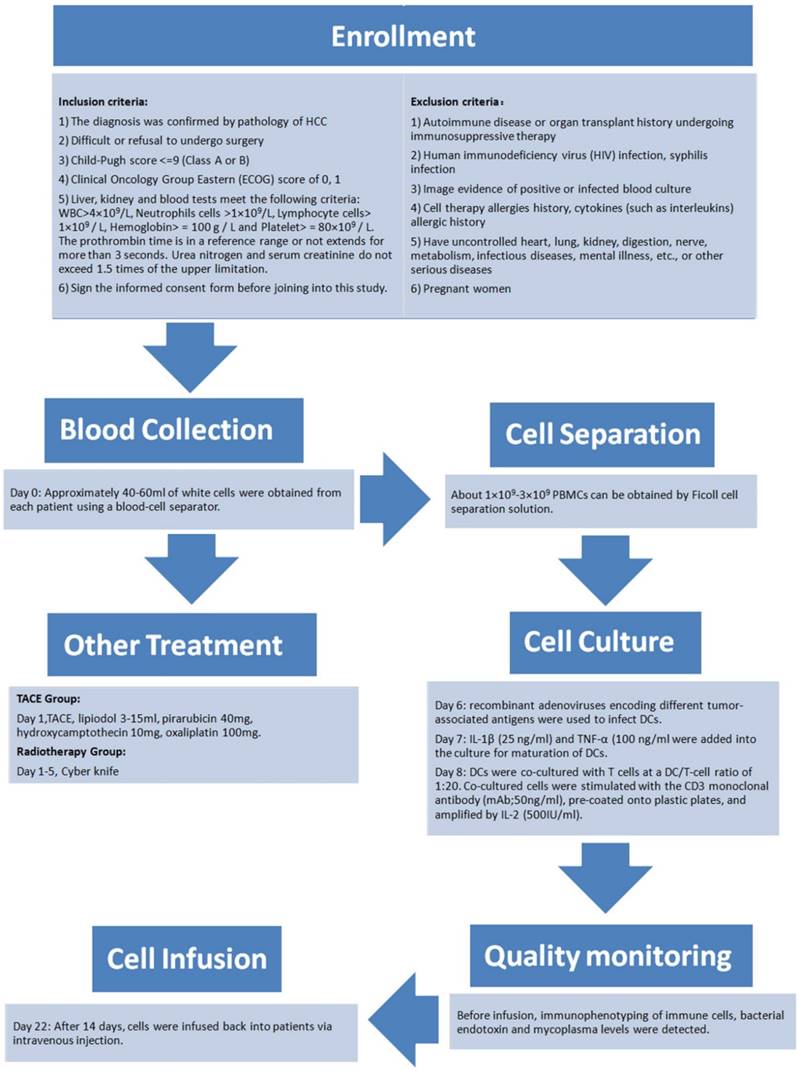
Approximately 40-60ml of white cells was obtained from each patient using a blood-cell separator (FreseniusKabi, Germany). The yield of peripheral blood mononuclear cells (PBMCs) ranged from 1×10⁹-3×10⁹ cells. Cells were washed twice with AIM-V cell-culture medium (Gibco, America), transferred into culture flasks, and cultured for 2 hours. Adherent cells were used for induction of DCs by adding 100ng/ml GM-CSF (PeproTech, America) and 100ng/ml IL-4 (PeproTech, America) to the AIM-V cell-culture solution. Remaining non-adherent cells from the remainder of the PBMCs were stored at -80℃ and thawed for co-cultivation. On day 6, recombinant adenoviruses encoding different TAAs were used to infect DCs (MOI=10). On day 7, IL-1β (25 ng/ml; Novoprotein, China) and TNF-α (100 ng/ml; Novoprotein, China) were added into the culture for maturation of DCs.
Preparation of CTLs
On day 8, TAAs loaded DCs were co-cultured with T cells at a DC/T-cell ratio of 1:20, stimulated with the CD3 monoclonal antibody (mAb; 50ng/ml; Novoprotein, China), pre-coated onto plastic plates, and amplified by IL-2 (500IU/ml; Quangang Pharmaceutical Co., China). On day 22, cells were infused back into patients via intravenous injection. For each treatment, approximately 3×10⁷ cells/kg body weight activated T cells were infused. The viability of cells should be over 95%.
Immunophenotyping of immune cells
Immune markers CD14, CD80, CD83, CD86 and CD11c for DC cells; CD3 and CD8 for CTL cells; and CD137 and CD69 (24h) for activated T cells were analyzed by flow cytometry on FC500 and Guava EasyCyte™ flow cytometers (Beckman Coulter, America; Merck Millipore, Germany). In addition, immune indicators were detected using the peripheral blood samples of patients before and after DC-CTLs treatments, and were accessed by the Department of Biotherapy, Eastern Hepatobiliary Surgery Hospital, Second Military Medical University (China). Monoclonal antibodies anti-CD3, -CD4, and -CD8 were used to evaluate T lymphocyte subgroups, and CD4+/CD25+/ CD127lo/- was used to evaluate Tregs. The proportion of Tregs was calculated by the ratio of CD25hiCD127lo/- cells to CD4+ cells. Flow cytometry data were analyzed by CXP software and GuavaSoft™ 3.1.1.
Cytokine analysis via intracellular cytokine staining (ICS)
Samples were divided into one unstimulated group (negative control) and two stimulated groups (positive control and DC-CTLs group). Samples in the stimulated groups were cultured with a 1X cell stimulation cocktail (eBioscience, America) containing phorbol 12-myristate 13-acetate (PMA), ionomycin, brefeldin A and monensin for 4-6 hours. Subsequently, the production of different cytokines, including IFN-γ, TNF-α, and IL-4, was detected using the Intracellular Fixation &Permeabilization Buffer Set Kit (Beckman Coulter, America).
IFN-γ detection by ELISA, ELISPOT and Cytometric Bead Array (CBA) assay
To assess the activation of antigen-specific T cells, levels of IFN-γ in infused cells were detected by ELISA, human IFN-γ ELISPOT kit (Dakewe, Shenzhen, China) and CBA assay (BD, America). CBA is a multiplexed assay that provides the ability to quantify multiple proteins within a given sample. The principle of CBA assays is to capture a soluble set of analytes with beads of known size and fluorescence, and sandwich complexes (capture bead + analyte + detection reagent) are formed, which can be measured using flow cytometry.
Quality monitoring
Infused cells were cultured to detect bacterial endotoxin and mycoplasma levels. In accordance with the Chinese Pharmacopoeia, the level of endotoxin was calculated using the following formula: L=K/M. L is the threshold level of bacterial endotoxin expressed in EU/mg or EU/u. K is the maximum acceptable endotoxin dosage per kilogram of body weight per hour in the prescribed route of administration in EU/kg/h. The default value was K=5EU/kg/h. M is the maximum acceptable dosage in humans per kilogram of body weight per hour. Weight was calculated as 60kg, and injection time (≤1h) was calculated as 1h. Our final product volume was 300ml, body weight was calculated as 60kg, and the time of infusion was 0.5 h. Therefore, the threshold of L was approximately 0.5EU. Microbial detection and Gramstaining were performed by a BacT/ALERT® 3D instrument (Biomerieux, America) and a PREVI® Color Gram staining system (Biomerieux, America). Mycoplasma testing was conducted using an ELISA method.
Detection of biochemical parameters and serological tumor markers
Levels oftotal bilirubin (TB), alanine transaminase (ALT), aspartate aminotransferase (AST), gamma-glutamyltransferase (GGT), alkaline phosphatase (AKP), serological tumor markers such as alpha fetoprotein (AFP), carcinoembryonic antigen (CEA), and carbohydrate antigen 19-9 (CA199), and the percentage of alpha fetoprotein L3 (AFP-L3%) were evaluated before and after immunotherapy in patients with HCC. Recommended cutoff-values for diagnostic purposes were 5.1-18.8μmol/L for TB, 0-41 U/L for ALT, 0-37 U/L for AST, 5-61 U/L for GGT, 35-129 U/L for AKP, 0-20 μg/L for AFP, 0-10 μg/L for CEA, 0-39 U/ml for CA199 and 0-10% for AFP-L3%.
Assessment of quality of life (QoL)
The EORTC QLQ-C30 questionnaire was designed by the European Organization for Research and Treatment of Cancer (EORTC) to assess specific quality of life issues relevant to cancer patients. The QLQ-C30 (version 3.0) measures health-related QoL from prior week using a global QoL scale, which includes five functional scales, three symptom scales, one quality of life scale, and six other unique items. Scale scores (range: 0-100) are re-scaled mean scores of their individual component items. Higher global QoL/functional scale scores indicate better QoL, however, higher symptom scale/item scores indicate a higher level of symptomatology. Scores from these scales were assessed using Chi-square tests, with significant results limited to p value <0.05. Telephone consultations were conducted for each patient regularly to complete the EORTC QLQ-C30 questionnaire one month after each cycle of DC-CTL treatment [24, 25].
Follow-up and survival rates
OS was defined as the time from the date of enrollment to the date of death due to the tumor or last follow-up. PFS was defined as the date of definitive treatment to the date of tumor recurrence or date of the last follow-up. Patients who were lost to follow-up were considered censored at their date of their last follow-up.
Statistical analysis
Results were presented as the mean ± standard deviation (mean ± SD). All data were analyzed by SPSS 22 software (SPSS, Chicago, IL, USA). Differences in demographic and clinical variables of the two groups were tested using the Pearson χ2 test. The Kaplan-Meier method was used to analyze PFS and OS. The log-rank test was used to compare differences in Kaplan-Meier estimates for each group. The Cox proportional hazards regression model was used for univariate analysis. Statistical significance of immune-markers was evaluated by a paired t-test. P values<0.05 were considered as statistically significant.
Results
Patient characteristics
The present study comprised a retrospective analysis of 68 patients (59 males and 9 females) with a median age of 57 (range: 27-80) years. All patients had a confirmed diagnosis of HCC between January 2012 and December 2014 with follow-ups until December 2015 and were divided into two cohorts (a control group and a DC-CTL group). As shown in Table 1, demographic data were comparable between the two groups. The data also indicated that there were no statistically significant differences between the two groups in terms of variables such as, sex, age, TNM stage, and recipient of either radiation therapy or TACE (p>0.05). Figure 1 showed the detailed schedule from enrollment, treatment, blood collection, cell separation, cell culture, quality monitoring and cell infusion.
The flow chart of the process of DC-CTLs therapy. The detailed schedule depicted enrollment, treatment, blood collection, cell separation, cell culture, quality monitoring and cell infusion.
Activities of expanded and activated DCs
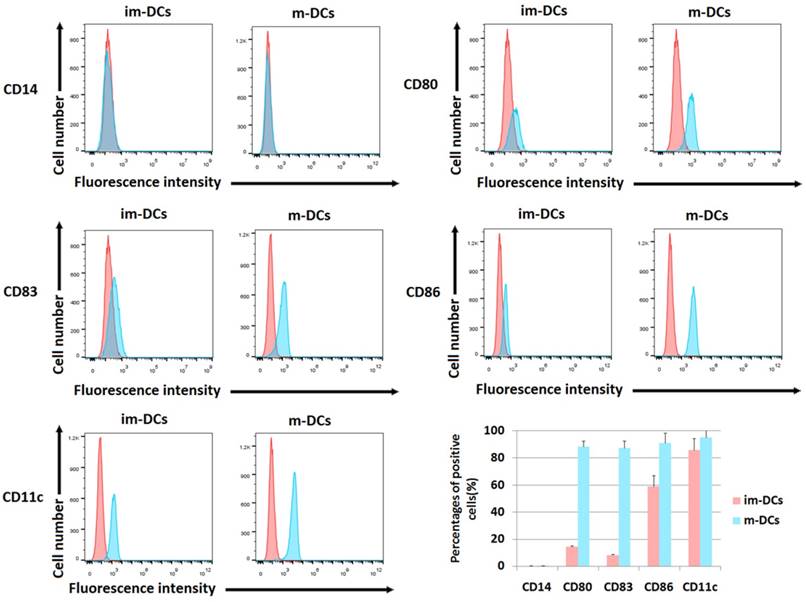
The differences of immune phenotypes between immature DCs and mature DCs, including levels of CD80, CD86, CD83, CD11c and CD14, were analyzed by flow cytometry as shown in Figure 2. Compared with immature DCs (im-DCs), mature DCs (m-DCs) highly expressed various DC markers, including the costimulatory proteins CD80 (88.55%±4.07%) and CD86 (91.16%±7.32%). Mature DCs also have up-regulated level of the DC activation marker CD83 (87.40%±5.08%). Additionally, when mature DCs evolved from monocytes, they lost the expression of CD14 (CD14 negative or CD14- DCs). CD11c, a type-I transmembrane protein, is found at a high level on most human DCs (95.24%±4.97%). In Figure 2, the flow cytometric dot plots showed the results from one representative experiment, and the barplot described the statistical analysis of the percentages of positive cells. DCs exhibited high-level expression of CD80, CD86, CD83 and CD11c on day 8, which confirmed the maturation of DCs after cultivation.
Surface phenotype analysis of DCs. Cells were harvested and processed for staining with the antibody, as indicated. The staining of markers is shown, and the percentage of positive cells is stated (*p<0.05, **p<0.005, ***p<0.0005, ****p<0.00005). The phenotypic analyses of mature DCs on day 8 were compared with immature DCs on day 4. The biomarkers included CD14, CD80, CD83, CD86, and CD11c. The red peak represents the isotype group. The barplot showed the percentage of cells expressing each biomarker. The proportion of positive cells was calculated on Y-axis.
Activities of expanded and activated DC-CTLs
We consistently tested the quality of the T cells by detecting the percentage of the activation markers CD69, CD28, and CD137 and the percentage of CD3+CD8+ CTLs. Among the cultivated CD3+ T cells, the population of activated CD69+ after 24h and CD28+ and CD137+ T cells after day 14 reached 91.16%±1.03%, 93.00%±5.49%, and 23.80%±4.57%, and CD3+CD8+ CTLs reached 87.71%±2.32%, respectively, which were higher than those in CIKs (CD69+: 31.23%±3.15%; CD28+: 51.87%±5.53%; CD137+: 2.19%±1.31%; CD8+: 60.4%±4.86%) and DC-CTLs without TAAs stimulation (CD69+: 54.3%±2.87%; CD28+: 62.13%±7.36%; CD137+: 6.07%±0.23%; CD8+: 73.83%±4.71%).
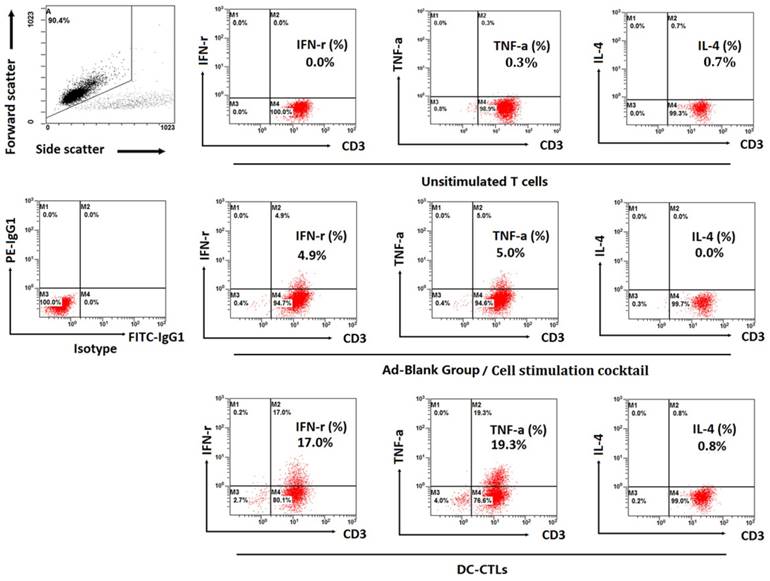
Production of intracellular cytokines was measured by ICS. IFN-γ and TNF-α exhibited higher levels during in vitro cultivation, and the proportion of T cells expressing IFN-γ and TNF-α was 17% and 19.3%, respectively, compared to unstimulated T cells and Ad-Blank DC-CTLs stimulated with a cell stimulation cocktail (Figure 3). The percentage of T cells that secreted IL-4, which generally decreases the production of IFN-γ, was less than 1%,
Detection of intracellular IFN-γ, TNF-α, IL-4 and IFN-γ concentrations in the supernatant. Dot plots show the proportion of T cells expressing IFN-γ, TNF-α, and IL-4. The top left plot represents the gating strategy. The bottom left plot represents the isotype group. The 2nd to 4th plots on the top represent unstimulated T cells, the 2nd to 4th plots in the middle represent the Ad-Blank group (the recombinant non-proliferative adenovirus without any expression cassettes of tumor-associated antigens) stimulated with the cell stimulation cocktail, and the 2nd to 4th plots on the bottom represent the production of cytokines by DC-induced antigen-specific CTL cells.
Furthermore, antigen-specific T cell responses were measured by ELISA and CBA assay. The production of IFN-γ reached 6756.53±145.96 pg/ml in re-fused cells compared with 1440.97±11.89 pg/ml in unstimulated controls (estimated via ELISA). In addition, the CBA assay showed that levels of IFN-γ were significantly higher in infused cells (7308.53±527.60 pg/ml) than in unstimulated controls (1145.94±179.16 pg/ml). The Elispot experiment showed that the DC-CTL group exhibited an average of 142 spots which highly increased spot numbers compared to the negative control with very few spots or none at all.
Quality monitoring
Cells were cultured for the detection of bacterial endotoxin and mycoplasma levels. All cultured samples met the release criteria for infusion.
Analysis of quality of life
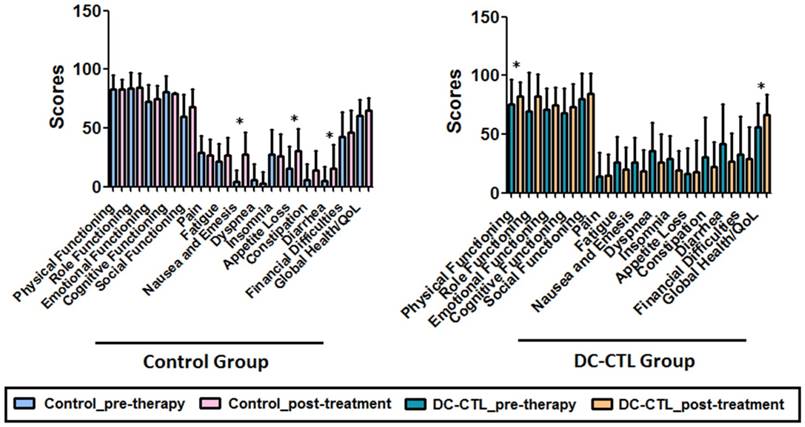
A pre- and post-treatment evaluation of the health-related quality of life in patients with HCC was conducted. During analysis of the EORTC QLQ-C30 questionnaire for the control group, patients who received conventional therapy had significantly higher scores for nausea and emesis, appetite loss, and diarrhea than pretreatment patients (p<0.05). Strikingly, the global health/quality of life score improved significantly in patients who underwent DC-CTLs therapy. Collectively, there was a statistically significant difference in life quality between the two groups (p=0.017), and the physical-functioning (PF) scale showed a strong improvement during the course of therapy (p=0.005). Fatigue, nausea and emesis, dyspnea, insomnia, constipation, and diarrhea decreased slightly during the course of immunotherapy but not significantly (Figure 4). The increased scores in the function scale/overall QoL and the decreased scores in the symptom scales showed an improved quality of life for patients with HCC who underwent DC-CTLs treatment.
Change in quality of life. The bar plot describes various scales for all the tumor patients measured at two visit times. The black bar represents the pre-immunotherapy visit, and the white bar indicates the last follow-up time after DC-CTL treatment. The X-axis represents the key scales of QLQ-C30, including, physical functioning (PF), role functioning (RF), emotional functioning (EF), cognitive functioning (CF), social functioning (SF), pain (PA), fatigue (FA), nausea and emesis (NV), dyspnea (DY), insomnia (SL), appetite loss (AP), constipation (CO), diarrhea (DI), financial difficulties (FD), and quality of life (QoL). The scale score was calculated and indicated on Y-axis. *Statistically significant differences (*p<=0.05, **p<=0.005)
Change of serological index
Considering the possible presence of clinical heterogeneity among patients, we employed Chi-square tests to evaluate clinical response. During analysis of the serological index of the DC-CTL group, we observed that the mean levels of AFP, AFP-L3, ALT, and CA199 were significantly lower after DC-CTL treatment (p=0.0437, p=0.0471, p=0.0037, p=0.0262, respectively) than the mean levels in pre-therapy patients. Patients who underwent DC-CTL therapy had lower average serum levels of AST and TB, although these differences were not highly significant (p>0.05). Nevertheless, there were no significant differences in these serological indexes before and after treatment in the control group (Figure 5a).
Change in clinical and immune indicators a. The boxplot describes various clinical indicators for all patients, before and after DC-CTL treatment. The X-axis represents crucial clinical indicators, including ALT, AFP, CA19-9, and the percentage of alpha-fetoprotein L3 (AFP-L3(%)). These values were calculated and indicated on the Y-axis (*p<0.05, **p<0.005). b. Changes in immune indicators, including CD3+, CD3+CD4+, CD3+CD8+, and Tregs, before and after DC-CTL treatment compared with patients in the control group (*p<0.05, **p<0.005, ***p<0.0005).
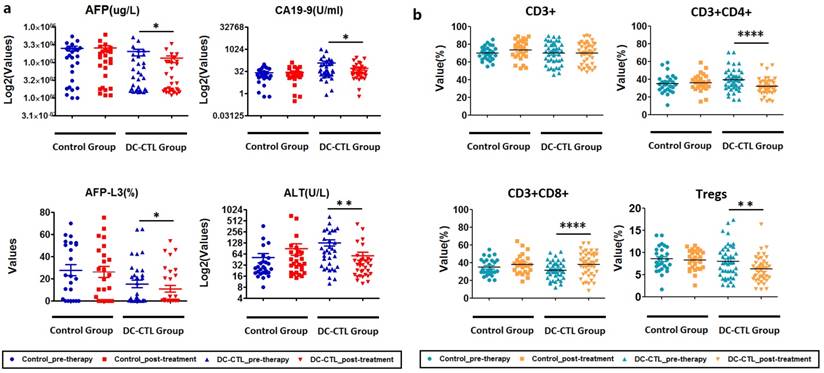
Treg cells decreased after DC-CTL immunotherapy
Subsequently, we investigated the changes of immune indicators, including CD3, CD4, CD8, and Treg, pre- and post-DC-CTL treatment. The 8 of 11 patients who received DC-CTL therapy showed a lower percentage of Tregs (<10%), and Tregs (%) in 26 of 42 patients decreased after treatment. The proportion of Treg cells reduced significantly in patients undergoing either radiotherapy or TACE (p=0.001422). Moreover, percentages of CD3+CD4+ T lymphocytes decreased significantly (p<0.0001), and the number of CD3+CD8+ T lymphocytes in the peripheral blood tended to increase (p<0.0001). In comparison, there were no statistically different changes in CD3+ cells (Figure 5b).
Overall survival and progression-free survival
Clinical factors were further evaluated by Cox proportional hazards regression analysis. Notably, DC-CTLs treatment showed a significant association with PFS and OS in the univariate analysis, although sex, age, TACE, radiotherapy, and TNM stages were not independent prognostic factors for OS and PFS (Table 2).
Univariate analysis of OS and PFS in patients
| Variables | OS | PFS | ||
|---|---|---|---|---|
| HR(95% Cl) | P | HR(95% Cl) | P | |
| Sex (male vs. female) | 0.482(0.194-1.215) | 0.122 | 0.535(0.212-1.351) | 0.186 |
| Age (<=57 vs. >57) | 0.709(0.409-1.230) | 0.221 | 1.206(0.693-2.100) | 0.508 |
| TACE therapy (no vs. yes) | 1.514(0.463-4.949) | 0.492 | 0.786(0.244-2.533) | 0.686 |
| Radiotherapy (no vs. yes) | 0.703(0.398-1.242) | 0.225 | 0.723(0.401-1.304) | 0.281 |
| Surgery (no vs. yes) | 1.759(0.901-3.435) | 0.098 | 1.074(0.539-2.139) | 0.839 |
| DC-CTL therapy (no vs. yes) | 1.928(1.117-3.327) | 0.018 | 2.671(1.536-4.645) | 0.001 |
| T (2 vs. 3,4) | 0.505(0.226-1.127) | 0.095 | 0.811(0.363-1.812) | 0.610 |
| N (0 vs. 1,2) | 1.308(0.737-2.321) | 0.358 | 1.063(0.593-1.905) | 0.837 |
| TNM Stage (IIA vs. IIB, IIC, III, IV) | 0.578(0.229-1.460) | 0.246 | 1.007(0.397-2.555) | 0.988 |
Abbreviation: CI, confidence interval.
We subsequently investigated whether this observation was related to DC-CTL treatment. Patients had periodic follow-up until December 2015. The median OS and PFS were 8.2 months and 4.3 months, respectively, for the control group and 12.8 months and 9 months, respectively, for the DC-CTL treatment group. Patients treated with DC-CTLs therapy showed a statistically significant PFS and OS curve compared with the control group (OS: p=0.016; PFS: p<0.0001; Figure 6a).
Survival analyses of patients with HCC Survival analyses were performed to estimate the prognosis of patients with HCC. The Kaplan-Meier method was used to compare survival rates between patients undergoing DC-CTL therapy combined with adjuvant strategies (the DC-CTL group) and those undergoing radiotherapy or TACE therapy alone (the control group). *Statistically significant differences (*p<0.05, **p<0.005). a. OS curves and PFS curves for all patients. b. OS curves and PFS curves for the radiotherapy subgroup. c. OS curves and PFS curves for the TACE therapy subgroup.
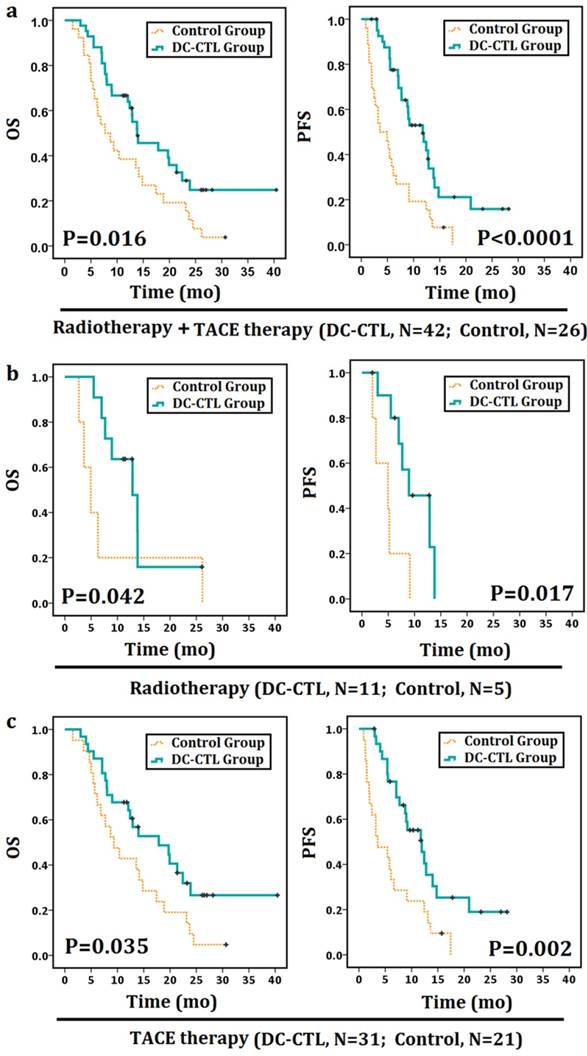
In addition, adjunctive therapies (TACE therapy or radiotherapy) could be associated with the prognosis of patients with HCC, while they may not be regarded as independent prognostic factors in Cox proportional hazards regression analysis. Therefore, we further compared OS and PFS in the TACE and radiotherapy subgroup. In a follow-up comparison of 1-year for OS and PFS between the TACE-alone and TACE+DC-CTL groups, OS increased from 42.9% to 64.5%, and PFS rates increased from 23.8% to 38.7%. Similarly, one-year OS rates increased from 20% to 45.5% in the radiotherapy + DC-CTL group compared with the radiotherapy-alone group. The median OS and PFS were 4.93 months for patients undergoing radiotherapy alone and 11.47 months and 7.67 months for those undergoing radiotherapy along with DC-CTL treatment (Figure 6b). Additionally, OS and PFS were 9.33 months and 3.57 months, respectively, for the TACE-alone group and 12.9 months and 9.2 months, respectively, for the DC-CTL treatment group. Patients in the DC-CTL group showed a statistically significant PFS and OS curve, respectively (PFS: p=0.017, p=0.002; OS: p=0.042, p=0.035; Figure 6c).
Safety
Side effects were recorded in 68 cases. There were no severe or unusual side effects, except for temporary fever. In total, 27 of 68 cases developed a fever during immunotherapy, and body temperature ranged from 37.5-40°C. Most of these patients recovered without any treatment. No side effects on the liver and kidney were found.
Discussion
Thus far, a number of agencies have carried out clinical trials and made progress in the use of DC-CTLs therapy in the treatment of metastatic renal-cell carcinoma, gastric cancer, and other malignancies [26]. Previous research reported that DC-based antigen-specific immunotherapy still faces some obstacles, including inefficient cultivation of DCs, TAAs alteration, and the presence of extrinsic regulators, including Tregs [14, 27]. Our study showed that a cocktail of TAAs-loaded DCs could enhance the response of CTLs against HCC.
In this study, we utilized automatic blood sampling via a blood-cell separator to improve the harvesting of DCs. This method is typically used in treatment of leukemia [28, 29], but it is less often reported in immunotherapy. According to the parameter setting, white cells are collected within several circuits, while the remainder of the blood components is returned to the patient via a returning chamber. In total, approximately 1×10⁹-3×10⁹ PBMCs can be obtained by Ficoll cell separation solution. Therefore, the number of DCs obtained from blood samples was significantly higher than those obtained by venipunctures. At present, we can collect 1×10⁹-3×10⁹ PBMC cells per 40-60ml of white blood cells via the blood cell separator as well as acquire approximately 1×10⁸ DCs per 40-60ml of white cells in vitro, which enables us to harvest sufficient DCs for cultivation. In addition, we compared DC markers between healthy donors and patients. Levels of maturation achieved by DCs were lower for patients than for donors. We determined that it was better to compare the change of DCs in the same patient because patients' DCs could not completely recover after in vitro stimulation.
Cytokines frequently play an important role in immunity, are involved in tumor progression, and provide crucial information regarding activated DC-CTLs. Several studies have suggested that the expression of IFN-γ and TNF-α in T cells is associated with the response of tumor-specific T cells, and this produces significant anti-tumor effects by inhibiting tumor-cell proliferation and promoting tumor cell apoptosis. Production of TNF-α and IFN-γ exert a strong synergistic boost to antigen-specific immune responses during DC-CTL immunotherapy [30-32]. Others indicated that the presence of IL-4 could markedly impair CD8+ T cell expansion and additionally inhibit IL-12 production by DCs and IFN-γ secretion [33-35]. Herein, we demonstrated that our approach increased expression levels of IFN-γ and TNF-α, indicating that antigen-specific T cells were activated.
Studies have confirmed the benefits and the safety aspects of DC-CTLs therapy for patients with HCC. We tested the quality of the infused cells and used a combination of indicators, including immune indicators, serological tumor markers, QoL, OS, PFS, and observed side effects, for an in-depth assessment of the treatment. We greatly decreased the proportion of Tregs, which contain potent anti-tumor immune-suppressive function in the immune system [36, 37]. A high level of Tregs is a prognostic factor, and it is regarded as an adverse factor in patients with malignant tumors. Compared with the Tregs proportion in control group, a higher percentage of Tregs was found in patients with HCC, possibly due to immune-dysfunction prior to treatment. Notably, in our study, a robust immune response was observed in patients with a reduced proportion of Tregs and CD4+ T cells as well as an increased proportion of CD8+ T cells. A series of serum biomarkers, such as AFP, AFP-L3, ALT, and CA199, are routinely tested in patients with HCC to reflect the clinical response after DC-CTLs therapy. AFP-L3 is calculated as the proportion of AFP-L3 over total AFP levels, which can be used with AFP as biomarkers to indicate HCC [38]. Previous studies have suggested that high serum AFP-L3% levels indicated a poor prognosis for HCC patients [39, 40]. Similarly, the serum level of CA19-9 is also found to be elevated in HCC patients, and it is considered as a predictor of survival for HCC [41]. In addition, a high serum level of ALT is commonly reported to indicate the status of liver injury [42]. Therefore, these clinical indexes may have significant prognostic value in HCC patients with low serum concentrations. A decrease of these clinical indicators simultaneously after DC-CTL treatment may reflect a therapeutic effect of this treatment on HCC. The side effects and toxicity of DC-CTLs therapy were mild and easily controllable. The response of DC-CTLs immunotherapy is well tolerated by patients who were unable or unwilling to experience the adverse side effects of conventional therapies. The results of DC-CTL treatment showed that the treatment significantly improved the global health of patients (QoL score, p-value<0.05).
In this study, we measured long-term effects of DC-CTLs therapy on 68 patients. However, similar studies are needed in the future with a larger number of patients suffering from different types of tumors to further investigate the clinical response of this approach. We have developed an immunotherapeutic strategy for the treatment of patients with HCC, but further optimization strategies are still required. Previous report has elaborated on neo-antigens in cancer immunotherapy and personalized antigens for cancer treatment [43]. Therefore, at present, further optimization of protocols for cell isolation and standardization of the cocktail of TAAs is being attempted. A novel cocktail of TAAs, such as ERBB1, ERBB2, ERBB3, ERBB4, MAGE-A1, MAGE-A3, GPC3 and MUC1, as well as several personalized antigens for patients, such as the use of AFP or CEA antigens for therapy in patients with AFP+ or CEA+, are being investigated in our further studies to improve the anti-tumor effects of DC-CTLs immunotherapy and prolong survival of patients.
In summary, we improved the existing protocol for harvesting high-quality sufficient DCs, and we investigated the effect of DC-CTLs therapy on patients with HCC. Our results showed that it significantly reduced the proportion of Tregs as well as several specific clinical indexes, including AFP, AFP-L3, ALT and CA19-9. The DC-CTLs treatment may preserve or improve the quality of life in patients who have invasive cancers. These findings indicate the role of the DC-CTLs therapy in patients with HCC.
Abbreviations
AFP: Alpha fetoprotein; AKP: Alkaline phosphatase; ALT: Alanine transaminase; AST: Aspartate aminotransferase; CA199: Carbohydrate antigen 19-9; CBA: Cytometric bead array; CEA: Carcinoembryonic antigen; DC-CTLs: Dendritic cell-cytotoxic T lymphocytes; EORTC: The European Organization for Research and Treatment of Cancer; GGT: Gamma-glutamyl transferase; HAL: Hepatic artery ligation; HCC: Hepatocellular carcinoma; hTERT: Human telomerase reverse-transcriptase; ICS: Intracellular cytokine staining; OLT: Orthotopic liver transplantation; OS: Overall survival; PBMCs: Peripheral blood mononuclear cells; PEI: Percutaneous intra-tumor ethanol injection; PF: Physical-functioning; PFS: Progression-free survival; PLC: Primary liver cancers; PMA: Phorbol 12-myristate 13-acetate; QoL: Quality of life; TAAs: Tumor-associated antigens; TACE: Transarterial chemoembolization; TB: Total bilirubin; Tregs: Regulatory T cells.
Supplementary Material
Supplementary Table S1.
Acknowledgements
This work was supported by the National Natural Science Foundation of China (grant numbers 81672997, 31601075, 81573023 and 81301307), and the Capacity Building Project of Shanghai Engineering Research Center (16DZ2281000).
Compliance with Ethical Standards
The trial was approved by the Committee on Medical Ethics of Eastern Hepatobiliary Surgical Hospital. All patients in our trial have signed informed consents.
Competing Interests
The authors have declared that no competing interest exists.
References
1. Buonaguro L, Petrizzo A, Tagliamonte M. et al. Challenges in cancer vaccine development for hepatocellular carcinoma. J Hepatol. 2013;59(4):897-903
2. Wu MC. Clinical research advances in primary liver cancer. World J Gastroenterol. 1998;4(6):471-474
3. Doyle A, Marsh P, Gill R. et al. Sorafenib in the treatment of hepatocellular carcinoma: a multi-centre real-world study. Scand J Gastroenterol. 2016;51:979-985
4. Palmer DH, Midgley RS, Mirza N. et al. A phase II study of adoptive immunotherapy using dendritic cells pulsed with tumor lysate in patients with hepatocellular carcinoma. Hepatology. 2009;49(1):124-132
5. El Ansary M, Mogawer S, Elhamid SA. et al. Immunotherapy by autologous dendritic cell vaccine in patients with advanced HCC. J Cancer Res Clin Oncol. 2013;139(1):39-48
6. Cui Y, Yang X, Zhu W. et al. Immune response, clinical outcome and safety of dendritic cell vaccine in combination with cytokine-induced killer cell therapy in cancer patients. Oncol Lett. 2013;6(2):537-541
7. Choi D, Kim TG, Sung YC. The past, present, and future of adoptive T cell therapy. Immune Netw. 2012;12(4):139-147
8. Bray SM, Vujanovic L, Butterfield LH. Dendritic cell-based vaccines positively impact natural killer and regulatory T cells in hepatocellular carcinoma patients. Clin Dev Immunol. 2011;2011:249281
9. Pardee AD, Yano H, Weinstein AM. et al. Route of antigen delivery impacts the immunostimulatory activity of dendritic cell-based vaccines for hepatocellular carcinoma. J Immunother Cancer. 2015;3:32
10. Zhou J, Ma P, Li J. et al. Improvement of the cytotoxic T lymphocyte response against hepatocellular carcinoma by transduction of cancer cells with an adeno-associated virus carrying the interferon-gamma gene. Mol Med Rep. 2016;13(4):3197-3205
11. O'Beirne J, Farzaneh F, Harrison PM. Generation of functional CD8+ T cells by human dendritic cells expressing glypican-3 epitopes. J Exp Clin Cancer Res. 2010;29:48
12. Liu X, Li J, Liu Y. et al. Calreticulin acts as an adjuvant to promote dendritic cell maturation and enhances antigen-specific cytotoxic T lymphocyte responses against non-small cell lung cancer cells. Cell Immunol. 2016;300:46-53
13. Sui CG, Wu D, Meng FD. et al. Anti-prostate cancer effects of CTL cell induction in vitro by recombinant adenovirus mediated PSMA/4-1BBL dendritic cells: an immunotherapy study. Genet Mol Res. 2015;14(2):7208-7217
14. Wang X, Zhang FC, Zhao HY. et al. Human IP10-scFv and DC-induced CTL synergistically inhibit the growth of glioma in a xenograft model. Tumour Biol. 2014;35(8):7781-7791
15. Zhang Y, Li Q, Liu N. et al. Detection of MAGE-1, MAGE-3 and AFP mRNA as multimarker by real-time quantitative PCR assay: a possible predictor of hematogenous micrometastasis of hepatocellular carcinoma. Hepatogastroenterology. 2008;55(88):2200-2206
16. Dong J, Wang L, Tian YP. et al. hTERT single nucleotide polymorphism is associated with increased risks of hepatocellular carcinoma and tumor metastasis. Nan Fang Yi Ke Da Xue Xue Bao. 2011;31(1):49-52
17. Cioca A, Cimpean A, Ceausu R. et al. Crosstalk between EGFR and p53 in hepatocellular carcinoma. Asian Pac J Cancer Prev. 2014;15(19):8069-8073
18. Or YY, Chow AK, Ng L. et al. Survivin depletion inhibits tumor growth and enhances chemosensitivity in hepatocellular carcinoma. Mol Med Rep. 2014;10(4):2025-2030
19. Cicinnati VR, Zhang X, Yu Z. et al. Increased frequencies of CD8+ T lymphocytes recognizing wild-type p53-derived epitopes in peripheral blood correlate with presence of epitope loss tumor variants in patients with hepatocellular carcinoma. Int J Cancer. 2006;119(12):2851-2860
20. Mizukoshi E, Nakagawa H, Kitahara M. et al. Immunological features of T cells induced by human telomerase reverse transcriptase-derived peptides in patients with hepatocellular carcinoma. Cancer Lett. 2015;364(2):98-105
21. Kollgaard T, Ugurel-Becker S, Idorn M. et al. Pre-Vaccination Frequencies of Th17 Cells Correlate with Vaccine-Induced T-Cell Responses to Survivin-Derived Peptide Epitopes. PLoS One. 2015;10(7):e0131934
22. Wang Y, Xu Z, Zhou F. et al. The combination of dendritic cells-cytotoxic T lymphocytes/cytokine-induced killer (DC-CTL/CIK) therapy exerts immune and clinical responses in patients with malignant tumors. Exp Hematol Oncol. 2015;4:32
23. Chen J, Su C, Lu Q. et al. Generation of adenovirus-mediated anti-CD20 antibody and its effect on B-cell deletion in mice and nonhuman primate cynomolgus monkey. Mol Cancer Ther. 2008;7(6):1562-1568
24. Aaronson NK, Ahmedzai S, Bergman B. et al. The European Organization for Research and Treatment of Cancer QLQ-C30: a quality-of-life instrument for use in international clinical trials in oncology. J Natl Cancer Inst. 1993;85(5):365-376
25. Greimel ER, Kuljanic Vlasic K, Waldenstrom AC. et al. The European Organization for Research and Treatment of Cancer (EORTC) Quality-of-Life questionnaire cervical cancer module: EORTC QLQ-CX24. Cancer. 2006;107(8):1812-1822
26. Tada F, Abe M, Hirooka M. et al. Phase I/II study of immunotherapy using tumor antigen-pulsed dendritic cells in patients with hepatocellular carcinoma. Int J Oncol. 2012;41(5):1601-1609
27. Ahmed MS, Bae YS. Dendritic cell-based therapeutic cancer vaccines: past, present and future. Clin Exp Vaccine Res. 2014;3(2):113-116
28. Gonye S, Horvath Z. Experiences with automatic blood cell count devices with special reference to the hematologic examination of bovine leukosis. Arch Exp Veterinarmed. 1971;25(4):765-768
29. Komatsu F, Ishida Y. Efficient collection of peripheral blood stem cells using the Fresenius AS104 in chronic myelocytic leukemia patients with very high numbers of platelets. J Hematother. 1997;6(2):133-136
30. Schoenborn JR, Wilson CB. Regulation of interferon-gamma during innate and adaptive immune responses. Adv Immunol. 2007;96:41-101
31. Ghanekar SA, Nomura LE, Suni MA. et al. Gamma interferon expression in CD8(+) T cells is a marker for circulating cytotoxic T lymphocytes that recognize an HLA A2-restricted epitope of human cytomegalovirus phosphoprotein pp65. Clin Diagn Lab Immunol. 2001;8(3):628-631
32. Liu F, Hu X, Zimmerman M. et al. TNFalpha cooperates with IFN-gamma to repress Bcl-xL expression to sensitize metastatic colon carcinoma cells to TRAIL-mediated apoptosis. PloS one. 2011;6(1):e16241
33. Dittmer U, Peterson KE, Messer R. et al. Role of interleukin-4 (IL-4), IL-12, and gamma interferon in primary and vaccine-primed immune responses to Friend retrovirus infection. J Virol. 2001;75(2):654-660
34. Yao Y, Li W, Kaplan MH. et al. Interleukin (IL)-4 inhibits IL-10 to promote IL-12 production by dendritic cells. J Exp Med. 2005;201(12):1899-1903
35. Marsland BJ, Schmitz N, Kopf M. IL-4Ralpha signaling is important for CD8+ T cell cytotoxicity in the absence of CD4+ T cell help. Eur J Immunol. 2005;35(5):1391-1398
36. Heeren AM, Koster BD, Samuels S. et al. High and interrelated rates of PD-L1+CD14+ antigen-presenting cells and regulatory T cells mark the microenvironment of metastatic lymph nodes from patients with cervical cancer. Cancer Immunol Res. 2015;3(1):48-58
37. Weiss JM, Subleski JJ, Back T. et al. Regulatory T cells and myeloid-derived suppressor cells in the tumor microenvironment undergo Fas-dependent cell death during IL-2/alphaCD40 therapy. J Immunol. 2014;192(12):5821-5829
38. Yamamoto K, Imamura H, Matsuyama Y. et al. AFP, AFP-L3, DCP, and GP73 as markers for monitoring treatment response and recurrence and as surrogate markers of clinicopathological variables of HCC. J Gastroenterol. 2010;45(12):1272-1282
39. Cheng J, Wang W, Zhang Y. et al. Prognostic role of pre-treatment serum AFP-L3% in hepatocellular carcinoma: systematic review and meta-analysis. PLoS One. 2014;9(1):e87011
40. Li D, Mallory T, Satomura S. AFP-L3: a new generation of tumor marker for hepatocellular carcinoma. Clin Chim Acta. 2001;313(1-2):15-19
41. Chen YL, Chen CH, Hu RH. et al. Elevated preoperative serum CA19-9 levels in patients with hepatocellular carcinoma is associated with poor prognosis after resection. ScientificWorldJournal. 2013;2013:380797
42. Kim HC, Nam CM, Jee SH. et al. Normal serum aminotransferase concentration and risk of mortality from liver diseases: prospective cohort study. BMJ. 2004;328(7446):983
43. Schumacher TN, Schreiber RD. Neoantigens in cancer immunotherapy. Science. 2015;348(6230):69-74
Author contact
![]() Corresponding authors: Emails: qianqjcn, hj-jincom
Corresponding authors: Emails: qianqjcn, hj-jincom