Impact Factor ISSN: 1837-9664

 Global reach, higher impact
J Cancer 2017; 8(16):3362-3370. doi:10.7150/jca.20917 This issue Cite
Research Paper
Alkaline Phosphatase-To-Albumin Ratio as a Prognostic Indicator in Pancreatic Ductal Adenocarcinoma after Curative Resection
Ning Pu1*, Shanshan Gao2, 3*, Yadong Xu1, Guochao Zhao1, Yang Lv1, Abulimiti Nuerxiati1, Jian-ang Li1, Dansong Wang1, Xuefeng Xu1, Tiantao Kuang1, Xiaolin Wang2, 3, Wenhui Lou1, Lingxiao Liu2, 3 ![]() , Wenchuan Wu1
, Wenchuan Wu1 ![]()
1. Department of General Surgery, Zhongshan Hospital, Institute of General Surgery and Shanghai Medical College, Fudan University, Shanghai, 200032, People's Republic of China;
2. Department of Interventional Radiology, Zhongshan Hospital and Shanghai Medical College, Fudan University, Shanghai, 200032, People's Republic of China;
3. Shanghai Institute of Medical Imaging, Shanghai, 200032, People's Republic of China.
* These authors contributed equally to this work
Received 2017-5-8; Accepted 2017-8-31; Published 2017-9-20
Abstract
Background: The prognosis of pancreatic ductal adenocarcinoma (PDAC) remains poor and the models for survival prediction in PDAC patients after curative resection are still limited. Preoperative alkaline phosphatase-to-albumin ratio (APAR), an original inflammation-based score, has been established to analyze the prognostic significance in PDAC. Therefore, in this study, we aim to formulate a valuable prognostic nomogram for PDAC following curative resection.
Methods: A total of 354 patients with PDAC undergoing curative resection were retrospectively enrolled in this study. The prognostic value of APAR was analyzed in primary cohort containing 220 randomly selected PDAC patients with curative resection and prognostic nomogram incorporating APAR into the American Joint Commission on Cancer (AJCC) 8th edition was established to obtain superior discriminatory abilities. The predictive performance of APAR was further validated in another independent cohort of 134 PDAC patients.
Results: Patients with higher serum APAR level were probable to sustain poorer overall survival (OS). Significant positive correlations were found between APAR and tumor site, and several serum biochemical indexes, such as aspartate aminotransferase (AST), alanine aminotransferase (ALT), etc. The results of multivariate analysis showed, APAR was also identified as an independent prognostic indicator for OS in both primary and validation cohorts (P=0.004, P=0.038, respectively). Compared with the AJCC 8th edition, the nomogram consisting of APAR, pathological differentiation and the TNM staging system of AJCC 8th edition showed superior predictive accuracy for OS. All these results were further verified in the validation cohort.
Conclusions: APAR can be considered as a novel independent prognostic biomarker for PDAC following curative resection. One more accurate and advanced predictive model will be achieved via the incorporation of APAR into nomogram.
Keywords: pancreatic ductal adenocarcinoma, alkaline phosphatase-to-albumin ratio, prognosis, nomogram, decision curve analysis.
Introduction
As prognosis of many cancers has improved a lot during the past two decades, pancreatic ductal adenocarcinoma (PDAC), a quite aggressive cancer, has changed slightly. In the United States, it is the fourth leading cause of cancer-related deaths and is still dismally poor at less than 8% in the 5-year overall survival (OS) 1, 2. The morbidity and mortality of PDAC has been graded as the seventh most familiar cancer and further the ninth leading cause of cancer-related mortalities in China3, 4. Surgical resection is the only way potential for a curative treatment, however it remains to limit the survival of PDAC patients5, 6. Therefore, it is required urgently to develop new biomarkers that are technically feasible and clinically easy-accessible to stratify the prognosis of PDAC patients after curative resection.
The TNM staging system of the American Joint Commission on Cancer (AJCC) eighth edition was commonly used for the classification and prognostic predictor of PDAC7. In the TNM staging system, tumor size and lymph node metastasis were considered as independent indicators for prognosis6, 8, however, issues on whether other non-TNM indicators should be joined in risk stratification stayed controversial. In addition, the AJCC 8th edition was still cumbersome and deficiently formulated for the prognosis prediction following operative resection.
It had been confirmed that Inflammation played a vital role in the carcinogenesis and prognosis of many tumors with malignance9. Due to the tumor was adjacent to or invaded the biliary ducts, which may easily cause chronic cholangitis or hepatitis. This indicated inflammation was obviously related to the tumorgenesis of PDAC10, 11. Furthermore, many studies had identified inflammation-based scores as prognostic indicators of PDAC, such as neutrophil-lymphocyte ratio (NLR), C-reactive protein/albumin (CRP/Alb) ratio, platelet-to-albumin ratio (PAR) and lymphocyte-to-monocyte ratio (LMR) 4, 12-14. Therefore, it is quite reasonable to further excavate inflammation-based score for prognostic prediction of PDAC patients.
Liver function test, a common routine blood test to assess liver function, is one of the routine examinations before surgery. Alkaline phosphatase (ALP) is a kind of the hydrolase, which is concentrated on liver, bile duct and kidney15. Clinically serum ALP level is associated with obstructive jaundice, primary hepatic carcinoma, cholangiolitic hepatitis and so on16, 17. Additionally, it was confirmed that elevated serum ALP level predicted poor prognosis in various cancers, such as liver cancer and prostate cancer18-20. In accordance to those studies, recent study proved that elevated serum ALP level served as an independent predictor of PDAC with poor prognosis21. Albumin (ALB) is synthesized by hepatocytes that manifests the condition of nutrition and maintains the plasma colloid osmotic pressure and substantial transportation22. With the systemic inflammation, ALB eliminates the nitrogen species and active oxygen, while it reduces in itself23, 24. Many studies affirmed that ALB alone or based markers were correlated with survival in various cancers23, 25-27. Similarly, ALB alone or based markers were confirmed as independent predictors of PDAC with poor survival14, 28, 29. ALP associated with ALB as a predictor had been applied into several other cancers19, 30, however, the value of prediction in PDAC was still not identified.
Taken together, we logically derived a novel inflammatory marker, alkaline phosphatase-to-albumin (APAR), and further dug into the correlations of clinicopathological characteristics and prognostic value of APAR in training and validation cohort of PDAC undergoing curative resection. Additionally, we managed to refine a novel prognostic model through developing a nomogram incorporating APAR into the newly TNM staging system of AJCC 8th edition.
Materials and Methods
Patient selection
Two independent cohorts containing a total 354 patients with PDAC who underwent curative resection in Zhongshan Hospital, Fudan University from January 2007 to May 2016 were enrolled and analyzed retrospectively in this study. All the patients were divided into two subgroups through digital random table: the first 220 patients were termed as training cohort and the remaining 134 as validation cohort. All enrolled patients met the inclusion and exclusion criteria as follows: (1) exact diagnosis of histologically proven PDAC and no preoperative anticancer treatments resulting in any bias; (2) no history or concurrence of other malignant cancers; (3) complete removal with no macroscopic tumors and free of cancer in the resection margin via pathological examination; (4) with complete clinicopathological and follow-up data; (5) no infectious evidence or history of hematological diseases and inflammatory diseases except for viral hepatitis; (6) no distant metastasis or uncertain origins.
Conventional clinicopathologic variables containing gender, age, tumor size, site, pathological differentiation, vascular invasion and laboratory tests including cancer antigen(CA)19-9, carcino embryonie antigen (CEA), blood routine, total bilirubin (TBIL), ALB, aspartate aminotransferase (AST), alanine aminotransferase (ALT), gamma-glutamyltransferase (GGT), ALP, lactate dehydrogenase (LDH) and glucose were routinely examined within 5 days before the surgery. All these information was collected from record system by one surgeon, and checked by another. Histopathological and clinical staging was evaluated by TNM staging system of AJCC 8th edition via postoperative histopathological examination and clinical assessment. APAR was calculated with the equation: APAR= serum alkaline phosphatase level/ serum albumin level ratio.
Follow-up
Postoperative follow-up in regular style was carried out with all patients, including physical and laboratory examinations - blood routines, biochemical items and serological tumor biomarkers were evaluated every 3 months for the first 2 years, every 6 months for next 3 years, and once a year afterwards. Magnetic resonance imaging (MRI) or enhanced abdominal computed tomography (CT) scans were routinely performed for every 6 months. The OS was calculated from the date of surgery to the time of death or July 2016. Informed consents were obtained from all patients and this study was approved by the Clinical Research Ethic Committee of Zhongshan Hospital, Fudan University.
Statistical analysis
Statistical analyses were performed by SPSS 21.0 (SPSS Inc., Chicago, IL, USA) and R project version 3.3.3 (http://www.r-project.org/). The optimal cut-off values for the APAR were determined through receiver operating characteristic curve (ROC) analysis. The association between APAR and clinicopathologic variables was analyzed using Pearson Chisquared test, Fisher's exact test or Mann-Whitney U test as appropriate. The survival curve was studied in Kaplan-Meier analyses by using the log-rank test. The Cox proportional hazards regression model was used for univariate and multivariate analyses, and P <0.05 was considered statistically significant.
Prognostic nomograms based on AJCC 8th edition, pathological differentiation and the APAR were performed by the rms package in R project. The performance of the nomogram was evaluated by concordance index(C-index), calibration curve and the decision curve analysis (DCA) as previously described31.
Results
Clinicopathological characteristics
The detailed clinicopathological characteristics in training and validation groups were showed in Table 1. For the whole study population, there were 224 males and 130 females, with an average age of 62.2±9.4 years and the median follow-up time was 15 months ranging from 1 to 105 months. The OS rates at 1, 2 and 3 years were 61.4%, 31.2% and 18.6% respectively. In the training set, 141 patients were diagnosed with PDAC located at pancreatic head, while 102 patients in the validation set. 5 patients suffered from well differentiation based on pathological analysis, whereas 83 patients were observed in moderate differentiation and 133 patients in poor differentiation in the training set. For the validation set, 4, 53 and 77 patients represented well, moderate and poor differentiation respectively. According to the AJCC 8th edition, 79 patients were diagnosed with stage I tumor, 111 with stage II tumor and 30 with stage III tumor in the training set, while the number of patients in the validation set classified into I, II, III stage were 50, 53 and 31 respectively.
Correlation between APAR and clinicopathological characteristics of patients with PDAC.
| Variables | Training cohort | Validation cohort | ||||
|---|---|---|---|---|---|---|
| APAR≤ 2.16 (n=98) | APAR> 2.16 (n=122) | P-value | APAR≤ 2.16 (n=35) | APAR> 2.16 (n=99) | P-value | |
| Gender, male/female | 57 / 41 | 75 / 47 | 0.618 | 23 / 12 | 69 / 30 | 0.662 |
| Age, < 60/ ≥ 60 | 41 / 57 | 42 / 80 | 0.260 | 9 / 26 | 39 / 60 | 0.147 |
| Tumor site, head/ body or tail | 39 / 59 | 102 / 20 | <0.001 | 11 / 24 | 91 / 8 | <0.001 |
| Tumor differentiation, well/moderate/poor | 2 / 40 / 56 | 3 / 43 / 76 | 0.694 | 0 / 13 / 22 | 4 / 40 / 55 | 0.422 |
| Vascular invasion, yes/ no | 87 / 11 | 111 / 11 | 0.587 | 29 / 6 | 85 / 14 | 0.668 |
| Tumor size, ≤4/>4 cm | 64 / 34 | 98 / 24 | 0.012 | 24 / 11 | 68 / 31 | 0.990 |
| TNM stage, I/ II/ III | 32 / 51 / 15 | 47 / 60 / 15 | 0.615 | 13 / 13 / 9 | 37 / 40 / 22 | 0.902 |
| CA19-9, <37/≥37 U/L | 30 / 68 | 21 / 101 | 0.019 | 10 / 25 | 16 / 83 | 0.111 |
| CEA, < 5/ ≥ 5 ng/mL | 77 / 21 | 82 / 40 | 0.061 | 26 / 9 | 68 / 31 | 0.534 |
| TBIL,≤20.4/>20.4μmol/L | 96 / 2 | 40 / 82 | <0.001 | 34 / 1 | 22 / 77 | <0.001 |
| ALB, <35/≥35 g/L | 8 / 80 | 28 / 94 | 0.003 | 2 / 33 | 38 / 61 | <0.001 |
| GGT, ≤60/>60 U/L | 84 / 14 | 20 / 102 | <0.001 | 29 / 6 | 16 / 83 | <0.001 |
| AST, ≤40/>40 U/L | 93 / 5 | 32 / 90 | <0.001 | 32 / 3 | 18 / 81 | <0.001 |
| ALT, ≤35/>35 U/L | 93 / 5 | 35 / 87 | <0.001 | 33 / 2 | 25 / 74 | <0.001 |
| ALP, ≤125/>125 U/L | 97 / 1 | 24 / 98 | <0.001 | 35 / 0 | 20 / 79 | <0.001 |
| LDH, ≤245/>245 U/L | 95 / 3 | 86 / 36 | <0.001 | 33 / 2 | 56 / 43 | <0.001 |
| Glucose,≤5.6/>5.6mmol/L | 50 / 48 | 48 / 74 | 0.083 | 14 / 21 | 44 / 55 | 0.648 |
CA19-9, cancer antigen 19-9; CEA, carcino embryonie antigen; TBIL, total bilirubin; ALB, albumin; AST, aspartate aminotransferase; ALT, alanine aminotransferase; GGT, gamma-glutamyl transpeptidase; ALP, alkaline phosphatase; LDH, lactate dehydrogenase; APAR, alkaline phosphatase-to-albumin ratio; P-value < 0.05 marked in bold font shows statistical significant.
Relationship between APAR and clinicopathologic characteristics in PDAC patients
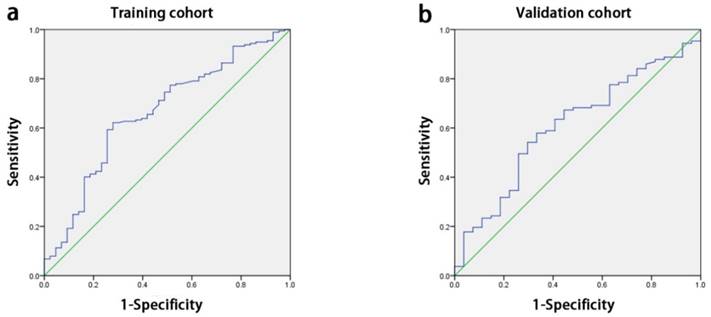
The median APAR of all enrolled patients was 3.2 (range: 0.4-50). With the receiver operating characteristic curve (ROC) analysis, the optimal cut-off value for APAR was 2.16 for OS prediction, so did the other inflammation-based score in Table 1. The area below the curve was 0.662 for OS (Fig. 1a).
ROC curves for OS. The area under the curve for APAR was 0.662 in the training cohort (a) and 0.609 in the validation cohort (b). ROC, receiver-operator characteristic; OS, overall survival; APAR, alkaline phosphatase-to-albumin ratio.
The low-risk cohort (APAR≤ 2.16) and high-risk cohort (APAR> 2.16) were determined within all enrolled patients. As shown in Table 1, high-risk APAR cohort was 55.5% (112 out of 220) and 73.9% (99 out of 134) in the training set and validation set respectively. Intriguingly, significant positive associations were found in primary group and further affirmed in validation group between the high-risk cohort and tumor sites (both P<0.001), TBIL (both P<0.001), elevated ALB (P=0.003 and P<0.001 respectively), GGT (both P<0.001), AST (both P<0.001), ALT (both P<0.001), ALP (both P<0.001), LDH (both P<0.001). Furthermore, the high-risk cohort was related to larger tumor size (P=0.012) and increased CA19-9 (P=0.019) in the training set.
Prognostic significance of APAR for PDAC
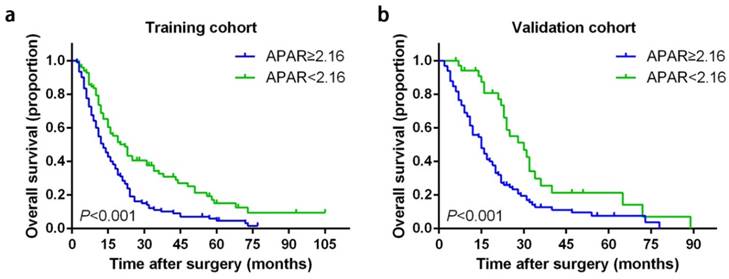
APAR larger than 2.16 was correlated with poor prognosis significantly in terms of OS than low-risk cohort in both independent cohorts (Table 2 and Fig. 2). In the training set, the 1-, 2- and 3-year OS rates in high-risk APAR cohort and low-risk APAR cohort were 50.6%, 19.1%, 10.6% and 68.9%, 42%, 32.7%, respectively, while 55.7%, 25.3%, 12% and 85.3%, 58.8%, 25.6%, respectively in the validation set.
Univariate analysis of prognostic factors associated with overall survival.
| Variables | Overall survival | |||||
|---|---|---|---|---|---|---|
| Training cohort | Validation cohort | |||||
| Patients (n=220 ) | P-value | HR (95% CI) | Patients (n= 134) | P-value | HR (95% CI) | |
| Gender, male/female | 132/88 | 0.547 | 1.098 (0.810-1.489) | 92/42 | 0.577 | 0.887 (0.583-1.350) |
| Age, years (median, range) | 61.61, 35-80 | 0.471 | 0.995 (0.980-1.009) | 63.16,41-84 | 0.452 | 0.992 (0.971-1.013) |
| Tumor site, head/body or tail | 141/79 | 0.329 | 0.854 (0.623-1.172) | 102/32 | 0.179 | 0.724 (0.451-1.160) |
| Tumor differentiation, well/moderate/poor | 5/83/132 | 0.007 | 1.467 (1.108-1.943) | 4/53/77 | 0.001 | 1.792 (1.254-2.559) |
| Vascular invasion, yes/ no | 198/22 | 0.307 | 1.282 (0.796-2.066) | 114/20 | 0.576 | 1.170 (0.675-2.029) |
| Tumor size, ≤ 4/ > 4 cm | 162/58 | 0.922 | 1.017 (0.725-1.428) | 92/42 | 0.070 | 1.448 (0.970-2.161) |
| TNM stage, I/ II/ III | 79/111/30 | <0.001 | 1.466 (1.188-1.810) | 50/53/31 | 0.009 | 1.389 (1.084-1.780) |
| CA19-9, < 37/ ≥ 37 U/L | 51/169 | 0.181 | 1.273 (0.894-1.814) | 26/108 | 0.009 | 2.084 (1.197-3.628) |
| CEA, < 5/ ≥ 5 ng/mL | 159/61 | 0.036 | 1.420 (1.023-1.971) | 94/40 | 0.002 | 1.939 (1.283-2.929) |
| TBIL, ≤ 20.4/ > 20.4 μmol/L | 136/84 | 0.157 | 1.242 (0.920-1.677) | 56/78 | 0.021 | 1.597 (1.074-2.374) |
| ALB, < 35/ ≥ 35 g/L | 36/184 | 0.150 | 0.757 (0.518-1.106) | 40/94 | 0.007 | 0.565 (0.372-0.858) |
| GGT, ≤ 60/ > 60 U/L | 104/116 | 0.016 | 1.443 (1.072-1.942) | 45/89 | 0.012 | 1.704 (1.123-2.587) |
| AST, ≤ 40/ > 40 U/L | 125/95 | 0.101 | 1.281 (0.953-1.722) | 50/84 | 0.061 | 1.479 (0.983-2.226) |
| ALT, ≤ 35/ > 35 U/L | 128/92 | 0.065 | 1.322 (0.983-1.778) | 58/76 | 0.080 | 1.419 (0.959-2.099) |
| ALP, ≤ 125/ > 125 U/L | 121/99 | 0.002 | 1.592 (1.184-2.141) | 55/79 | 0.003 | 1.835 (1.233-2.730) |
| LDH, ≤245/ >245 U/L | 181/39 | 0.564 | 1.118 (0.766-1.633) | 89/45 | 0.423 | 1.180 (0.787-1.768) |
| Glucose, ≤ 5.6/ >5.6 mmol/L | 98/122 | 0.523 | 1.102 (0.818-1.483) | 58/76 | 0.002 | 1.902 (1.278-2.829) |
| GAR, ≤ 0.63/ > 0.63 | 62/158 | 0.113 | 1.321 (0.936-1.866) | 28/106 | 0.020 | 1.853 (1.101-3.120) |
| APAR, ≤ 2.16/ > 2.16 | 98/122 | <0.001 | 1.815 (1.337-2.465) | 35/99 | 0.001 | 2.155 (1.353-3.433) |
| NLR, ≤ 0.39/ >0.39 | 118/102 | 0.372 | 1.144 (0.851-1.538) | 60/74 | <0.001 | 2.080 (1.393-3.105) |
CA19-9, cancer antigen 19-9; CEA, carcino embryonie antigen; TBIL, total bilirubin; ALB, albumin; AST, aspartate aminotransferase; ALT, alanine aminotransferase; GGT, gamma-glutamyl transpeptidase; ALP, alkaline phosphatase; LDH, lactate dehydrogenase; GAR, gamma-glutamyl transpeptidase-to-albumin ratio; APAR, alkaline phosphatase-to-albumin ratio; NLR, neutrophil-to-lymphocyte ratio; HR, hazard ratio; P-value < 0.05 marked in bold font shows statistical significant.
Kaplan-Meier survival curves for OS of patients with PDAC according to the serum APAR levels. Patients of PDAC with a preoperative APAR less than 2.16 were inclined to significantly poorer OS in the training cohort (a) and validation cohort (b). The P-values were determined by the log-rank test. OS, overall survival; PDAC, pancreatic ductal adenocarcinoma; APAR, alkaline phosphatase-to-albumin ratio.
In univariate analysis, poorer tumor differentiation (P=0.007 and P=0.001, respectively), advanced TNM stage (P<0.001 and P=0.009, respectively), elevated serum CEA (P=0.036 and P=0.002, respectively), GGT (P=0.016 and 0.012, respectively), ALP (P=0.002 and 0.003, respectively) and higher APAR (P<0.001 and P=0.001, respectively) were considered as significant risk factors in both training and validation sets (Table 2). In addition, in the validation set, CA19-9 (P=0.009), TBIL (P=0.021), ALB (P=0.007), glucose (P=0.002), gamma- glutamyltransferase-to-albumin ratio (GAR; P=0.020) and NLR (P<0.001) were also identified as significant predictors (Table 2). In multivariate analysis of training or validation set for OS, poorer differentiation of tumor (P=0.039, hazard ratio [HR]=1.346; 95% confidential interval [CI] 1.016-1.783 and P=0.007, HR=1.735; CI 1.160-2.595, respectively), advanced TNM stage (P<0.001, HR=1.508; CI 1.208-1.888 and P=0.005, HR=1.459; CI 1.118-1.906, respectively) and elevated APAR level (P=0.004, HR=2.086; CI 1.272-3.423 and P=0.038, HR=2.175; CI 1.044-4.533) remained as independent indicators. Furthermore, elevated serum glucose (P=0.033, HR=1.619; CI 1.041-2.519) was also verified as an independent predictor in the validation set (Table 3).
Multivariate analysis of prognostic factors associated with overall survival.
| Variables | Overall survival | |||||
|---|---|---|---|---|---|---|
| Training cohort | Validation cohort | |||||
| Patients (n=220 ) | P-value | HR (95% CI) | Patients (n=134 ) | P-value | HR (95% CI) | |
| Tumor differentiation, well/moderate/poor | 5/83/132 | 0.039 | 1.346 (1.016-1.783) | 4/53/77 | 0.007 | 1.735 (1.160-2.595) |
| TNM stage, I/ II/ III | 79/111/30 | <0.001 | 1.508 (1.208-1.888) | 50/53/31 | 0.005 | 1.459 (1.118-1.906) |
| CA19-9, < 37/ ≥ 37 U/L | NA | 26/108 | 0.416 | 1.281 (0.705-2.327) | ||
| CEA, < 5/ ≥ 5 ng/mL | 159/61 | 0.414 | 1.155 (0.818-1.630) | 94/40 | 0.079 | 1.491 (0.955-2.328) |
| TBIL, ≤ 20.4/ > 20.4 μmol/L | NA | 56/78 | 0.602 | 0.812 (0.372-1.774) | ||
| ALB, < 35/ ≥ 35 g/L | NA | 40/94 | 0.176 | 0.724 (0.453-1.156) | ||
| GGT, ≤ 60/ > 60 U/L | 104/116 | 0.683 | 1.108 (0.676-1.817) | 45/89 | 0.988 | 1.006 (0.490-2.064) |
| ALP, ≤ 125/ > 125 U/L | 121/99 | 0.488 | 0.814 (0.454-1.457) | 55/79 | 0.355 | 1.434 (0.668-3.075) |
| Glucose, ≤ 5.6/ >5.6 mmol/L | NA | 58/76 | 0.033 | 1.619 (1.041-2.519) | ||
| GAR, ≤ 0.63/ > 0.63 | NA | 28/106 | 0.941 | 0.970 (0.436-2.156) | ||
| APAR, ≤ 2.16/ > 2.16 | 98/122 | 0.004 | 2.086 (1.272-3.423) | 35/99 | 0.038 | 2.175 (1.044-4.533) |
| NLR, ≤ 0.39/ >0.39 | NA | 60/74 | 0.280 | 1.287 (0.814-2.034) | ||
CA19-9, cancer antigen 19-9; CEA, carcino embryonie antigen; TBIL, total bilirubin; ALB, albumin; GGT, gamma-glutamyl transpeptidase; ALP, alkaline phosphatase; GAR, gamma-glutamyl transpeptidase-to-albumin ratio; APAR, alkaline phosphatase-to-albumin ratio; NLR, neutrophil-to-lymphocyte ratio; HR, hazard ratio; P-value < 0.05 marked in bold font shows statistical significant.
Prognostic nomograms incorporating APAR, pathological differentiation and the AJCC 8th edition
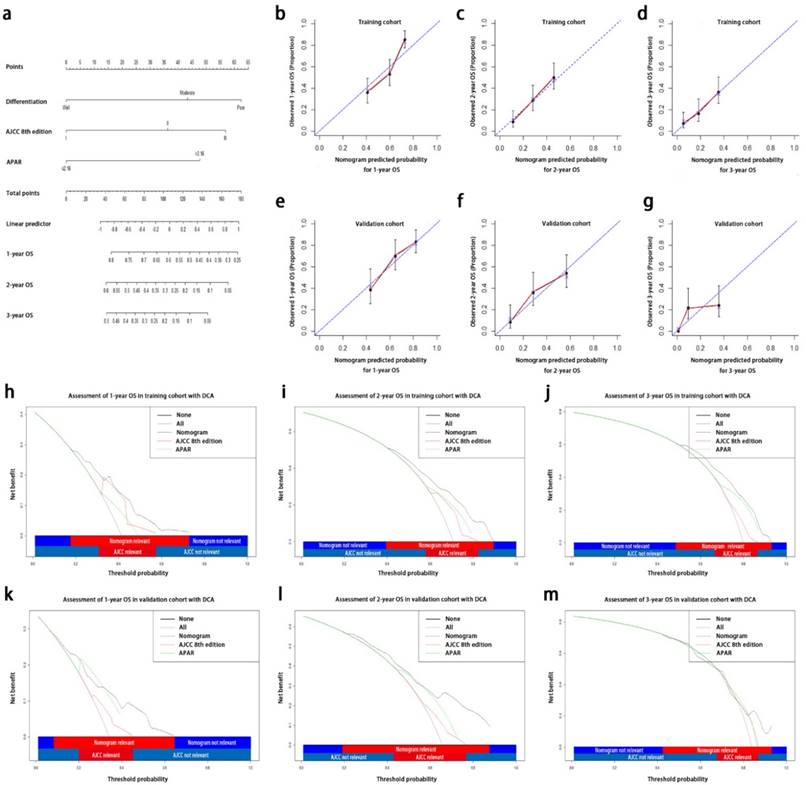
In order to create one more accurate predictive model, we tried to integrate three independent prognostic indicators, APAR, pathological differentiation and the AJCC 8th edition, in both training and validation sets to generate a new prognostic nomogram (Fig. 3a). In the training group, the C-index for OS prediction with the formulated nomogram in training group was 0.673 (95% CI, 0.667-0.679) and the C-index for other variables were shown in Table 4. The calibration curves exhibited optimal consistency between the actual observation of OS and nomogram-predicted OS at 1, 2, 3 years after surgery (Fig. 3b, 3c and 3d).
Prognostic nomogram, calibration curves and decision curve analysis for PDAC. The nomogram predicts OS (a) in patients with PDAC (to use the nomogram, an individual patient's value is located on each variable axis, and a line is drawn upwards to determine the number of points received for each variable value. The sum of these number is located on the total points axis, and a line is drawn downwards to the survival axes to determine the likelihood of 1-, 2-, 3-year OS). The calibration curves predict OS at 1 years (b), 2 years (c) and 3 years (d) in the training cohorts and at 1 years (e), 2 years (f), 3 years (g) in the validation cohort. Nomogram-predicted probability of OS is plotted on the x axis and the observed OS is plotted on the y axis. Decision curve analyses depict the clinical net benefit in pairwise comparisons across the different models. Nomogram is compared with the AJCC 8th edition in terms of 1-(h,k), 2-(i,l), 3-year(j,m) OS in the training and validation cohorts. Dashed lines indicate the net benefit of the predictive models across a range of threshold probabilities (black: nomogram; red: TNM staging system of AJCC 8th edition; green: APAR). The horizontal solid black line represents the assumptions that no patient will experience the event, and the solid grey line represents the assumption that all patients will experience the event. On decision curve analysis, the nomograms showed superior net benefit compared with AJCC 8th edition across a wider range of threshold probabilities. PDAC, pancreatic ductal adenocarcinoma; OS, overall survival; APAR, alkaline phosphatase-to-albumin ratio; TNM, tumor node metastasis; AJCC, American Joint Committee on Cancer.
Discriminatory capabilities of nomogram and independent prognostic factors in patients with PDAC: C-indices in OS prediction.
| Variables | Overall survival | ||||
|---|---|---|---|---|---|
| Training cohort | Validation cohort | ||||
| C-index | 95% CI | C-index | 95% CI | ||
| Nomogram (AJCC 8th edition +APAR+Pathological differentiation) | 0.673 | 0.667-0.679 | 0.693 | 0.685-0.701 | |
| Nomogram (AJCC 8th edition +Pathological differentiation) | 0.641 | 0.635-0.647 | 0.620 | 0.610-0.630 | |
| AJCC 8th edition | 0.611 | 0.606-0.616 | 0.587 | 0.578-0.596 | |
| APAR | 0.582 | 0.576-0.588 | 0.608 | 0.601-0.615 | |
| Pathological differentiation | 0.571 | 0.566-0.576 | 0.584 | 0.575-0.593 | |
AJCC, American Joint Committee on Cancer; APAR, alkaline phosphatase-to-albumin ratio; C-index, concordance index.
The predictive accuracy of created nomogram for OS was further affirmed in the validation set and the C-index for OS prediction was 0.693 (95% CI, 0.685-0.701). The calibration plot in such group for OS prediction at 1, 2, 3 years after surgery also fitted very well between the observation and the prediction of nomogram in the probability (Fig. 3e, 3f and 3g).
On DCA, a novel evaluation method to be performed to highlight prediction models with the clinical net benefit32, the nomogram showed superior net benefit with a wider range of threshold probability, compared with the AJCC 8th edition, which indicated improved performance for predicting 1-, 2-, 3-year OS in both training and validation set in terms of C-index (Table 4; Fig. 3h-3m). Higher threshold probability levels represented superior estimation of decision outcomes.
Discussion
In this study, two random cohorts of patients operated with curative surgical resection of PDAC were analyzed. We set up APAR, an original and easily available inflammation-based score comprised of serum ALB and ALP level, as a survival predictor in PDAC patients undergoing curative resection. According to analyzed results of the clinicopathological characteristics, it showed APAR was associated closely with the tumor site and liver function in both cohorts. Next, in univariate and multivariate analysis, a significant association was found between serum APAR level and OS. We also found the APAR was superior to GAR or NLR as a predictor of OS in the validation cohort. Furthermore, nomograms incorporating APAR, pathological differentiation and AJCC 8th edition manifested advanced predictive value compared to the TNM staging system of AJCC 8th edition alone.
Recent studies showed that oxidative stress, one of the major product of inflammation, could produce reactive oxygen species that damage DNA, lipids, and proteins and promote high mutagenic metabolites, which was considered as an important role in tumorgenesis of PDAC33, 34. Elevated ALP could be a powerful predictor of death and a potential indicator of oxidative stress21, 35. It is well-known that once the pancreatic cancer invades the adjacent biliopancreatic ducts, the bile will be obstructed and stimulate the biliary epithelial cells or hepatocytes, which also contributes to the elevated ALP level and the impaired liver function. Particularly, elevated ALP level is constantly reported in several malignancies18, 36. On the contrary, ALB as a protective component synthesized abundant anti-oxidative products23. Therefore, APAR was not only an association of liver function values as previously considered, but also a probable complexus of anti-oxidant balance and a potential indicator for prognosis. The potential molecular mechanisms may contain the imbalanced inflammatory and immune microenvironment, malnutrition and local infiltration or metastasis. Tumor necrosis factor (TNF) and interleukin 6 (IL-6)37, 38 secreted by pancreatic cancer can influence the ALB production and increase the infiltration of microvasculature30. The cytokines or chemokines excreted by the potential pancreatic cancer and jaundice caused by oppression can both change the ALP, ALB level and tumor microenvironment, so a high APAR may reflect the disorder of immunity, oxidative stress, liver damage and poorer prognosis.
Although quantities of inflammation-base scores turned up as prognostic indicators in various malignant tumors4, 39, 40, the AJCC 8th edition and other predictive models in PDAC were lack for the evaluation of liver function or inflammation factors to provide additional messages about the evaluation of prognosis. The previous study confirmed that the inflammation-based scores enlightened the predictive value of the conventional TNM staging systems in intrahepatic cholangiocarcinoma23. Intriguingly, the incorporation of APAR logically improved the predictive performance and refined the accuracy of prediction of the AJCC 8th edition of PDAC in terms of corresponding C-index.
Several limitations to this study should be considered as follows. Firstly, this study was retrospective essentially and all data were collected from a single center in China. A large-scale and multicenter prospective study should be preferred to verify our results and eliminate the selective bias. Secondly, this study only included the patients who received curative resection, however, patients with different stage undergoing different postoperative treatment, such as chemotherapy and radiotherapy. Thirdly, the cut-off value of APAR used in this study may not be appropriate to other studies and a meta-analysis containing various APAR validation studies may be needed to confirm the most suitable cut-off value for APAR.
In conclusion, APAR, as one inexpensive and easy-accessible biomarker, could be a robust prognostic predictor of PDAC with curative resection. In addition, the proposed nomogram containing APAR, pathological differentiation and the TNM staging system of AJCC 8th edition reveals a superior prognostic model.
Abbreviations
PDAC: pancreatic ductal adenocarcinoma; APAR: alkaline phosphatase-to-albumin ratio; AJCC: American Joint Commission on Cancer; OS: overall survival; ALB: albumin; AST: aspartate aminotransferase; ALT: alanine aminotransferase; NLR: neutrophil-lymphocyte ratio; CRP/Alb: C-reactive protein/albumin; ALP: Alkaline phosphatase; CEA: carcino embryonie antigen; TBIL: total bilirubin; GGT: gamma-glutamyltransferase; LDH: lactate dehydrogenase; CT: computed tomography; C-index: concordance index; DCA: decision curve analysis; ROC: receiver operating characteristic curve.
Acknowledgements
The authors thank Shuangjian Qiu, Yipeng Fu, Chuyu Jing, Jinglong Huang (Liver Cancer Institute) for the statistical supports. This work was supported by the following grants: the Shanghai Pujiang Program (No.16PJD013), the National Natural Science Foundation of China (No.81272731), and the Science and Technology Commission of Shanghai Municipality (No.11JC1402502).
Competing Interests
The authors have declared that no competing interest exists.
References
1. Liu L, Zhao G, Wu W. et al. Low intratumoral regulatory T cells and high peritumoral CD8(+) T cells relate to long-term survival in patients with pancreatic ductal adenocarcinoma after pancreatectomy. Cancer Immunol Immunother. 2016;65:73-82
2. Siegel RL, Miller KD, Jemal A. Cancer Statistics, 2017. CA Cancer J Clin. 2017;67:7-30
3. Chen W, Zheng R, Baade PD. et al. Cancer statistics in China, 2015. CA Cancer J Clin. 2016;66:115-32
4. Li GJ, Xu HW, Ji JJ. et al. Prognostic value of preoperative lymphocyte-to-monocyte ratio in pancreatic adenocarcinoma. Onco Targets Ther. 2016;9:1085-92
5. Benassai G, Quarto G, Perrotta S. et al. Long-term survival after curative resection for pancreatic ductal adenocarcinoma-Surgical treatment. Int J Surg. 2015;21(Suppl 1):S1-3
6. Hsu CP, Hsu JT, Liao CH. et al. Three-year and five-year outcomes of surgical resection for pancreatic ductal adenocarcinoma: Long-term experiences in one medical center. Asian J Surg. 2016
7. Kamarajah SK, Burns WR, Frankel TL. et al. Validation of the American Joint Commission on Cancer (AJCC) 8th Edition Staging System for Patients with Pancreatic Adenocarcinoma: A Surveillance, Epidemiology and End Results (SEER) Analysis. Ann Surg Oncol. 2017
8. Yamamoto T, Yagi S, Kinoshita H. et al. Long-term survival after resection of pancreatic cancer: a single-center retrospective analysis. World J Gastroenterol. 2015;21:262-8
9. Lu H, Ouyang W, Huang C. Inflammation, a key event in cancer development. Mol Cancer Res. 2006;4:221-33
10. Lee SH, Park SW. [Inflammation and Cancer Development in Pancreatic and Biliary Tract Cancer]. Korean J Gastroenterol. 2015;66:325-39
11. Yamada S, Fujii T, Yabusaki N. et al. Clinical Implication of Inflammation-Based Prognostic Score in Pancreatic Cancer: Glasgow Prognostic Score Is the Most Reliable Parameter. Medicine (Baltimore). 2016;95:e3582
12. Cheng H, Luo G, Lu Y. et al. The combination of systemic inflammation-based marker NLR and circulating regulatory T cells predicts the prognosis of resectable pancreatic cancer patients. Pancreatology. 2016;16:1080-4
13. Liu Z, Jin K, Guo M. et al. Prognostic Value of the CRP/Alb Ratio, a Novel Inflammation-Based Score in Pancreatic Cancer. Ann Surg Oncol. 2017;24:561-8
14. Shirai Y, Shiba H, Haruki K. et al. Preoperative Platelet-to-Albumin Ratio Predicts Prognosis of Patients with Pancreatic Ductal Adenocarcinoma After Pancreatic Resection. Anticancer Res. 2017;37:787-93
15. Fernandez NJ, Kidney BA. Alkaline phosphatase: beyond the liver. Vet Clin Pathol. 2007;36:223-33
16. Alvaro D, Benedetti A, Marucci L. et al. The function of alkaline phosphatase in the liver: regulation of intrahepatic biliary epithelium secretory activities in the rat. Hepatology. 2000;32:174-84
17. Poupon R. Liver alkaline phosphatase: a missing link between choleresis and biliary inflammation. Hepatology. 2015;61:2080-90
18. Carr BI, Guerra V. Hepatocellular Carcinoma Extrahepatic Metastasis in Relation to Tumor Size and Alkaline Phosphatase Levels. Oncology. 2016;90:136-42
19. Chan AW, Chan SL, Mo FK. et al. Albumin-to-alkaline phosphatase ratio: a novel prognostic index for hepatocellular carcinoma. Dis Markers. 2015;2015:564057
20. Lv W, Shang H, Pei X. et al. A simple prognostic model involving prostate-specific antigen, alkaline phosphatase and albumin for predicting the time required to progress to castration-resistant prostate cancer in patients who received androgen deprivation therapy. Int Urol Nephrol. 2017;49:61-7
21. Ji F, Fu SJ, Guo ZY. et al. Prognostic value of combined preoperative lactate dehydrogenase and alkaline phosphatase levels in patients with resectable pancreatic ductal adenocarcinoma. Medicine (Baltimore). 2016;95:e4065
22. Don BR, Kaysen G. Serum albumin: relationship to inflammation and nutrition. Semin Dial. 2004;17:432-7
23. Jing CY, Fu YP, Shen HJ. et al. Albumin to gamma-glutamyltransferase ratio as a prognostic indicator in intrahepatic cholangiocarcinoma after curative resection. Oncotarget. 2017
24. Moshage HJ, Janssen JA, Franssen JH. et al. Study of the molecular mechanism of decreased liver synthesis of albumin in inflammation. J Clin Invest. 1987;79:1635-41
25. He X, Guo S, Chen D. et al. Preoperative Albumin to Globulin Ratio (AGR) as Prognostic Factor in Renal Cell Carcinoma. J Cancer. 2017;8:258-65
26. Sun H, Hu P, Shen H. et al. Albumin and Neutrophil Combined Prognostic Grade as a New Prognostic Factor in Non-Small Cell Lung Cancer: Results from a Large Consecutive Cohort. PLoS One. 2015;10:e0144663
27. Xu WZ, Li F, Xu ZK. et al. Preoperative albumin-to-globulin ratio and prognostic nutrition index predict prognosis for glioblastoma. Onco Targets Ther. 2017;10:725-33
28. Alagappan M, Pollom EL, von Eyben R. et al. Albumin and Neutrophil-Lymphocyte Ratio (NLR) Predict Survival in Patients With Pancreatic Adenocarcinoma Treated With SBRT. Am J Clin Oncol. 2016
29. Wu M, Guo J, Guo L. et al. The C-reactive protein/albumin ratio predicts overall survival of patients with advanced pancreatic cancer. Tumour Biol. 2016;37:12525-33
30. Nie M, Sun P, Chen C. et al. Albumin-to-Alkaline Phosphatase Ratio: A Novel Prognostic Index of Overall Survival in Cisplatin-based Chemotherapy-treated Patients with Metastatic Nasopharyngeal Carcinoma. J Cancer. 2017;8:809-15
31. Fu YP, Yi Y, Cai XY. et al. Overexpression of interleukin-35 associates with hepatocellular carcinoma aggressiveness and recurrence after curative resection. Br J Cancer. 2016;114:767-76
32. Vickers AJ, Elkin EB. Decision curve analysis: a novel method for evaluating prediction models. Med Decis Making. 2006;26:565-74
33. Chang EY, Chang YC, Shun CT. et al. Inhibition of Prostaglandin Reductase 2, a Putative Oncogene Overexpressed in Human Pancreatic Adenocarcinoma, Induces Oxidative Stress-Mediated Cell Death Involving xCT and CTH Gene Expressions through 15-Keto-PGE2. PLoS One. 2016;11:e0147390
34. Martinez-Useros J, Li W, Cabeza-Morales M. et al. Oxidative Stress: A New Target for Pancreatic Cancer Prognosis and Treatment. J Clin Med. 2017:6
35. Lopez-Posadas R, Gonzalez R, Ballester I. et al. Tissue-nonspecific alkaline phosphatase is activated in enterocytes by oxidative stress via changes in glycosylation. Inflamm Bowel Dis. 2011;17:543-56
36. Rao SR, Snaith AE, Marino D. et al. Tumour-derived alkaline phosphatase regulates tumour growth, epithelial plasticity and disease-free survival in metastatic prostate cancer. Br J Cancer. 2017;116:227-36
37. Zhou G, Niu L, Chiu D. et al. Changes in the expression of serum markers CA242, CA199, CA125, CEA, TNF-alpha and TSGF after cryosurgery in pancreatic cancer patients. Biotechnol Lett. 2012;34:1235-41
38. Pop VV, Seicean A, Lupan I. et al. IL-6 roles - Molecular pathway and clinical implication in pancreatic cancer - A systemic review. Immunol Lett. 2017;181:45-50
39. Hsu JT, Liao CK, Le PH. et al. Prognostic Value of the Preoperative Neutrophil to Lymphocyte Ratio in Resectable Gastric Cancer. Medicine (Baltimore). 2015;94:e1589
40. Keskin S, Keskin Z, Taskapu HH. et al. Prognostic value of preoperative neutrophil-to-lymphocyte and platelet-to-lymphocyte ratios, and multiphasic renal tomography findings in histological subtypes of renal cell carcinoma. BMC Urol. 2014;14:95
Author contact
![]() Corresponding authors: Wenchuan Wu, Department of General Surgery, Zhongshan Hospital, Fudan University, 180 Fenglin Road, Shanghai, 200032, P.R. China. E-mail: wu.wenchuansh.cn; Lingxiao Liu, Department of Interventional Radiology, Zhongshan Hospital, Fudan University, 180 Fenglin Road, Shanghai, 200032, P.R. China. E-mail: liu.lingxiaosh.cn
Corresponding authors: Wenchuan Wu, Department of General Surgery, Zhongshan Hospital, Fudan University, 180 Fenglin Road, Shanghai, 200032, P.R. China. E-mail: wu.wenchuansh.cn; Lingxiao Liu, Department of Interventional Radiology, Zhongshan Hospital, Fudan University, 180 Fenglin Road, Shanghai, 200032, P.R. China. E-mail: liu.lingxiaosh.cn