Journal of Cancer 3.2
Impact Factor
ISSN: 1837-9664
Impact Factor
ISSN: 1837-9664

 Global reach, higher impact
J Cancer 2017; 8(14):2669-2675. doi:10.7150/jca.21037 This issue Cite
Research Paper
B-cell translocation gene 1 is downregulated by promoter methylation in ovarian carcinoma
Ji-Ye Kim1,2*, Sung-Im Do3*, Go Eun Bae4,5, Hyun-Soo Kim1 ![]()
1. Department of Pathology, Severance Hospital, Yonsei University College of Medicine, Seoul, Republic of Korea
2. Department of Pathology and Translational Genomics, Samsung Medical Center, Sungkyunkwan University School of Medicine, Seoul, Republic of Korea
3. Department of Pathology, Kangbuk Samsung Hospital, Sungkyunkwan University School of Medicine, Seoul, Republic of Korea
4. Department of Pathology, The Catholic University of Korea Incheon St. Mary's Hospital, Incheon, Republic of Korea
5. Department of Pathology, Kyung Hee University Hospital at Gangdong, Kyung Hee University School of Medicine, Seoul, Republic of Korea
*These authors have contributed equally to this work.
Received 2017-5-16; Accepted 2017-6-27; Published 2017-8-22
Citation:
Kim JY, Do SI, Bae GE, Kim HS. B-cell translocation gene 1 is downregulated by promoter methylation in ovarian carcinoma. J Cancer 2017; 8(14):2669-2675. doi:10.7150/jca.21037. https://www.jcancer.org/v08p2669.htm
Other stylesAbstract
A better understanding of tumor biology is important in the identification of molecules that are downregulated in malignancy and in determining their role in tumor suppression. B-cell translocation gene 1 (BTG1) has been shown to act as a tumor suppressor in several types of human malignancy. In this study, we analyzed BTG1 expression in ovarian carcinoma cell lines, and we investigated the mechanism underlying the observed alterations. The methylation status of the BTG1 promoter region was determined by methylation-specific polymerase chain reaction, and the effect of demethylation on BTG1 expression was analyzed. BTG1 protein expression in ovarian high-grade serous carcinoma tissue samples was evaluated using immunohistochemistry. BTG1 mRNA and protein expression were reduced in ovarian carcinoma cells. In BTG1-silenced ovarian cancer cells, the BTG1 promoter was highly methylated. Treatment with 5-aza-deoxycytidine significantly elevated BTG1 mRNA and protein expression. Immunostaining demonstrated that BTG1 expression was significantly lower in ovarian carcinoma tissue samples than nonpathological ovaries and fallopian tubes. We demonstrated that BTG1 silencing in ovarian carcinoma occurs through epigenetic repression and is involved in the ovarian carcinogenesis. Our data suggest that BTG1 is a potential therapeutic target for patients with ovarian carcinoma.
Keywords: ovary, ovarian carcinoma, B-cell translocation gene 1, downregulation, promoter hypermethylation
Introduction
Ovarian carcinomas account for more than 90% of ovarian malignancy and have the highest mortality rate of all gynecological tumors. Ovarian carcinomas are disproportionately deadly because of the lack of early detection methods; most ovarian carcinomas are diagnosed at advanced stages, resulting in a five-year survival rate of approximately 47% [1, 2]. Ovarian carcinomas are a heterogeneous group of tumors that exhibit a wide range of morphologies and clinical manifestations. An increased understanding regarding the alterations that occur in gene expression during ovarian carcinogenesis may result in the improvement of its diagnosis and treatment [3, 4].
Cellular proliferation, differentiation, and apoptosis are cell cycle-dependent processes [5]. Impaired cell cycle regulation is closely linked to tumor development and progression [6, 7]. Moreover, many proto-oncogenes and tumor suppressor genes are directly involved in or function as major factors in cell cycle regulation. Aberrant expression of these genes results in deregulation of the cell cycle, abnormal cellular proliferation, and tumor development [8]. While the existing treatment of patients with ovarian carcinoma is limited to aggressive surgery and chemotherapy, identification of novel biomarkers and gene targets may improve survival rate and quality of life of patients. Therefore, an understanding of the responsible genes in ovarian carcinogenesis and their molecular mechanisms is essential.
B-cell translocation gene 1 (BTG1) was originally identified as a translocation partner of the c-myc gene in B-cell chronic lymphocytic leukemia. BTG1 is a member of the mammalian BTG/Tob family that is a group of proteins with antiproliferative ability [9-11]. These proteins are involved in regulating cell cycle progression, inhibiting cellular proliferation, promoting apoptosis, and stimulating cellular differentiation in various cell types [12]. BTG1 is expressed predominantly in quiescent cells at the G0/G1 phase transition, with levels declining as cells enter S phase [13]. Exogenous expression of BTG1 was found to reduce proliferation, by G1 arrest and/or apoptosis, in murine fibroblasts [13]. Similarly, BTG1 expression levels are inversely correlated with the proliferative capacity of murine microglial cells [14]. Moreover, enhanced BTG1 expression promotes differentiation of neural stem cells and germ cells, and plays an important role in angiogenesis.
Based on these characteristics, BTG1 is currently considered to be a tumor suppressor gene [15]. Experiments in gene expression induction showed that BTG1 mediated apoptosis and that it negatively regulated cellular proliferation, cell-to-cell adhesion, migration, and invasion in several human malignancies [16-22]. However, the role of BTG1 in the development and progression of ovarian carcinoma is yet to be elucidated. Moreover, the functions of BTG1 and its precise molecular mechanisms in ovarian carcinoma remain unclear. In this study, to clarify the roles of BTG1 in ovarian carcinogenesis, BTG1 mRNA and protein expression was evaluated in ovarian carcinoma cell lines; to understand the mechanism responsible for changes in BTG1 expression, we analyzed the promoter methylation status of BTG1 gene promoter region in ovarian carcinoma cell lines and compared BTG1 expressions before and after demethylation treatment. Our results indicate that promoter hypermethylation is one of the mechanisms of BTG1 downregulation in ovarian carcinoma.
Materials and Methods
Cell lines and treatments
The human ovarian carcinoma cell lines Caov-3, Caov-4, SW 626, OV90, and NIH:OVCAR3 were purchased from the American Type Culture Collection (Manassas, VA, USA) and maintained in Dulbecco's Modified Eagle's Medium or Roswell Park Memorial Institute (RPMI) 1640 medium supplemented with 10% heat-inactivated fetal bovine serum (FBS), penicillin (100 U/mL), and streptomycin (100 μg/mL; Gibco, Life Technologies, Grand Island, NY, USA). All cell lines were cultured at 37°C in a humidified atmosphere of 5% CO2. 5-Aza-CdR (Sigma-Aldrich, St. Louis, MO, USA) was dissolved in dimethyl sulfoxide (DMSO; Sigma-Aldrich) at 50 mg/mL as a stock solution, which was stored at -20°C. DMSO concentration was 0.001%, and the same concentration was used as vehicle. Immediately before use, stock solutions were diluted in RPMI 1640 without FBS.
Quantitative reverse-transcriptase polymerase chain reaction (qRT-PCR)
Total RNA was isolated using TRI Reagent (Molecular Research Center, Cincinnati, OH, USA) and used for cDNA synthesis with a ReverTra Ace qPCR RT Kit (Toyobo Co., Ltd., Osaka, Japan). The amount of cDNA was determined spectrophotometrically. The cDNA was used for qRT-PCR using the Bio-Rad CFX96 Real-Time PCR Detection System (Bio-Rad Laboratories, Hercules, CA, USA) with a C1000 Thermal Cycler (Bio-Rad Laboratories). PCR was carried out in a 20-μL reaction containing 0.5 μM of each primer, 10 μL of 2× SsoAdvanced SYBR Green Supermix (Bio-Rad Laboratories), and 2 μL of template DNA. PCRs for BTG1 and β-actin were initiated with a denaturing step at 95°C for 3 min, followed by 40 cycles at 95°C for 30 s and 60°C for 30 s. Amplification patterns were analyzed and threshold cycle numbers (Ct) for each sample were determined using CFX Manager Software (Bio-Rad Laboratories). The ΔΔCt method was used to calculate relative target gene expression after normalization to β-actin [23]. Amplification of the target gene was confirmed by melting curve analysis and target amplicon size was confirmed by agarose gel electrophoresis. Each sample was assayed in triplicate.
Immunoblot analysis
Cells were mixed with lysis buffer (50 mM Tris [pH 7.5], 1% NP-40, 10 mM NaCl, 20 μg/mL aprotinin, 20 μg/mL leupeptin, and 1 mM phenylmethylsulphonyl fluoride) and were placed on ice for 20 min. The lysates were assessed for protein concentration, and 100 μg of each protein sample was resolved by 12% SDS-PAGE and electroblotted onto nitrocellulose membranes (GE Healthcare, London, UK). After a 1-h incubation in blocking solution [5% non-fat milk in Tris-buffered saline with Tween 20 (TBS-T)], the membranes were exposed to primary antibodies (anti-BTG1, 1:200, polyclonal; Abcam, Cambridge, MA, USA, and β-actin, 1:5,000; Santa Cruz Biotechnology, Santa Cruz, CA, USA) overnight at 4°C. The blots were washed three times in TBS-T and incubated with horseradish peroxidase- conjugated secondary antibody (Cell Signaling Technology, Beverly, MA, USA) for 1 h at room temperature. Protein bands were visualized using enhanced chemiluminescence reagent (iNtRON Biotechnology, Seongnam, Gyeonggi-do, Republic of Korea).
Methylation-specific PCR
Genomic DNA was extracted using a NucleoSpin Tissue kit (Macherey-Nagel GmbH & Co. KG, Dueren, Germany) and treated with sodium bisulfite using an EZ DNA Methylation Kit (Zymo Research, Irvine, CA, USA). During the modification, unmethylated cytosines of the genomic DNA are converted to uracils, while methylated cytosines remained unchanged. The bisulfite-modified DNA subjected to PCR using primer pairs that specifically amplify either methylated or unmethylated sequences of BTG1. The following methylated BTG1-specific primers were used [24]: MSP1 (-149 to -289), 5′-GTT TTT AAG TTA AAA GGA AGG AAG TC-3′ (sense) and 5′-ATA TCA AAA AAT ATT AAA AAT CAC GCA-3′ (antisense); MSP2 (-517 to -645), 5′-TTT GAG GAG TTA GTT ATC GAG ATT C-3′ (sense) and 5′-AAA TAA ATA AAA ACC GCC TAA CG-3′ (antisense). The following unmethylated BTG1-specific primers were used: USP1 (-149 to -289), 5′-GTT TTT AAG TTA AAA GGA AGG AAG TTG T-3′ (sense) and 5′-ATA TCA AAA ATA TTA AAA ATC ACA CA-3′ (antisense); USP2 (-517 to -645), 5′-TGA GGA GTT AGT TAT TGA GAT TTG G-3′ (sense) and 5′-AAA TAA ATA AAA ACC ACC TAA CAC A-3′ (antisense). MSP was performed in 20-μL mixtures for 40 cycles using hot-start polymerase (Qiagen, Hilden, Germany).
Tissue specimens
During the study period from January 2014 to December 2014, tissue samples were obtained from 37 patients who underwent primary debulking surgery (hysterectomy, bilateral salpingo-oophorectomy, pelvic and/or paraaortic lymphadenectomy, omentectomy, and/or abdominopelvic peritonectomy) for primary ovarian high-grade serous carcinoma. The patients' age ranged from 44 to 76 years (median, 58 years). Two independent board-certified pathologists reviewed all hematoxylin and eosin-stained slides and selected the most representative slide from each case for immunohistochemical staining. Nine non-pathological ovaries and 14 non-pathological fallopian tubes were obtained from 23 patients who underwent hysterectomy with salpingo-|oophorectomy for uterine leiomyomata. This study (2016-07-007-001) was reviewed and approved by the Institutional Review Board at the Kyung Hee University Hospital at Gangdong (Seoul, Republic of Korea).
Immunohistochemistry
Formalin-fixed tissues were dehydrated in a graded ethanol series and embedded in paraffin. Paraffin blocks were sectioned at 4 μm on a standard rotary microtome, and slices were brought from the water bath on clean slides. BTG1 protein expression was assessed by immunohistochemistry as described [25-30]. In brief, the 4-μm-thick, formalin-fixed, paraffin-embedded tissue sections were deparaffinized and rehydrated with a xylene and alcohol solution. Immunohistochemical staining was performed using a Ventana Benchmark XT automated staining system (Ventana Medical Systems, Tucson, AZ, USA) Antigen retrieval was carried out using Cell Conditioning Solution (CC1; Ventana Medical Systems). Sections were incubated with a rabbit polyclonal antibody against BTG1 (1:100; Abcam). After chromogenic visualization, using UltraView Universal DAB Detection Kits (Ventana Medical Systems), the slides were counterstained with hematoxylin. The slides were dehydrated following a standard procedure and sealed with coverslips. To minimize interassay variation, positive and negative control samples were included in each run. The positive control was normal liver and pancreatic tissue, and the negative control was prepared by substituting non-immune serum for the primary antibody; no staining was detected.
Immunohistochemical evaluation
Immunohistochemical staining was analyzed by two independent board-certified pathologists. BTG1 staining intensity was graded as absent (0), weak (1), intermediate (2), or strong (3). The staining proportion was graded as 0% (0), 1‒49% (1), 50‒74% (2), and 75‒100% (3). The subcellular location of BTG1-positive signals (nuclear or cytoplasmic) was also estimated. The final score was calculated as the multiplication of staining intensity and proportion, resulting in scores of 0 (negative), 1‒2 (weakly positive), 3‒4 (moderately positive), 6‒9 (strongly positive) [24, 25, 27, 28, 31]. Disagreements between the two pathologists were resolved by consensus.
Statistical analysis
We used the Wilcoxon test to compare expression levels of BTG1 mRNA before and after 5-aza-CdR treatment in each ovarian carcinoma cell line examined. Chi-square or Fisher's exact test were used to compare BTG1 immunoreactivity between ovarian carcinoma and normal tubo-ovarian tissue samples. Statistical analyses were performed using PASW Statistics for Windows (version 18.0; Armonk, NY, USA). Statistical significance was defined as a P value less than 0.05.
Results
BTG1 expression in ovarian carcinoma cell lines
BTG1 protein was expressed at different levels in different ovarian carcinoma cell lines. The Caov-3, Caov-4, SW 626, and OV90 lines exhibited reduced BTG1 protein expression (Figure 1A). Consistent with these findings, Caov-3 (normalized expression ratio, 0.20), Caov-4 (normalized expression ratio, 0.30), and SW 626 (normalized expression ratio, 0.60) cell lines showed significantly lower BTG1 mRNA expression than the OV90 (normalized expression ratio, 4.10) and NIH:OVCAR3 (normalized expression ratio, 1.30) cell lines (Figure 1B). BTG1 mRNA was readily detected in the OV90 line, while it was negligible in Caov-3 and Caov-4.
Mechanism contributing to reduced BTG1 expression in ovarian carcinoma cell lines
Zheng and colleagues [24] found that BTG1 mRNA and protein expression are reduced in gastric carcinoma cell lines. The authors also showed that BTG1 promoter methylation was decreased, and mRNA expression restored after treatment with the demethylating agent 5-aza-deoxycytidine (5-aza-CdR), indicating that BTG1 downregulation is associated with BTG1 promoter hypermethylation. Based on their observations, we hypothesized that promoter hypermethylation might explain the reduced BTG1 expression observed in ovarian carcinoma cell lines. We detected BTG1 promoter hypermethylation in all of Caov-3, Caov-4, SW 626, OV90, and NIH:OVCAR3 cell lines using methylation-specific polymerase chain reaction (MSP), indicating that promoter methylation may be a possible mechanism for the reduced BTG1 expression in these cell lines (Figure 1C).
To investigate the effect of methylation on BTG1 downregulation, we treated the cell lines with 5-aza-CdR. 5-Aza-CdR treatment significantly reduced BTG1 promoter methylation in Caov-3, Caov-4, and SW 626 (Figure 2A). This reduction was associated with significant restoration of BTG1 mRNA expression, with a 4.0-fold increase in Caov-3 (P < 0.001), a 1.37-fold increase in Caov-4 (P < 0.001), and 1.59-fold increase in SW 626 (P < 0.001), as compared to the respective pretreatment levels (Figure 2B). The restorative effect of 5-aza-CdR on BTG1 expression in these cell lines was confirmed by Western blotting (Figure 2C). These findings indicate that promoter methylation is directly responsible for the reduced BTG1 expression in ovarian carcinoma cell lines.
Figure 1
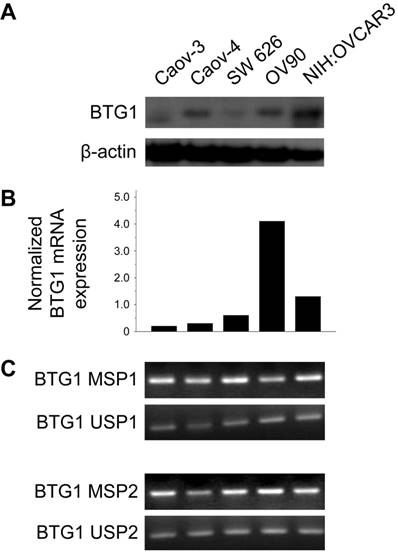
BTG1 expression is downregulated by promoter methylation in ovarian carcinoma cell lines. (A) Western blot for BTG1. (B) Normalized BTG1 mRNA expression analyzed by qRT-PCR. (C) Methylation status of the BTG1 gene promoter region analyzed by MSP.
BTG1 expression in ovarian carcinoma tumor tissues
Using immunohistochemistry, we investigated BTG1 protein expression in tissue samples of ovarian carcinoma, non-pathological ovaries, and non-pathological fallopian tubes. BTG1 immunoreactivity was predominantly cytoplasmic, although weak-to-moderate nuclear staining was observed. Normal pancreas (Figure 3A) and liver (Figure 3B) tissue sections were used as positive controls and exhibited diffuse and moderate-to-strong BTG1 immunoreactivity. BTG1 was not detected in the extracellular matrix or connective tissues. Eight out of nine (88.9%) non-pathological ovaries and 12 out of 14 (85.8%) non-pathological fallopian tubes (Figure 3C) exhibited diffuse and strong BTG1 immunoreactivity (Figure 3D). The remaining one (11.1%) non-pathological ovary and two (14.3%) non-pathological fallopian tubes showed moderately positive BTG1 expression. BTG1 protein was localized within the ovarian stromal cells and tubal epithelium. In contrast, in the carcinoma tissue samples (Figure 3E) BTG1 expression was strongly to moderately positive in 27.0% (10/37; Figure 3F), weakly positive in 37.8% (14/37; Figure 3G), and negative in 35.1% (13/37; Figure 3H). BTG1 protein expression in ovarian carcinoma was significantly lower than in non-pathological ovarian and tubal tissue samples (P < 0.001; Table 1).
Table 1
Differences in BTG1 expression between ovarian carcinoma and non-pathological ovary and fallopian tube
| Category | Total | Negative | Weakly positive | Moderately positive | Strongly positive | P value |
|---|---|---|---|---|---|---|
| Non-pathological ovary and fallopian tube | 23 | 0 (0.0) | 0 (0.0) | 3 (13.0) | 20 (87.0) | <0.001* |
| Ovarian carcinoma | 37 | 13 (35.1) | 14 (37.8) | 8 (21.6) | 2 (5.4) |
*Statistically significant
Figure 2
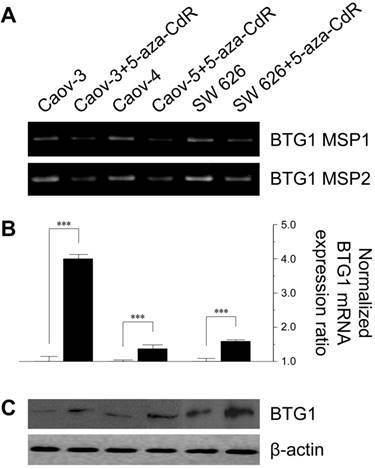
Effect of treatment with 5-aza-CdR on promoter methylation status and BTG1 expression in ovarian cancer cell lines. (A) Reduction in methylation of the BTG1 gene promoter region by treatment with 5-aza-CdR. (B) Restoration of BTG1 mRNA expression by treatment with 5-aza-CdR. ***P < 0.001 versus pretreatment. (C) Western blot for BTG1 before and after demethylation.
Discussion
In this study, we analyzed the expression of BTG1 in human ovarian carcinoma cells and tissues. We observed that ovarian carcinoma cell lines exhibited reduced BTG1 mRNA and protein expression, and that 73.0% (27/37) of ovarian carcinoma tissue samples had significantly reduced BTG1 protein expression. These findings indicate that BTG1 expression is downregulated in ovarian carcinoma, suggesting BTG1 as a potential diagnostic biomarker for ovarian carcinoma.
We investigated the regulatory mechanisms for BTG1 gene expression. One possible mechanism that could explain BTG1 downregulation was gene promoter methylation. Treatment with the demethylating agent 5-aza-CdR significantly restored BTG1 mRNA expression in the ovarian carcinoma cell lines Caov-3, Caov-4, and SW 626, which had very low basal mRNA levels. Consistent herewith, 5-aza-CdR treatment increased BTG1 protein expression in these cell lines. These findings suggest that epigenetic mechanisms are responsible for repressed BTG1 expression in ovarian carcinoma cells. We confirmed DNA methylation status of the BTG1 gene promoter region using MSP. Downregulation of BTG1 expression in the ovarian carcinoma cell lines was a result of enhanced promoter methylation, indicating that aberrant promoter hypermethylation was indeed the cause of BTG1 silencing in ovarian carcinoma cell lines. Similar to our findings, Zheng et al. [24] observed reduced BTG1 expression in gastric carcinoma, where they found that BTG1 mRNA and protein expression were significantly reduced in gastric carcinoma cell lines examined, and that BTG1 was silenced due to promoter hypermethylation. They also showed that after treatment with 5-Aza-CdR, BTG1 promoter methylation was suppressed and mRNA expression restored in these cell lines. Taken together, these results provide a new insight into the alterations of BTG1 expression associated with ovarian carcinoma development. We suggest that therapeutic targeting of BTG1 is a potential strategy for the treatment of ovarian carcinoma.
However, experimental data on BTG1 promoter methylation in other types of human malignancy are in conflict with the above findings. Kanda et al. [32] reported that gastric cancer and hepatocellular carcinoma cell lines do not exhibit BTG1 promoter hypermethylation. These conflicting findings regarding promoter methylation status may be owing to the differences in organs and cell types, differences in methods for analyzing methylation status, and the inadequacy of a single model for explaining carcinogenesis. Furthermore, downregulation of BTG1 expression has also been linked to alternative molecular regulatory mechanisms, such as microRNAs, in renal cell carcinoma and prostate carcinoma [33, 34]. Taken together, these findings indicate that promoter hypermethylation may be partially responsible for repressed BTG1 expression.
Figure 3
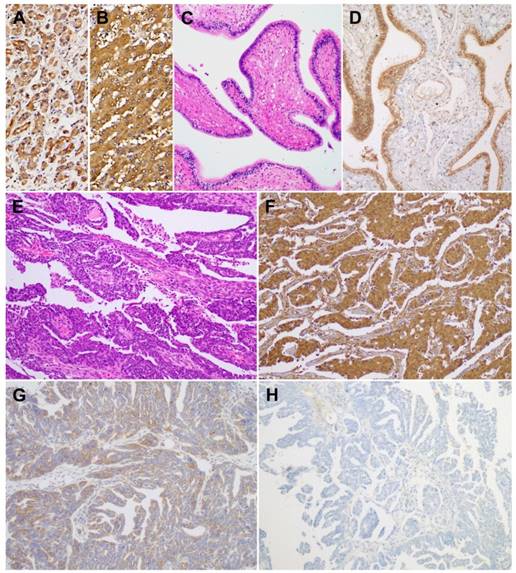
BTG1 protein expression in non-pathological fallopian tube and ovarian carcinoma tissue samples. As a positive control, (A) normal pancreas and (B) normal liver display strong BTG1 immunoreactivity. (C) Non-pathological fallopian tube consists of a single layer of mucosal epithelium with multiple plicae. (D) Non-pathological tubal epithelium exhibits strong BTG1 immunoreactivity. (E) Histopathology of tubo-ovarian high-grade serous carcinoma. (F) Strongly positive, (G) weakly positive, and (H) negative BTG1 expression in ovarian carcinoma tissue samples.
Data on BTG1 expression in other types of human malignancy support the notion that BTG1 may function as a tumor suppressor. Sun et al. [20] showed that BTG1 protein expression was significantly lower in renal cell carcinoma tissues than in normal kidney tissue. They also observed that BTG1-overexpressing renal cell carcinoma cells, obtained by stable transfection of BTG1 cDNA, had significantly lower viability, higher apoptotic rate, and lower invasion capability than control cells, accompanied by decreased expression of cyclin D1, B-cell lymphoma 2, and matrix metalloproteinase 9. These findings indicated that BTG1 can regulate cell cycle, inhibit cellular proliferation by reducing B-cell lymphoma 2, and modulate invasion and metastasis by downregulating matrix metalloproteinase expression. Similarly, BTG1-transfected hepatocellular carcinoma cells [18], non-small cell lung carcinoma cells [19], and nasopharyngeal carcinoma cells [17] correlated with lower survival, more frequent G0/G1 arrest, higher apoptotic rate, and significantly lower invasiveness than corresponding untransfected cells. Zhu et al. [22] demonstrated that BTG1-transfected breast carcinoma cell xenografts had significantly smaller tumor size, lower cell density, and a higher degree of tumor necrosis than untransfected xenografts in control mice, indicating that BTG1 overexpression mediates inhibition of xenograft formation and breast carcinoma cell growth in vivo.
Reduced BTG1 expression seems to point toward aggressive oncogenic behavior. Reduced BTG1 expression is significantly associated with lymph node metastasis, higher histological grade, advanced clinical stage, as well as reduced overall survival in carcinomas of the thyroid [8], esophagus [16], nasopharynx [17], lung [19], liver [35], and breast [36]. Zheng et al. [24] reported that reduced BTG1 expression was associated with deeper invasion, lymphovascular invasion, lymph node metastasis, and advanced stage of gastric carcinoma, indicating that BTG1 expression is a biomarker for predicting the aggressiveness of this carcinoma. Zhao et al. [4] observed that BTG1 mRNA expression in International Federation of Gynecology and Obstetrics (FIGO) stage I-II ovarian carcinomas was higher than that in FIGO stage III-IV ovarian carcinomas. These data suggest that BTG1 downregulation may be a major contributor to tumor development and progression, and that BTG1 expression scores may provide valuable information for the assessment of treatment options, prognosis judgment, and prediction of disease severity.
Conclusion
We observed that BTG1 was downregulated in ovarian carcinoma cell lines and tissues, suggesting that this protein is involved in the regulation of ovarian carcinoma development and downregulated BTG1 expression may promote malignant transformation. We demonstrated that BTG1 expression was restored after demethylation treatment in ovarian carcinoma cells, suggesting that downregulation of BTG1 by promoter hypermethylation may be one mechanism contributing to the ovarian carcinogenesis. These results corroborate that BTG1 expression may be a tumor suppressor. Restoration of BTG1 expression may offer a new therapeutic approach for treating patients with ovarian carcinoma.
Acknowledgements
This research was supported by the Basic Science Research Program through the National Research Foundation of Korea (NRF) funded by the Ministry of Education (2016R1D1A1B03935584), a faculty research grant of Yonsei University College of Medicine (6-2017-0036), and the Korean Society of Pathology Grant (2016).
Competing Interests
The authors have declared that no competing interest exists.
References
1. Piek JM, van Diest PJ, Verheijen RH. Ovarian carcinogenesis: an alternative hypothesis. Adv Exp Med Biol. 2008;622:79-87
2. Bandera CA. Advances in the understanding of risk factors for ovarian cancer. J Reprod Med. 2005;50:399-406
3. Kurman RJ, Shih Ie M. The origin and pathogenesis of epithelial ovarian cancer: a proposed unifying theory. Am J Surg Pathol. 2010;34:433-43
4. Zhao Y, Gou WF, Chen S, Takano Y, Xiu YL, Zheng HC. BTG1 expression correlates with the pathogenesis and progression of ovarian carcinomas. Int J Mol Sci. 2013;14:19670-80
5. Agathocleous M, Harris WA. Metabolism in physiological cell proliferation and differentiation. Trends Cell Biol. 2013;23:484-92
6. Shibata D, Aaltonen LA. Genetic predisposition and somatic diversification in tumor development and progression. Adv Cancer Res. 2001;80:83-114
7. Lee EY, Muller WJ. Oncogenes and tumor suppressor genes. Cold Spring Harb Perspect Biol. 2010;2:a003236
8. Lu YF, Sun GG, Liu Q, Yang CR, Cheng YJ. BTG1 expression in thyroid carcinoma: diagnostic indicator and prognostic marker. Int J Oncol. 2014;45:1574-82
9. Berthet C, Guehenneux F, Revol V, Samarut C, Lukaszewicz A, Dehay C. et al. Interaction of PRMT1 with BTG/TOB proteins in cell signalling: molecular analysis and functional aspects. Genes Cells. 2002;7:29-39
10. Doidge R, Mittal S, Aslam A, Winkler GS. The anti-proliferative activity of BTG/TOB proteins is mediated via the Caf1a (CNOT7) and Caf1b (CNOT8) deadenylase subunits of the Ccr4-not complex. PLoS One. 2012;7:e51331
11. Rouault JP, Rimokh R, Tessa C, Paranhos G, Ffrench M, Duret L. et al. BTG1, a member of a new family of antiproliferative genes. EMBO J. 1992;11:1663-70
12. Guehenneux F, Duret L, Callanan MB, Bouhas R, Hayette S, Berthet C. et al. Cloning of the mouse BTG3 gene and definition of a new gene family (the BTG family) involved in the negative control of the cell cycle. Leukemia. 1997;11:370-5
13. Corjay MH, Kearney MA, Munzer DA, Diamond SM, Stoltenborg JK. Antiproliferative gene BTG1 is highly expressed in apoptotic cells in macrophage-rich areas of advanced lesions in Watanabe heritable hyperlipidemic rabbit and human. Lab Invest. 1998;78:847-58
14. Lee H, Cha S, Lee MS, Cho GJ, Choi WS, Suk K. Role of antiproliferative B cell translocation gene-1 as an apoptotic sensitizer in activation-induced cell death of brain microglia. J Immunol. 2003;171:5802-11
15. Rouault JP, Prevot D, Berthet C, Birot AM, Billaud M, Magaud JP. et al. Interaction of BTG1 and p53-regulated BTG2 gene products with mCaf1, the murine homolog of a component of the yeast CCR4 transcriptional regulatory complex. J Biol Chem. 1998;273:22563-9
16. Sun GG, Wang YD, Cheng YJ, Hu WN. BTG1 underexpression is an independent prognostic marker in esophageal squamous cell carcinoma. Tumour Biol. 2014;35:9707-16
17. Sun GG, Wang YD, Cheng YJ, Hu WN. The expression of BTG1 is downregulated in nasopharyngeal carcinoma and possibly associated with tumour metastasis. Mol Biol Rep. 2014;41:5979-88
18. Sun GG, Lu YF, Cheng YJ, Yang CR, Liu Q, Jing SW. et al. Expression of BTG1 in hepatocellular carcinoma and its correlation with cell cycles, cell apoptosis, and cell metastasis. Tumour Biol. 2014;35:11771-9
19. Sun GG, Lu YF, Cheng YJ, Hu WN. The expression of BTG1 is downregulated in NSCLC and possibly associated with tumor metastasis. Tumour Biol. 2014;35:2949-57
20. Sun G, Liu Q, Cheng Y, Hu W. B cell translocation gene 1 reduces the biological outcome of kidney cancer through induction of cell proliferation, cell cycle arrest, cell apoptosis and cell metastasis. Int J Mol Med. 2015;35:777-83
21. Liu C, Tao T, Xu B, Lu K, Zhang L, Jiang L. et al. BTG1 potentiates apoptosis and suppresses proliferation in renal cell carcinoma by interacting with PRMT1. Oncol Lett. 2015;10:619-24
22. Zhu R, Zou ST, Wan JM, Li W, Li XL, Zhu W. BTG1 inhibits breast cancer cell growth through induction of cell cycle arrest and apoptosis. Oncol Rep. 2013;30:2137-44
23. Livak KJ, Schmittgen TD. Analysis of relative gene expression data using real-time quantitative PCR and the 2(-Delta Delta C(T)) Method. Methods. 2001;25:402-8
24. Zheng HC, Li J, Shen DF, Yang XF, Zhao S, Wu YZ. et al. BTG1 expression correlates with pathogenesis, aggressive behaviors and prognosis of gastric cancer: a potential target for gene therapy. Oncotarget. 2015;6:19685-705
25. Kim HS, Yoon G, Do SI, Kim SJ, Kim YW. Down-regulation of osteoprotegerin expression as a novel biomarker for colorectal carcinoma. Oncotarget. 2016;7:15187-99
26. Moon A, Do SI, Kim HS, Kim YW. Downregulation of osteoprotegerin expression in metastatic colorectal carcinoma predicts recurrent metastasis and poor prognosis. Oncotarget. 2016;7:79319-26
27. Yoon N, Yoon G, Park CK, Kim HS. Stromal p16 expression is significantly increased in malignant ovarian neoplasms. Oncotarget. 2016;7:64665-73
28. Yoon G, Koh CW, Yoon N, Kim JY, Kim HS. Stromal p16 expression is significantly increased in endometrial carcinoma. Oncotarget. 2017;8:4826-36
29. Park CK, Yoon G, Cho YA, Kim HS. Clinicopathological and immunohistochemical characterization of papillary proliferation of the endometrium: A single institutional experience. Oncotarget. 2016;7:39197-206
30. Yoon N, Kim JY, Kim HS. Clinical outcomes of advanced-stage glassy cell carcinoma of the uterine cervix: a need for reappraisal. Oncotarget. 2016;7:78448-54
31. Kim HS, Yoon G, Ryu JY, Cho YJ, Choi JJ, Lee YY. et al. Sphingosine kinase 1 is a reliable prognostic factor and a novel therapeutic target for uterine cervical cancer. Oncotarget. 2015;6:26746-56
32. Kanda M, Oya H, Nomoto S, Takami H, Shimizu D, Hashimoto R. et al. Diversity of clinical implication of B-cell translocation gene 1 expression by histopathologic and anatomic subtypes of gastric cancer. Dig Dis Sci. 2015;60:1256-64
33. Wu X, Ding N, Hu W, He J, Xu S, Pei H. et al. Down-regulation of BTG1 by miR-454-3p enhances cellular radiosensitivity in renal carcinoma cells. Radiat Oncol. 2014;9:179
34. Lu K, Liu C, Tao T, Zhang X, Zhang L, Sun C. et al. MicroRNA-19a regulates proliferation and apoptosis of castration-resistant prostate cancer cells by targeting BTG1. FEBS Lett. 2015;589:1485-90
35. Kanda M, Sugimoto H, Nomoto S, Oya H, Hibino S, Shimizu D. et al. Bcell translocation gene 1 serves as a novel prognostic indicator of hepatocellular carcinoma. Int J Oncol. 2015;46:641-8
36. Sheng SH, Zhao CM, Sun GG. BTG1 expression correlates with the pathogenesis and progression of breast carcinomas. Tumour Biol. 2014;35:3317-26
Author contact
![]() Corresponding author: Dr. Hyun-Soo Kim, Department of Pathology, Severance Hospital, Yonsei University College of Medicine, 50-1, Yonsei-ro, Seodaemun-gu, Seoul 03722, Republic of Korea. Tel: +82-2-2228-1794; Fax: +82-2-362-0860; Email: hyunsookimac
Corresponding author: Dr. Hyun-Soo Kim, Department of Pathology, Severance Hospital, Yonsei University College of Medicine, 50-1, Yonsei-ro, Seodaemun-gu, Seoul 03722, Republic of Korea. Tel: +82-2-2228-1794; Fax: +82-2-362-0860; Email: hyunsookimac
Citation styles
APA
Kim, J.Y., Do, S.I., Bae, G.E., Kim, H.S. (2017). B-cell translocation gene 1 is downregulated by promoter methylation in ovarian carcinoma. Journal of Cancer, 8(14), 2669-2675. https://doi.org/10.7150/jca.21037.
ACS
Kim, J.Y.; Do, S.I.; Bae, G.E.; Kim, H.S. B-cell translocation gene 1 is downregulated by promoter methylation in ovarian carcinoma. J. Cancer 2017, 8 (14), 2669-2675. DOI: 10.7150/jca.21037.
NLM
Kim JY, Do SI, Bae GE, Kim HS. B-cell translocation gene 1 is downregulated by promoter methylation in ovarian carcinoma. J Cancer 2017; 8(14):2669-2675. doi:10.7150/jca.21037. https://www.jcancer.org/v08p2669.htm
CSE
Kim JY, Do SI, Bae GE, Kim HS. 2017. B-cell translocation gene 1 is downregulated by promoter methylation in ovarian carcinoma. J Cancer. 8(14):2669-2675.
This is an open access article distributed under the terms of the Creative Commons Attribution (CC BY-NC) license (https://creativecommons.org/licenses/by-nc/4.0/). See http://ivyspring.com/terms for full terms and conditions.