Journal of Cancer
ISSN: 1837-9664
3.2
Impact Factor
ISSN: 1837-9664

 Global reach, higher impact
J Cancer 2017; 8(11):2018-2025. doi:10.7150/jca.18683 This issue Cite
Research Paper
PD-L1 Expression Is Associated with FOXP3+ Regulatory T-Cell Infiltration of Soft Tissue Sarcoma and Poor Patient Prognosis
Yi Que1, Wei Xiao1, Yuan-xiang Guan2, Yao Liang2, Shu-mei Yan3, Huo-ying Chen1, Qiao-qiao Li4, Bu-shu Xu1, Zhi-wei Zhou2 ![]() , Xing Zhang1
, Xing Zhang1 ![]()
1. Department of Medical Melanoma and Sarcoma, State Key Laboratory of Oncology in South China, Collaborative Innovation Center for Cancer Medicine, Sun Yat-sen University Cancer Center, 651 East Dongfeng Road, Guangzhou 510060, China
2. Department of Gastric and Pancreatic Surgery, State Key Laboratory of Oncology in South China, Collaborative Innovation Center for Cancer Medicine, Sun Yat-sen University Cancer Center, 651 East Dongfeng Road, Guangzhou 510060, China
3. Department of Pathology, State Key Laboratory of Oncology in South China, Collaborative Innovation Center for Cancer Medicine, Sun Yat-sen University Cancer Center, 651 East Dongfeng Road, Guangzhou 510060, China
4. Department of Radiation Oncology, State Key Laboratory of Oncology in South China, Collaborative Innovation Center for Cancer Medicine, Sun Yat-sen University Cancer Center, 651 East Dongfeng Road, Guangzhou 510060, China
Received 2016-12-9; Accepted 2017-4-1; Published 2017-7-5
Citation:
Que Y, Xiao W, Guan Yx, Liang Y, Yan Sm, Chen Hy, Li Qq, Xu Bs, Zhou Zw, Zhang X. PD-L1 Expression Is Associated with FOXP3+ Regulatory T-Cell Infiltration of Soft Tissue Sarcoma and Poor Patient Prognosis. J Cancer 2017; 8(11):2018-2025. doi:10.7150/jca.18683. https://www.jcancer.org/v08p2018.htm
Other stylesAbstract
Background: Programmed death ligand-1(PD-L1) functions as a negative mediator of immune response through different pathways in anti-tumor immunity. Recent studies have reported that PD-L1 plays a pivotal role in the function of regulatory T-cells (Tregs). Although increases in FOXP3+ Tregs infiltration and PD-L1 expression have been revealed in several cancers, their correlation with soft tissue sarcoma remains unknown.
Methods: We included 163 cases of soft tissue sarcoma who were diagnosed and underwent extensive and radical resection at the Sun Yat-sen University Cancer Center, Guangzhou, China, from 2000-2010. PD-L1 and FOXP3 expression was evaluated by immunohistochemistry. Correlation between their expressions and associations with clinicopathological features were studied.
Results: Among 163 STS samples, 19 (11.7%) exhibited PD-L1 positivity, and 41 (25.2%) cases expressed high FOXP3+ Treg infiltration. Significant correlation between PD-L1 expression and FOXP3+Treg infiltration in STS was identified (r=0.450, p<0.001). In univariate analysis, PD-L1 expression was significantly associated with high tumor grade and the age of patients, while the presence of FOXP3+ in tumor infiltrating Tregs was significantly associated with the age of patients, high tumor stage, higher tumor grade and tumor depth. Multivariate analysis revealed PD-L1 and FOXP3 as independent prognostic indicators significantly associated with OS and DFS.
Conclusions: Our study revealed that PD-L1 and FOXP3+Tregs may work synergistically in promoting immune evasion of the tumors in soft tissue sarcoma. A combined strategy to block PD-L1/PD-1 with simultaneous depletion of Tregs may show promise in enhancing the therapeutic efficacy of these patients.
Keywords: Soft tissue sarcoma, PD-L1, FOXP3+, prognosis
Introduction
Soft tissue sarcomas (STSs) are a group of rare neoplasms of mesenchymal origin and account for approximately for 1.5% of all human malignancies [1]. Primary treatments for STS include surgical resection with or without adjuvant radiation; however, the 5-year probability of local recurrence and metastasis remains high [2, 3]. Response to conventional chemotherapy and radiation therapy varies. Some subtypes are sensitive to conventional chemotherapy and radiation therapy, while other subtypes are strongly resistant. Thus far, immunotherapy is considered the foremost method in individualized medicine and has recently achieved tremendous success in melanoma, lung cancer, and renal cell cancer [4-6]. Understanding how immunology relates to sarcomas may reveal the potential for immunotherapy to be effectively used in the treatment of sarcoma.
PD-L1 (also known as B7-H1) is an identified member of the B7 family. PD-L1 is expressed on immunocompetent cells such as T cells, B cells, dendritic cells (DCS) and macrophages [7]. Overexpression of PD-L1 in tumors has been shown to inhibit T-cell activation and proliferation while inducing apoptosis in the T-effector cells, leading to diminished immune responses and the impairment of protective immunity against cancer [8, 9]. Thus, PD-L1 functions as a negative mediator of immune response through various pathways in anti-tumor immunity. Recently, PD-L1 expression has been studied to predict clinical response in several cancers [10-12]. However, its expression and impact on the prognosis of patients with STS is not well studied and remains controversial [13, 14].
Regulatory T cells (Tregs) are a subset of T lymphocytes that possess a capacity to suppress the proliferation and cytokine secretion of effector T lymphocytes. This unique subset of CD4+ helper T cells is characterized by the CD4+CD25+phenotype. FOXP3, a forkhead helix transcription factor, appears to function as a master regulator in the development and control of Tregs [15, 16], and it has been regarded as the most specific and reliable surface marker of Tregs [17]. Furthermore, Tregs has been found in a number of human tumors and is considered a biomarker and prognostic factor for human malignant tumors [18, 19]
PD-L1 has been confirmed to play a critical role in the development and functional maintenance of Tregs. Francisco demonstrated that PD-L1 can inhibit T cell responses by converting naive CD4 T cells to iTreg cells, indicating that PD-L1 has a pivotal role in regulating induced T reg(iTreg) cell development and sustaining iTreg cell fuction[20]. Wang et al. demonstrated that blocking PD-L1 signaling abolished induction in a tumor-induced Treg conversion model in vivo [21]. Although the infiltration of FOXP3+Tregs and PD-L1 expression have been reported in patients with gastric cancer, colorectal carcinoma and breast cancer [22-24], their relationship to soft tissue sarcoma has not been evaluated.
In this study, we first explore the correlation between PD-L1 and FOXP3+ Tregs in 163 soft tissue sarcoma patients and further investigated their associations with clinicopathological features. We then estimated the prognosis value when combined both of the factors PD-L1 and FOXP3+Tregs in soft tissue sarcoma.
Materials and methods
Patients and clinical information
We included 163 cases of soft tissue sarcoma who were diagnosed and underwent extensive and radical resection at the Sun Yat-sen University Cancer Center, Guangzhou, China, from 2000 to 2010. Written informed consent was obtained from each patient. Ethical approval was given by the medical ethics committee of Sun Yat-sen University Cancer Center IRB. The patients were followed up for 1-176 months, with a median of 75 months, and the median age of patients at resection was 39 years (range 5-77 years). No patients had received preoperative chemotherapy or preoperative radiation therapy. Adjuvant chemotherapy was administered in 29 patients (17.8%), and adjuvant radiotherapy treatment was administered in 64 patients (39.3%). Doxorubicin-based combination chemotherapy regimens were mostly used in patients with postoperative chemotherapy. Patients with stage IV disease and a single resectable metastasis were qualified for surgery. Disease staging was classified according to the American Joint Committee on Cancer (AJCC) 7th Edition and tumors were graded according to the French Federation of Cancer Centers Sarcoma Group grading system.
Immunohistochemical staining of tumor tissues
Tumor tissues were fixed with formalin and embedded in paraffin. Immunohistochemical staining was conducted on the paraffin-embedded, 4-mm thick sections of the specimens. Each section was dewaxed and rehydrated using xylene and washed with graded alcohol. Antigen retrieval was performed for 2.5 min using EDTA buffer (pH 9.0). The sections were incubated with a primary antibody against PD-L1 (CST, E1L3N, monoclonal, 1:100 dilution), FOXP3(Abcam, ab20034, monoclonal, 1:300 dilution) for 16 h at 4℃。The sections were then incubated with goat secondary antibody molecules against rabbit and mouse immunoglobulins (DAKO). The substrate system contains 1-5% 3,3'-diaminobenzidine tetrahydrochloride.
Positive expression was evaluated independently by two pathologists. PD-L1 positivity was defined as >1% of tumor cells (minimum of 100 evaluable cells) demonstrating membrane staining. The percentage of FOXP3+ cells was calculated by dividing the total number of each respective cell type by the total number of cells present in each tissue section. For FOXP3 a cut-off of 5% was used to distinguish high density versus low-density cells.
Statistical analysis
All analyses were performed using the SPSS statistical software package (SPSS statistic 17.0). Associations between clinical and histo-pathological parameters with PD-L1 expression or FOXP3 expression were evaluated using χ2 or Fisher's exact test. The Kaplan-Meier method and log-rank test were used to estimate the distribution of DFS and OS by the PD-L1 positivity and FOXP3 positivity. Hazard ratios (HRs) estimated from the Cox analysis were reported as relative risks with corresponding 95% confidence intervals (CIs). Spearman's rank correlation test was used to assess the association of PD-L1 expression with FOXP3+Treg infiltration and clinic-pathological characteristics. All tests were two-sided, and a P value of less than 0.05 was considered statistically significant.
Results
Correlation of PD-L1 expression with FOXP3+ Treg infiltration and clinicopathological features
The association of PD-L1 positivity or FOXP3+ Treg infiltration expression with variable clinicopathological factors of STS is summarized in Table 1 and Table 2. PD-L1 was expressed mainly in tumor cells and FOXP3 was expressed in tumor infiltrating lymphocytes. Representative positive cases of PD-L1 or FOXP3 immunostaining in various STS are shown in Figure 1.
Among the 163 STS samples, 19 (11.7%) exhibited PD-L1 positivity, and 41 (25.2%) cases expressed high FOXP3+ Treg infiltration. Significant correlation between PD-L1 expression and FOXP3+Treg infiltration in STS was identified (r=0.450, p<0.001) (Table 3). To confirm our findings, we observed the PD-L1 expression and FOXP3 expression in mRNA levels in the Cancer Genome Atlas sarcoma collection and found that PD-L1 expression was correlated with FOXP3 expression (Spearman's rank correlation coefficient of 0.38, p<0.001; Figure 4)
PD-L1 expression was significantly associated with high tumor grade, and age of patients while the presence of tumor infiltrating FOXP3+ Tregs was significantly associated with the age of patients, high tumor stage, higher tumor grade and tumor depth (Table 2).
Table 1
The expression of PD-L1 and FOXP3 in different histological type of soft tissue sarcoma
| Histological type | N | PD-L1 | FOXP3 | PD-L1/FOXP3 | ||
|---|---|---|---|---|---|---|
| positive | High expression | |||||
| -/- | -/+ or +/- | +/+ | ||||
| Fibrosarcoma | 29 | 2(6.9) | 7(24.1) | 22(75.9) | 5(17.2) | 2(6.9) |
| liposarcoma | 23 | 0 | 1(4.3) | 22(95.7) | 1(4.3) | 0 |
| Undifferentiated pleomorphic sarcoma/MFH | 47 | 7(14.9) | 16(34.0) | 31(66.0) | 9(19.1) | 7(14.9) |
| Leiomyosarcoma | 9 | 2(22.2) | 2(22.2) | 5(55.6) | 4(44.4) | 0 |
| Synovial sarcoma | 21 | 1(4.8) | 6(28.6) | 15(71.4) | 5(23.8) | 1(4.8) |
| Rhabdomyosarcoma | 8 | 3(37.5) | 4(50.0) | 4(50.0) | 1(12.5) | 3(37.5) |
| MPNST | 9 | 1(11.1) | 0 | 8(88.9) | 1(11.1) | 0 |
| PNET | 6 | 1(16.7) | 0 | 5(83.3) | 1(16.7) | 0 |
| Angiosarcoma | 5 | 1(20.0) | 2(40.0) | 3(60.0) | 1(20.0) | 1(20.0) |
| Alveolar soft part sarcoma | 5 | 1(20.0) | 3(60.0) | 2(40.0) | 2(40.0) | 1(20.0) |
| Malignant Triton Tumor | 1 | 0 | 0 | 1(100.0) | 0 | 0 |
| Total | 163 | 19 | 41(25.2) | 118(72.4) | 30(18.4) | 15(9.2) |
Table 2
Clinicopathologic variables and the expressional status of PD-L1 and FOXP3 in soft tissue sarcoma
| PD-L1 expression | FOXP3 Tregs expression | |||||
|---|---|---|---|---|---|---|
| Clinicopathological parameters | negative | positive | p | low | High | p |
| Age(years) | 0.001 | 0.001 | ||||
| >65 | 136(91.3) | 13(8.7) | 117(78.5) | 32(21.5) | ||
| ≥65 | 8(57.1) | 6(42.9) | 5(35.7) | 9(64.3) | ||
| Gender | 0.133 | 0.897 | ||||
| Male | 80(85.1) | 14(14.9) | 70(74.5) | 24(25.5) | ||
| Female | 64(92.8) | 5(7.2) | 52(75.4) | 17(24.6) | ||
| Size | 0.037 | 0.134 | ||||
| <5cm | 62(82.7) | 13(17.3) | 52(69.3) | 23(30.7) | ||
| ≥5cm | 82(93.2) | 6(6.8) | 70(79.5) | 18(20.5) | ||
| Tumor depth | 0.579 | 0.044 | ||||
| Superficial | 100(89.3) | 12(10.7) | 89(79.5) | 23(20.5) | ||
| Deep | 44(86.3) | 7(13.7) | 33(64.7) | 18(35.3) | ||
| Grade | 0.026 | 0.010 | ||||
| Low grade | 119(91.5) | 11(8.5) | 103(79.2) | 27(20.8) | ||
| High grade | 25(75.8) | 8(24.2) | 19(57.6) | 14(42.4) | ||
| Site | 0.088 | 0.169 | ||||
| Trunk &extremity | 51(94.4) | 3(5.6) | 44(81.5) | 10(18.5) | ||
| Head/neck&intra-abdominal | 93(85.3) | 16(14.7) | 78(71.6) | 31(28.4) | ||
| Stage | 0.879 | 0.004 | ||||
| I+II | 120(88.9) | 15(11.1) | 107(79.3) | 28(20.7) | ||
| III+IV | 24(85.7) | 4(14.3) | 15(53.6) | 13(46.4) | ||
| Post-operative radiation | 0.121 | 0.947 | ||||
| Yes | 48(94.1) | 16(14.3) | 38(74.5) | 13(25.5) | ||
| No | 96(85.7) | 3(5.9) | 84(75.0) | 28(25.0) | ||
| Post chemotherapy | 0.939 | 0.889 | ||||
| Yes | 25(86.2) | 4(13.8) | 22(75.9) | 7(24.1) | ||
| No | 119(88.8) | 15(11.2) | 100(74.6) | 34(25.4) | ||
Table 3
Correlation between infiltration of FOXP3+ Tregs and expression of PD-L1 in 163 soft tissue sarcoma patients
| FOXP3 | ||||
|---|---|---|---|---|
| Low expression | High expression | r | p | |
| PD-L1 | 0.450 | <0.001 | ||
| Negative | 118 | 26 | ||
| positive | 4 | 15 | ||
Figure 1
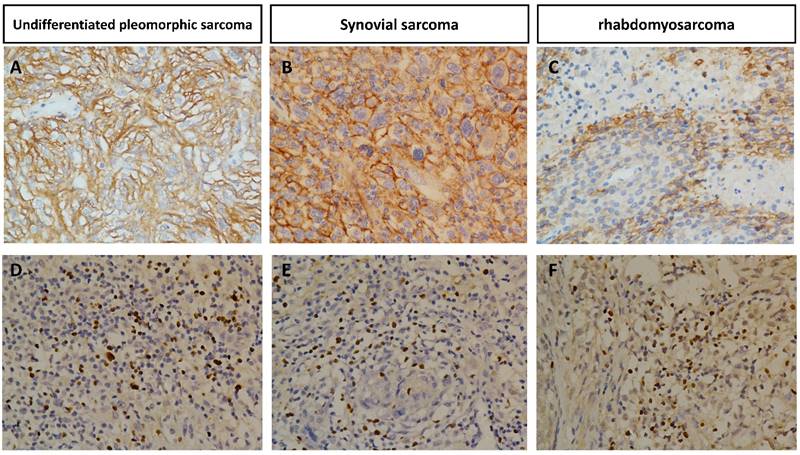
Immunohistochemical expression of PD-L1 in undifferentiated pleomorphic sarcoma(A), synovial sarcoma(B), rhabdomyosarcoma(C) and FOXP3+ infiltration Tregs in undifferentiated pleomorphic sarcoma(D), synovial sarcoma(E), rhabdomyosarcoma(F) Original magnification, 400 x.
Prognostic significance of PD-L1 expression and FOXP3+ Treg infiltration
Univariate analysis revealed that PD-L1 expression or infiltration of FOXP3+ Tregs was significantly correlated with OS and DFS (Figure 2, Table 4). The expression of PD-L1 predicted shorter OS (HR:3.101, 95%CI: 1.570-6.125, p=0.001) and DFS (HR:2.575; 95%CI: 1.493-4.442, p=0.001) (Table 4). Intra-tumoral high infiltration of FOXP3+ Tregs also predicted shorter OS (HR:2.259; 95%CI: 1.249-4.084; p=0.007) and DFS (HR:1.587, 95%CI: 1.015-2.483, p=0.043) (Table 4). PD-L1/FOXP3 was also significantly correlated with OS and DFS (Figure 2, Table 4). The five-year overall survival rates of PD-L1-/FOXP3-, (PD-L1+/FOXP3- or PD-L1-/FOXP3+) and PD-L1+/FOXP3+ groups were 82.9%, 65.8%, 53.3% respectively, while the five-year disease-free survival rates of the PD-L1-/FOXP3-, (PD-L1+/FOXP3- or PD-L1-/FOXP3+) and PD-L1+/FOXP3+ groups were 55.0%, 21.7%, and 13.3% respectively.
When additional analysis was performed in the subtype group of STS patients, PD-L1 expression, FOXP3+ Tregs infiltration, and PD-L1/FOXP3 were significantly associated with OS in the undifferentiated pleomorphic sarcoma patients (Figure 3). Factors including tumor grade, tumor size, tumor depth were significantly correlated with both OS and DFS in univariate analyses.
Table 4
Univariate analysis of pathological features with OS and RFS in soft tissue sarcoma
| OS | DFS | |||||
|---|---|---|---|---|---|---|
| Variables | HR | 95%CI | P | HR | 95%CI | p |
| Age, years (<65 vs ≥65) | 1.488 | 0.588-3.765 | 0.401 | 1.854 | 0.986-3.487 | 0.055 |
| Gender (male vs female) | 1.631 | 0.890-2.989 | 0.113 | 1.088 | 0.881-1.343 | 0.433 |
| Tumor grade (low grade vs high grade) | 3.365 | 1.843-6.146 | <0.001 | 3.026 | 1.916-4.779 | <0.001 |
| Tumor size (<5cm vs ≥5cm) | 1.969 | 1.066-3.638 | 0.030 | 1.564 | 1.023-2.394 | 0.039 |
| Tumor site (extremity &trunk vs head /neck & intra-abdominal | 2.050 | 1.019-4.124 | 0.044 | 1.031 | 0.666-1.596 | 0.892 |
| Tumor depth (superficial vs deep) | 2.391 | 1.117-5.117 | 0.025 | 2.401 | 1.416-4.071 | 0.001 |
| Tumor stage (I+II vs III+IV) | 2.910 | 1.554-5.447 | 0.001 | 2.015 | 1.225-3.315 | 0.006 |
| Adjuvant chemotherapy (No vs Yes) | 1.308 | 0.650-2.632 | 0.452 | 1.372 | 0.818-2.300 | 0.230 |
| Adjuvant radiation (No vs Yes) | 0.810 | 0.427-1.535 | 0.518 | 1.019 | 0.656-1.584 | 0.933 |
| PD-L1 (negative vs positive) | 3.101 | 1.570-6.125 | 0.001 | 2.575 | 1.493-4.442 | 0.001 |
| FOXP3 (low vs high) | 2.259 | 1.249-4.084 | 0.007 | 1.587 | (1.015-2.483) | 0.043 |
| PD-L1-/FOXP3- | 1.000(ref) | 0.003 | 1.000(ref) | 0.001 | ||
| PD-L1-/FOXP3+ or PD-L1+/FOXP3- | 2.296 | 1.178-4.475 | 0.015 | 1.208 | 0.713-2.047 | 0.482 |
| PD-L1+/FOXP3+ | 3.412 | 1.530-7.611 | 0.003 | 3.115 | 1.691-5.739 | <0.001 |
Figure 2
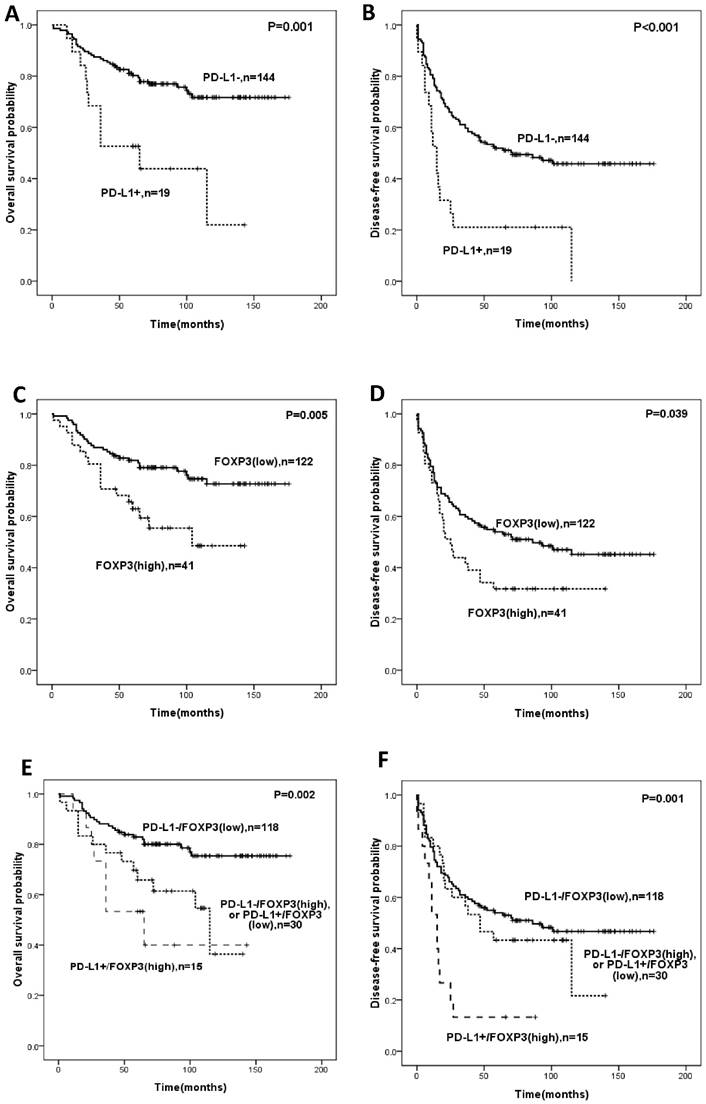
Kaplan-Meier survival analysis in soft-tissue sarcomas. Overall survival and disease-free survival according to expression of PD-L1 (A,B), FOXP3 (C,D)and the combined expression pattern of PD-L1 and FOXP3 (PD-L1/FOXP3) (E,F).
Figure 3
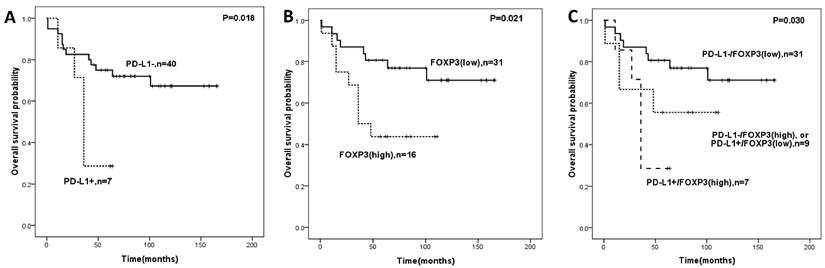
Overall survival analysis in undifferentiated pleomorphic sarcoma patients according to expression of PD-L1 (A), FOXP3 (B)and the combined expression pattern of PD-L1 and FOXP3 (PD-L1/FOXP3) (C).
Figure 4
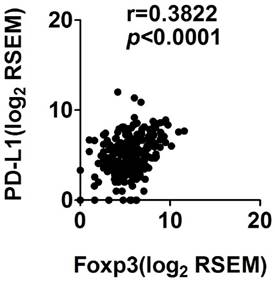
Correlation of PD-L1 and FOXP3 RNA expression in sarcoma
Table 5
Multivariate analysis of pathological features, PD-L1 expression and FOXP3+ Treg infiltration with OS and DFS in soft tissue sarcoma
| OS | DFS | |||||
|---|---|---|---|---|---|---|
| Variables | HR | 95%CI | P | HR | 95%CI | p |
| Age, years (<65 vs ≥65) | 0.960 | 0.333-2.767 | 0.940 | 1.015 | 0.478-2.117 | 0.968 |
| Gender (male vs female) | 1.295 | 0.934-1.797 | 0.121 | 1.041 | 0.830-1.307 | 0.726 |
| Tumor grade (low grade vs high grade) | 3.672 | 1.376-9.801 | 0.009 | 3.255 | 1.585-6.683 | 0.001 |
| Tumor size (<5cm vs ≥5cm) | 2.256 | 1.064-4.782 | 0.034 | 1.467 | 0.879-2.449 | 0.143 |
| Tumor site (extremity &trunk vs head /neck & intra-abdominal | 2.662 | 1.105-6.418 | 0.029 | 1.004 | 0.593-1.701 | 0.987 |
| Tumor depth (superficial vs deep) | 1.351 | 0.899-2.029 | 0.148 | 1.488 | 1.115-1.986 | 0.007 |
| Tumor stage (I+II vs III+IV) | 0.790 | 0.277-2.257 | 0.660 | 0.597 | 0.261-1.365 | 0.222 |
| Adjuvant chemotherapy (No vs Yes) | 1.162 | 0.543-2.486 | 0.699 | 1.122 | 0.640-1.968 | 0.688 |
| Adjuvant radiation (No vs Yes) | 1.270 | 0.567-2.845 | 0.562 | 1.062 | 0.624-1.809 | 0.824 |
| PD-L1-/FOXP3- | 1.000(ref) | 0.006 | 1.000(ref) | 0.008 | ||
| PD-L1-/FOXP3+ or PD-L1+/FOXP3- | 2.937 | 1.438-6.001 | 0.003 | 1.474 | 0.847-2.566 | 0.170 |
We then performed multivariate analysis for OS and DFS by including the variables such as the age of patients, gender, tumor grade, tumor size, tumor site, tumor depth, tumor stage, adjuvant chemotherapy, adjuvant radiation, and PD-L1/FOXP3 expression patterns. Multivariate analyses revealed tumor grade, tumor size, and PD-L1/FOXP3 expression patterns as independent prognostic indicators which were significantly associated with OS. For DFS, tumor grade, tumor depth and PD-L1/FOXP3 expression pattern were the independent prognostic indicators (Table 5). The samples with positive PD-L1 and high expression of FOXP3+ infiltration demonstrated poor OS (HR: 2.693, 95%CI: 1.014-7.152, p=0.047) and DFS (HR: 3.321, 95%CI: 1.533-7.191, p=0.002) compared with cases with negative PD-L1 and low expression of FOXP3+ Tregs in multivariate analyses (Table 5).
Discussion
Tumor cells can be recognized and attacked by antigen-specific T cells. PD-L1, a co-inhibitory molecule, plays a pivotal role in inducing cancer cell immune evasion by binding to its receptor PD-1[25]. Recently, PD-L1 has been considered to be a predictor of unfavorable clinical outcome in a variety of malignancies [26-28]. The role of the programmed death-1(PD-1/PD-L1) in STS is controversial. Kim recently reported that in STS tumors expressing PD-L1, up to 65% were associated with poorer prognosis and more aggressive progression of disease. These findings suggested that PD-L1 staining may be a viable biomarker for prognosis, and suggest the use of anti-PD-1 treatment as an effective strategy for treatment [13]. However, D' Angelo reported that PD-L1 tumor expression was noted in 12% of tumors with majority being gastrointestinal stromal tumors (GIST)[14]. Additionally, in contrast to the work of Kim et al., PD-L1 tumor expression did not correlate with aggressive features nor with clinical outcome.
In our study, we collected additional samples (163) and used whole-tissue sections for reliable observation in immunohistochemistry. We observed PD-L1 expression in 11.7% of the samples and found significant association with clinical outcome. Most of the specimens of our study were the primary tumors prior to metastatic progression; thus, the tumor immune microenvironment may be different from other studies. Additionally, the subtypes we analyzed are distinct and heterogeneous which indicating the variable results [29, 30].
Numerous lines of evidence have shown that the PD-L1/PD1 pathway is correlated with the maintenance of immune microenvironment. PD-L1 expression has been investigated in osteosarcoma via quantitative real-time RT-PCR, which indicated that high PD-L1 expression was associated with the presence of TILs (p=0.01) [31]. Several studies have suggested that PD-L1 plays a pivotal role in sustaining the function of iTregs in some autoimmune diseases but not in cancers. For instance, PD-L1 was found to upregulate FOXP3 expression and modulate the signaling molecules that are critical for conversion of naive T cells to Treg cells [32-34]. The same study indicated that PD-L1 expression was associated with FOXP3 expression and suggested that PD-L1 expression combined with FOXP3 expression could be an independent prognostic indicator in STS. As we have seen, our study is first to show the correlation of PD-L1 expression in sarcoma cells and FOXP3+ Treg infiltration. In addition, our results are the first to indicate a significant role of PD-1/PD-L1 signals in immune suppression through the regulation of Tregs in soft tissue sarcoma. Although PD-1 pathway has been previously reported to correlate with Tregs development and function [35, 36], the accurate mechanism still needs to be illuminated.
Because FOXP3+ Tregs and PD-L1 could counteract anti-tumor immune responses, a combined strategy based on the depletion of Tregs and the inhibition of PD-L1 may be developed to enhance therapeutic efficacy against soft tissue sarcoma. Preclinical work in implanted fibrosarcoma mouse models has shown anti-tumor activity of anti-PD-1 therapy [37]. An open-label phase II trial (SARC028) of anti-PD-1 monotherapy utilizing pembrolizumab in patients with advanced bone and soft tissue sarcomas will be the first clinical trial exploring the role of anti-PD-1 therapy and is currently undergoing patient enrolment stages. Ipilimumab, an agent that works on anti-cytotoxic T lymphocyte-associated protein 4(CTLA-4), contributes to the depletion of regulatory T cells. A pilot phase II study with ipilimumab was performed in NY-ESO-1 expressing advanced synovial sarcoma patients [38]. This trial was stopped early due to slow accrual and lack of immune response. Of note, the results might be interpreted as RECIST may not be the best criterion when using immune checkpoint inhibitors. Furthermore, perhaps CTLA-4 inhibition alone is not enough to elicit an anti-tumor response, but combination with other therapies may make a difference.
In conclusion, we found that both PD-L1 and FOXP3 exhibit high expression levels in patients with poor prognosis in soft tissue sarcoma. The combined evaluation identified that patients with the positive PD-L1 expression and high FOXP3+ Treg infiltration had the worst prognosis. Thus, a combined strategy to block PD-L1/PD-1 axis with simultaneous depletion of Tregs may show promise in enhancing the therapeutic efficacy of these patients.
Acknowledgements
This work was supported by the National Scientific Foundation of China (No. 81372887) and (No.81572403), the National Basic Research Program of China (Grant No. 2013CB910500), and the Guangdong Science and Technology Project (No. 2013B021800167).
Competing Interests
We declare no conflicts of interest.
References
1. Bannasch H, Eisenhardt SU, Grosu AL, Heinz J, Momeni A, Stark GB. The diagnosis and treatment of soft tissue sarcomas of the limbs. Deutsches Arzteblatt international. 2011;108:32-8
2. Daigeler A, Zmarsly I, Hirsch T, Goertz O, Steinau HU, Lehnhardt M. et al. Long-term outcome after local recurrence of soft tissue sarcoma: a retrospective analysis of factors predictive of survival in 135 patients with locally recurrent soft tissue sarcoma. British journal of cancer. 2014;110:1456-64
3. Weitz J, Antonescu CR, Brennan MF. Localized extremity soft tissue sarcoma: improved knowledge with unchanged survival over time. Journal of clinical oncology: official journal of the American Society of Clinical Oncology. 2003;21:2719-25
4. Hodi FS, O'Day SJ, McDermott DF, Weber RW, Sosman JA, Haanen JB. et al. Improved survival with ipilimumab in patients with metastatic melanoma. The New England journal of medicine. 2010;363:711-23
5. Zustovich F, Cartei G, Dal Bianco M, De Zorzi L, Ceravolo R, Zovato S. et al. A phase II study of gemcitabine and immunotherapy in renal cancer: preliminary results and review of the literature. Annals of oncology: official journal of the European Society for Medical Oncology / ESMO. 2006;17(Suppl 5):v133-6
6. Brahmer J, Reckamp KL, Baas P, Crino L, Eberhardt WE, Poddubskaya E. et al. Nivolumab versus Docetaxel in Advanced Squamous-Cell Non-Small-Cell Lung Cancer. The New England journal of medicine. 2015;373:123-35
7. Yamazaki T, Akiba H, Koyanagi A, Azuma M, Yagita H, Okumura K. Blockade of B7-H1 on macrophages suppresses CD4+ T cell proliferation by augmenting IFN-gamma-induced nitric oxide production. Journal of immunology (Baltimore, Md: 1950). 2005;175:1586-92
8. Hatam LJ, Devoti JA, Rosenthal DW, Lam F, Abramson AL, Steinberg BM. et al. Immune suppression in premalignant respiratory papillomas: enriched functional CD4+Foxp3+ regulatory T cells and PD-1/PD-L1/L2 expression. Clinical cancer research: an official journal of the American Association for Cancer Research. 2012;18:1925-35
9. Wenjin Z, Chuanhui P, Yunle W, Lateef SA, Shusen Z. Longitudinal fluctuations in PD1 and PD-L1 expression in association with changes in anti-viral immune response in chronic hepatitis B. BMC gastroenterology. 2012;12:109
10. Droeser RA, Hirt C, Viehl CT, Frey DM, Nebiker C, Huber X. et al. Clinical impact of programmed cell death ligand 1 expression in colorectal cancer. European journal of cancer. 2013;49:2233-42
11. Chen YB, Mu CY, Huang JA. Clinical significance of programmed death-1 ligand-1 expression in patients with non-small cell lung cancer: a 5-year-follow-up study. Tumori. 2012;98:751-5
12. Hamanishi J, Mandai M, Iwasaki M, Okazaki T, Tanaka Y, Yamaguchi K. et al. Programmed cell death 1 ligand 1 and tumor-infiltrating CD8+ T lymphocytes are prognostic factors of human ovarian cancer. Proceedings of the National Academy of Sciences of the United States of America. 2007;104:3360-5
13. Kim JR, Moon YJ, Kwon KS, Bae JS, Wagle S, Kim KM. et al. Tumor infiltrating PD1-positive lymphocytes and the expression of PD-L1 predict poor prognosis of soft tissue sarcomas. PloS one. 2013;8:e82870
14. D'Angelo SP, Shoushtari AN, Agaram NP, Kuk D, Qin LX, Carvajal RD. et al. Prevalence of tumor-infiltrating lymphocytes and PD-L1 expression in the soft tissue sarcoma microenvironment. Human pathology. 2015;46:357-65
15. Yagi H, Nomura T, Nakamura K, Yamazaki S, Kitawaki T, Hori S. et al. Crucial role of FOXP3 in the development and function of human CD25+CD4+ regulatory T cells. International immunology. 2004;16:1643-56
16. Campbell DJ, Ziegler SF. FOXP3 modifies the phenotypic and functional properties of regulatory T cells. Nature reviews Immunology. 2007;7:305-10
17. Fontenot JD, Gavin MA, Rudensky AY. Foxp3 programs the development and function of CD4+CD25+ regulatory T cells. Nature immunology. 2003;4:330-6
18. Jang TJ. Progressive Increase of Regulatory T Cells and Decrease of CD8+ T Cells and CD8+ T Cells/Regulatory T Cells Ratio during Colorectal Cancer Development. Korean journal of pathology. 2013;47:443-51
19. Pan XD, Mao YQ, Zhu LJ, Li J, Xie Y, Wang L. et al. Changes of regulatory T cells and FoxP3 gene expression in the aging process and its relationship with lung tumors in humans and mice. Chinese medical journal. 2012;125:2004-11
20. Francisco LM, Salinas VH, Brown KE, Vanguri VK, Freeman GJ, Kuchroo VK. et al. PD-L1 regulates the development, maintenance, and function of induced regulatory T cells. The Journal of experimental medicine. 2009;206:3015-29
21. Wang L, Pino-Lagos K, de Vries VC, Guleria I, Sayegh MH, Noelle RJ. Programmed death 1 ligand signaling regulates the generation of adaptive Foxp3+CD4+ regulatory T cells. Proceedings of the National Academy of Sciences of the United States of America. 2008;105:9331-6
22. Hou J, Yu Z, Xiang R, Li C, Wang L, Chen S. et al. Correlation between infiltration of FOXP3+ regulatory T cells and expression of B7-H1 in the tumor tissues of gastric cancer. Experimental and molecular pathology. 2014;96:284-91
23. Zhao LW, Li C, Zhang RL, Xue HG, Zhang FX, Zhang F. et al. B7-H1 and B7-H4 expression in colorectal carcinoma: correlation with tumor FOXP3(+) regulatory T-cell infiltration. Acta histochemica. 2014;116:1163-8
24. Li Z, Dong P, Ren M, Song Y, Qian X, Yang Y. et al. PD-L1 Expression Is Associated with Tumor FOXP3(+) Regulatory T-Cell Infiltration of Breast Cancer and Poor Prognosis of Patient. Journal of Cancer. 2016;7:784-93
25. Dong H, Strome SE, Salomao DR, Tamura H, Hirano F, Flies DB. et al. Tumor-associated B7-H1 promotes T-cell apoptosis: a potential mechanism of immune evasion. Nature medicine. 2002;8:793-800
26. Gadiot J, Hooijkaas AI, Kaiser AD, van Tinteren H, van Boven H, Blank C. Overall survival and PD-L1 expression in metastasized malignant melanoma. Cancer. 2011;117:2192-201
27. Choueiri TK, Fay AP, Gray KP, Callea M, Ho TH, Albiges L. et al. PD-L1 expression in nonclear-cell renal cell carcinoma. Annals of oncology: official journal of the European Society for Medical Oncology / ESMO. 2014;25:2178-84
28. Mittendorf EA, Philips AV, Meric-Bernstam F, Qiao N, Wu Y, Harrington S. et al. PD-L1 expression in triple-negative breast cancer. Cancer immunology research. 2014;2:361-70
29. Paydas S, Bagir EK, Deveci MA, Gonlusen G. Clinical and prognostic significance of PD-1 and PD-L1 expression in sarcomas. Medical oncology. 2016;33:93
30. Kim C, Kim EK, Jung H, Chon HJ, Han JW, Shin KH. et al. Prognostic implications of PD-L1 expression in patients with soft tissue sarcoma. BMC cancer. 2016;16:434
31. Shen JK, Cote GM, Choy E, Yang P, Harmon D, Schwab J. et al. Programmed cell death ligand 1 expression in osteosarcoma. Cancer immunology research. 2014;2:690-8
32. Jin HT, Ahmed R, Okazaki T. Role of PD-1 in regulating T-cell immunity. Current topics in microbiology and immunology. 2011;350:17-37
33. Burton OT, Zaccone P, Phillips JM, De La Pena H, Fehervari Z, Azuma M. et al. Roles for TGF-beta and programmed cell death 1 ligand 1 in regulatory T cell expansion and diabetes suppression by zymosan in nonobese diabetic mice. Journal of immunology (Baltimore, Md: 1950). 2010;185:2754-62
34. Zhao Y, Huang Z, Qi M, Lazzarini P, Mazzone T. Immune regulation of T lymphocyte by a newly characterized human umbilical cord blood stem cell. Immunology letters. 2007;108:78-87
35. Francisco LM, Sage PT, Sharpe AH. The PD-1 pathway in tolerance and autoimmunity. Immunological reviews. 2010;236:219-42
36. Amarnath S, Costanzo CM, Mariotti J, Ullman JL, Telford WG, Kapoor V. et al. Regulatory T cells and human myeloid dendritic cells promote tolerance via programmed death ligand-1. PLoS biology. 2010;8:e1000302
37. Wei S, Shreiner AB, Takeshita N, Chen L, Zou W, Chang AE. Tumor-induced immune suppression of in vivo effector T-cell priming is mediated by the B7-H1/PD-1 axis and transforming growth factor beta. Cancer research. 2008;68:5432-8
38. Maki RG, Jungbluth AA, Gnjatic S, Schwartz GK, D'Adamo DR, Keohan ML. et al. A Pilot Study of Anti-CTLA4 Antibody Ipilimumab in Patients with Synovial Sarcoma. Sarcoma. 2013;2013:168145
Author contact
![]() Corresponding authors: zhangxingorg.cn; Tel: 86-020-87343629; Fax: 86-020-87342021
Corresponding authors: zhangxingorg.cn; Tel: 86-020-87343629; Fax: 86-020-87342021
Citation styles
APA
Que, Y., Xiao, W., Guan, Y.x., Liang, Y., Yan, S.m., Chen, H.y., Li, Q.q., Xu, B.s., Zhou, Z.w., Zhang, X. (2017). PD-L1 Expression Is Associated with FOXP3+ Regulatory T-Cell Infiltration of Soft Tissue Sarcoma and Poor Patient Prognosis. Journal of Cancer, 8(11), 2018-2025. https://doi.org/10.7150/jca.18683.
ACS
Que, Y.; Xiao, W.; Guan, Y.x.; Liang, Y.; Yan, S.m.; Chen, H.y.; Li, Q.q.; Xu, B.s.; Zhou, Z.w.; Zhang, X. PD-L1 Expression Is Associated with FOXP3+ Regulatory T-Cell Infiltration of Soft Tissue Sarcoma and Poor Patient Prognosis. J. Cancer 2017, 8 (11), 2018-2025. DOI: 10.7150/jca.18683.
NLM
Que Y, Xiao W, Guan Yx, Liang Y, Yan Sm, Chen Hy, Li Qq, Xu Bs, Zhou Zw, Zhang X. PD-L1 Expression Is Associated with FOXP3+ Regulatory T-Cell Infiltration of Soft Tissue Sarcoma and Poor Patient Prognosis. J Cancer 2017; 8(11):2018-2025. doi:10.7150/jca.18683. https://www.jcancer.org/v08p2018.htm
CSE
Que Y, Xiao W, Guan Yx, Liang Y, Yan Sm, Chen Hy, Li Qq, Xu Bs, Zhou Zw, Zhang X. 2017. PD-L1 Expression Is Associated with FOXP3+ Regulatory T-Cell Infiltration of Soft Tissue Sarcoma and Poor Patient Prognosis. J Cancer. 8(11):2018-2025.
This is an open access article distributed under the terms of the Creative Commons Attribution (CC BY-NC) license (https://creativecommons.org/licenses/by-nc/4.0/). See http://ivyspring.com/terms for full terms and conditions.