Journal of Cancer
ISSN: 1837-9664
3.2
Impact Factor
ISSN: 1837-9664

 Global reach, higher impact
J Cancer 2017; 8(7):1249-1254. doi:10.7150/jca.18230 This issue Cite
Research Paper
Impact Of Circulating T Helper 1 And 17 Cells in the Blood on Regional Lymph Node Invasion in Colorectal Cancer
Ji Yeon Lee1*, Eun-Hye Seo1*, Chung-Sik Oh2, Jin-Hee Paik3, Dae-Yong Hwang3, Seung Hyun Lee1, Seong-Hyop Kim2, 4 ![]()
1. Department of Microbiology, Konkuk University School of Medicine, Seoul, Korea;
2. Department of Anesthesiology and Pain medicine, Konkuk University Medical Center, Konkuk University School of Medicine, Seoul, Korea;
3. Department of Surgery, Konkuk University Medical Center, Konkuk University School of Medicine, Seoul, Korea;
4. Department of Medicine, Institute of Biomedical Science and Technology, Konkuk University School of Medicine, Seoul, Korea.
* The two authors evenly contributed to the study as first author.
Received 2016-11-6; Accepted 2017-3-5; Published 2017-5-10
Citation:
Lee JY, Seo EH, Oh CS, Paik JH, Hwang DY, Lee SH, Kim SH. Impact Of Circulating T Helper 1 And 17 Cells in the Blood on Regional Lymph Node Invasion in Colorectal Cancer. J Cancer 2017; 8(7):1249-1254. doi:10.7150/jca.18230. https://www.jcancer.org/v08p1249.htm
Other stylesAbstract
We hypothesised that the blood levels of immune cells would be related to the progression of colorectal cancer and regional lymph node metastasis. We investigated the association between the blood levels of immune cells and regional lymph node metastasis in colorectal cancer patients. Patients with American Joint Committee on Cancer (AJCC) stages 1 and 2 colorectal cancer were assigned to Early stage group and those with AJCC stages 3 and 4 were assigned to Late stage group. Blood levels of circulating immune cells, such as cluster of differentiation (CD)4+ including T helper 1 (Th1) and 17 (Th17) cells, regulatory T (Treg) cells, CD8+ T cells, and natural killer (NK) cells were assessed using fluorescence-activated cell sorting (FACS). The blood levels of CD4+ T, Treg, CD8+ T, and NK cells did not significantly differ between the two groups. However, the blood levels of Th1 and Th17 cells did significantly differ between the groups. Specifically, Late stage group had higher levels of Th1 and Th17 cells than Early stage group (Th1, 11.14±1.22% vs. 16.25±1.57%, p = 0.015; Th17, 3.32±0.05% vs. 1.11±0.15%, p < 0.01). In conclusion, the blood levels of Th1 and Th17 cells significantly increased as the N stage increased. The blood levels of Th1 and Th17 cells might be useful as predictive markers of lymph node invasion in colorectal cancer.
Keywords: immune cell, lymph node metastasis, colorectal cancer, helper T cell.
Introduction
Colorectal cancer is the most common form of malignant tumour and the second leading cause of cancer-related death worldwide [1]. Several serum cancer screening markers, including carcinoembryonic antigen (CEA), α‑fetoprotein (AFP), and carbohydrate antigen 19-9 (CA19-9), are used to screen the colorectal cancer. However, the use of these serum markers to diagnose colorectal cancer and predict prognosis remains controversial [2, 3, 4].
Previous studies have demonstrated that immune cells in the cancer tissue play important roles in cancer progression. Indeed, they can produce cytokines, which affect cancer growth, within the cancer tissue. They can also recruit other immune cells to the cancer tissue, supporting or inhibiting cancer growth [5, 6, 7, 8].
However, the acquisition of cancer tissue to check immune cell activity is possible only through an invasive procedure. Moreover, not only the procedure but the related complications may influence the progression of the cancer. Given the relationship between immune cell levels within the cancer tissue and cancer progression, the blood levels of immune cell may be related to cancer progression. However, there is no reported study about this issue.
We hypothesised that the blood levels of immune cells would be related to the progression of colorectal cancer and regional lymph node metastasis. This study investigated the association between the blood levels of immune cells and the progression of colorectal cancer in colorectal cancer patients with and without regional lymph node metastasis.
Materials and Methods
Study population
The study was approved by the Institutional Review Board of Konkuk University Medical Centre, Seoul, Korea (KUH1160096) and was registered at http://cris.nih.go.kr (NCT02869269). All subjects provided written informed consent.
Patients undergoing surgery under general anaesthesia for colorectal cancer between October 2015 and July 2016 were enrolled. Patients were excluded if they had histories of 1) chemotherapy, 2) radiotherapy, 3) immunosuppressive agent use, 4) bone marrow transplantation, and 5) any present symptom or sign of infection. Patients were assigned to the Early stage or Late stage group according to the presence of lymph node metastasis; the latter was determined based on preoperative computed tomography (CT) and bone scans, intraoperative surgical and pathological findings, and postoperative pathological findings.
Colorectal cancer staging
The stage of colorectal cancer was confirmed by perioperative evaluations and pathological findings. Staging followed the American Joint Committee on Cancer (AJCC) scheme using TNM classifications. The T stage describes the size of the primary colorectal cancer tumour and whether it has invaded nearby tissue (depth). The N stage describes the regional lymph nodes that are involved (regional lymph node metastasis). The M stage describes distant metastasis [9]. We assigned patients with AJCC stages 1 and 2 to the Early stage group and those with AJCC stages 3 and 4 to the Late stage group.
Blood sampling
In total, 12 mL blood was drawn from the antecubital vein and collected in ethylenediamine tetraacetic acid (EDTA) tubes to be used for enzyme-linked immunosorbent assay (ELISA) analyses for serum cancer markers, including CEA, AFP, CA19-9, and circulating immune cells.
Blood levels of T Helper 1 (Th1) and 17 (Th17) cells
Peripheral blood mononuclear cells (PBMC) were isolated using density gradient centrifugation for 20 min over a Biocoll separating solution (BioChrom, German). PBMCs were washed with phosphate-buffered saline 1× solution (PBS 1× = no calcium, no magnesium, 155.1 mM NaCl, 2.9 mM Na2HPO4-7H2O and 1.0 mM KH2PO4, pH 7.4; Gibco, [Big Cabin/OK] USA).
After the isolation of PBMCs, cells were stained with pyridine chlorophyll (PerCP) anti-human cluster of differentiation (CD)4 (BD Biosciences, [Franklin Lakes/NJ] USA) at room temperature for 30 min in the dark. After staining, the cells were washed with fluorescence-activated cell sorter (FACS) buffer (0.1% bovine serum albumin and 0.05% sodium azide in PBS) and stimulated with RPMI 1640 medium (Gibco, USA) with 50 ng/mL phorbol 12‑myristate 13-acetate (Sigma-Aldrich, , [St. Louis/MO] USA), 1 µg/mL inomycin (Sigma-Aldrich), and Golgi stop (BD Biosciences) in a 5% carbon dioxide incubator at 37°C for 4 h. After stimulation, the cells were washed in FACS buffer and fixed in 4% paraformaldehyde at room temperature for 10 min in the dark. After fixation, the cells were permeabilised with FACS Perm2 (BD Biosciences) buffer for 10 min in the dark. After permeabilisation, the cells were washed in FACS buffer and stained with fluorescein isothiocyanate (FITC), anti-human interferon-gamma (IFN-γ) (BD Biosciences), and phycoerythrin (PE) anti-human inteleukin-17A (eBioscience, [San Diego/CA] USA) antibodies for 30 min in the dark.
Circulating regulatory T (Treg) cells
After the isolation of PBMCs, the cells were stained with PerCP anti-human CD4+ and allophycocyanin (APC) anti-human CD25 antibodies at room temperature for 30 min in the dark. Next, the cells were washed in FACS buffer and incubated with fork head box protein P3 (Foxp3) fixation/permeabilisation buffer (Biolegend, [San Diego/CA] USA) at room temperature for 20 min in the dark. After incubation, the cells were washed in FACS buffer and stained using PE anti-human Foxp3 (Biolegend) antibody at room temperature for 30 min in the dark. After the cells were washed again, they were evaluated by flow cytometry, gated for CD4+ CD25high cells.
Circulating CD8+ T and natural killer (NK) cells
After isolation of PBMCs, the CD8+ T cells were stained with PE anti-human CD8 (BD Biosciences) and PerCP anti-human CD95 (BD Biosciences) antibodies for 30 min in the dark. NK cells were stained with PE anti-human CD16 (BD Bioscience), APC anti-human CD56 (BD Biosciences), and PerCP anti-human CD95 (BD Biosciences) antibodies for 30 min in the dark. After staining, the cells were washed with cell staining buffer (Biolegend, USA) and stained using FITC anti-human annexin-V (Biolegend) antibody for 30 min in the dark. After staining, the cells were fixed with 4% paraformaldehyde at room temperature for 10 min in the dark. All data were collected using a FACSCalibur cell sorter (BD Biosciences, USA). Data were analysed using the FlowJo software (ver. 10.2; Tree Star Inc., [Ashland/OR] USA).
Statistical analysis
The primary outcome was the blood level of Th1 cells and the secondary outcome was the blood level of Th17 cells. In a pilot study of 10 colorectal cancer patients, the levels of Th1 cells were 15.08±0.57% in the Early stage group and 13.97±1.86% in the Late stage group. The levels of Th17 cells were 3.47±1.93% in the Early stage group and 1.72±1.74% in the Late stage group. An a priori power analysis revealed an effect size of 0.807 and a power of 0.8 for Th1 cells; the effect size was 0.952 and the power was 0.8 for Th17 cells. The calculated sample size for the primary outcome was 26 in each group, and it was 19 in each group for the secondary outcome, the α value was 0.05.
Intergroup differences between early and late stages were analysed using an independent t-test or the Mann-Whitney U-test according to the normality of the distribution of the data. One-way analysis of variance (ANOVA) was used to compare group differences in regional lymph node metastasis. Categorical variables were analysed using the χ2 test. To obtain cut-off values for blood levels of Th1and Th17 cells to distinguish Early and Late stages, area under curve (AUC), using receiver operation characteristic (ROC) curve analysis, was performed.
All data are expressed in terms of number of patients, mean ± standard deviation, or median (interquartile range). A P value < 0.05 was considered to indicate statistical significance. Data were analysed using SPSS software (ver. 20.0 for Windows; SPSS, Inc., Chicago, IL, USA).
Results
In total, 62 patients were eligible for participation in the study from October 2015 to July 2016. Five patients were excluded for the following reasons: one patient had undergone chemotherapy, two had undergone radiotherapy, and two were taking immunosuppressive agents. Thus, 57 patients were included in the final analysis (Fig. 1).
Figure 1
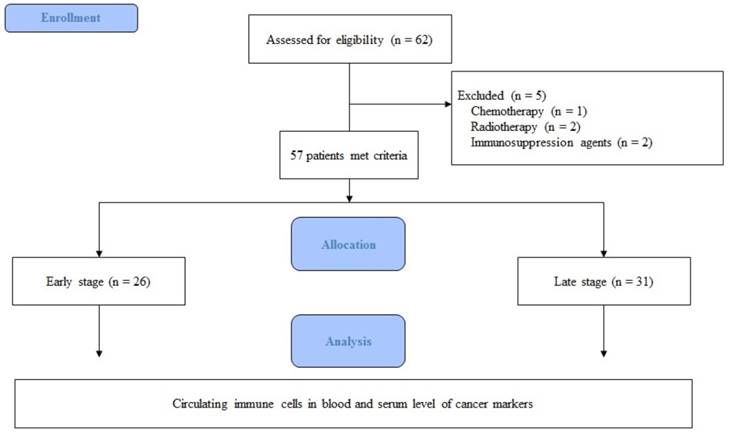
Flow chart of the study.
Figure 2
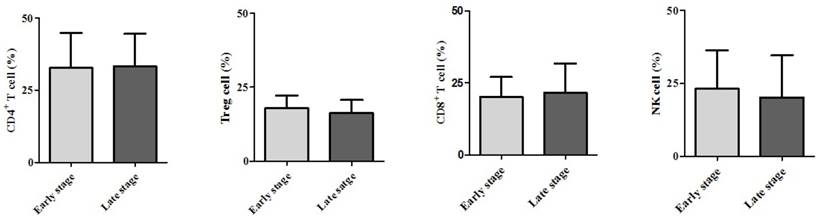
Expression of circulating immune cells in the blood. Abbreviations: CD, cluster of differentiation; Treg cell, regulatory T cell; NK cell, natural killer cell.
Demographic data are provided in Table 1. The only significant difference between the groups concerned cancer TNM stage (Table 1). The serum cancer markers assessed did not significantly differ between Early and Late stages (Table 2). The blood levels of CD4+ T, Treg, CD8+ T and NK immune cells also did not significantly differ between early and late groups (Fig. 2). However, the blood levels of Th1 and Th17 cells did significantly differ between groups. Specifically, the Late stage group had higher levels of Th1 and Th17 cells than did the Early stage group (Th1, 11.14±1.22% vs. 16.25±1.57%, p = 0.015; Th17, 3.32±0.05% vs. 1.11±0.15%, p < 0.01; Fig. 3). The AUCs for blood levels of Th1 and Th17 cells between Early and Late stages were 0.705 with (p = 0.014) and 0.793 (p < 0.01), respectively. The cut-off values of blood levels of Th1 and Th17 cells, used to distinguish Early and Late stages, were 13.88% (sensitivity 69.6% and specificity 69.2%) and 2.27% (sensitivity 65.2% and specificity 92.3%) (Fig. 4). The blood levels of Th1 and Th17 cells also significantly increased as the N stage increased (Fig. 5).
Discussion
The present study showed Early and Late stages did not differ significantly with regard to the blood levels of immune cells or the colorectal cancer serum markers assessed. However, the blood levels of Th1 and Th17 did significantly differ between groups. Moreover, these cells significantly increased as the N stage increased.
Tumourigenesis is usually accompanied by abnormal expressions of autoantibodies or other tumour markers in the body, and these can be used for tumour diagnosis and prognostic predictions. However, the serum cancer markers CEA, AFP, and CA19-9 reflected no significant differences between the Early and Late stages in this present study. In fact, serum cancer markers are more useful as screening rather than as confirmative tools for cancers, as they demonstrate high sensitivity and low specificity. Their cut-offs for screening for cancer vary according to gender, age, and location of tumour [3,4]. Thus, it was not surprising that we found no difference between the early and late stages in this study.
Table 1
Demographic data.
| Early stage | Late stage | p value | ||
|---|---|---|---|---|
| Age (yr) | 62 ± 7 | 65 ±15 | 0.412 | |
| Gender | 0.276 | |||
| Male | 19 (73.1) | 18 (58.1) | ||
| Female | 7 (26.9) | 13 (41.9) | ||
| Tumor location | 0.922 | |||
| Ascending | 6 (23.1) | 7 (22.6) | ||
| Transverse | 1 (3.8) | 1 (3.2) | ||
| Descending | - | 1 (3.2) | ||
| Sigmoid | 4 (15.4) | 4 (12.9) | ||
| Rectal | 15 (57.7) | 18 (58.1) | ||
| Tumor depth | 0.005 | |||
| T1 | 6 (23) | 3 (9.7) | ||
| T2 | 10 (38.5) | 3 (9.7) | ||
| T3 | 10 (38.5) | 20 (64.5) | ||
| T4 | - | 5 (16.1) | ||
| Regional lymph node invasion | 0.000 | |||
| Yes | - | 28 (90.3) | ||
| No | 26 (100) | 3 (9.7) | ||
| Distant metastasis | 0.003 | |||
| Yes | - | 9 (29.0) | ||
| No | 26 (100) | 22 (71.0) | ||
| Tumor differentiation | 0.532 | |||
| Well | 3 (11.5) | 2 (6.5) | ||
| Moderate | 23 (88.5) | 2 8 (90.3) | ||
| Poor | - | 1 (3.2) |
Values are expressed as the mean ± standard deviation.
Abbreviations: T, Tumor depth.
Table 2
Serum cancer markers.
| Early stage | Late stage | P value | |
|---|---|---|---|
| CEA (ug/ml) | 19.30 ± 10.63 | 13.18 ± 7.09 | 0.62 |
| AFP (ug/ml) | 2.85 ± 0.53 | 2.55 ± 0.33 | 0.62 |
| CA19-9 (unit/ml) | 12.92 ± 2.36 | 1704.6 2 ± 1687.17 | 0.39 |
Values are expressed as the mean ± standard deviation.
Abbreviations: CEA, carcinoembryonic antigen; AFP, alpha-fetoprotein; CA19-9, carbohydrate antigen19-9.
Figure 3
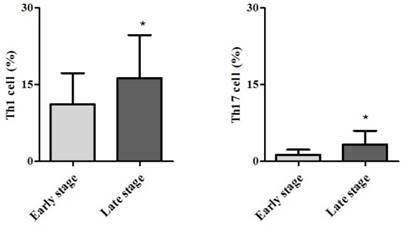
Expression of circulating T helper 1 (Th1) cell and 17 (Th17) cell in the blood. * p < 0.05 compared with Early stage
Figure 4
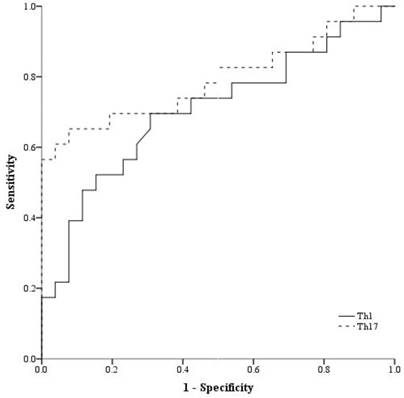
Receiver operation characteristic curve analysis. Abbreviations: Th1, expression of circulating T helper 1 cell in the blood; Th17, expression of circulating T helper 1 cell in the blood.
Figure 5
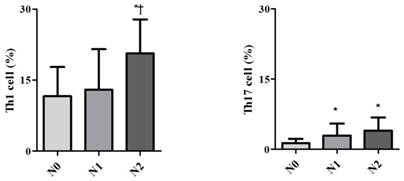
Expression of circulating T helper 1 (Th1) cell and 17 (Th17) cell in the blood according to lymph node invasion using TNM stage. * p < 0.05 compared with N0 stage † p < 0.05 compared with N1 stage
A previous study demonstrated that CD4+ T cells play an important role in mediating immune responses to tumours [10]. However, the two groups did not significantly differ with regard to levels of CD4+ T cells in this study. On the other hand, some subsets did show differences. Th1 cells make IFN-γ as their 'signature cytokine', and they also uniquely produce lymph toxin. Thus, we predicted that circulating Th1 cells would show differential expression under conditions with and without lymph node invasion. Another subset involves Th17 cells, which play important roles in inflammation and autoimmune disease; thus, they may be relevant to anti-tumour defence activities. Recently, it has been shown that Th17 cells can play promoting or suppressing roles in different cancer models [11,12]. Zhang et al. demonstrated that the blood levels of the Th17 cells with Th1 cells of cervical cancer patients were strongly correlations with their levels of Th22 cells, which have been associated with lymph node invasion [13]. Especially in colorectal cancer, Th17 cells are involved in the promotion and progression of the tumour through angiogenesis. Angiogenesis may be associated with local invasion and distant metastasis [14]. Increased levels of Th17 cells, in addition to increased levels of Th1 cells, may be considered indicative of lymph node invasion, as shown here. The increases in Th1 and Th17 cell levels were remarkable in the present study. Thus, they may be useful as blood markers to detect the presence of lymph node invasion in colorectal cancer.
A key protein in Treg cells is Foxp3 [15]. High levels of expression of Foxp3 in Treg cells inhibit an effector immune cell response to a tumour, thereby promoting tumour growth and invasion [16]. Tumour tissue in patients with colorectal cancer with lymph node invasion typically shows higher levels of Treg cells compared with that in those with no lymph node invasion, resulting in the former's poor survival and prognosis [17, 18]. However, we did not observe any difference in the blood samples in this study. Thus, the levels of Treg cells in the tumour tissue were not reflected by their levels in the blood.
CD8+ T cell and NK cells are typical innate immune cells. They respond first to dysplastic or tumour cells and perform anti-tumour activities. Their levels continue to be high after initiation of an adaptive immune response. The levels of CD 8+ T cells and NK cells have been used as indicators of the results of cancer treatment, such as survival rate, but not of cancer progression [19, 20, 21]. Thus, we did not find any differences in the levels of CD8+ T cells or NK cells between those with or without lymph node invasion in this study.
In the present study, we did not check the levels of immune cells in the cancer tissue or lymph nodes. Although confirmative results would be obtained from the cancer tissue or lymph nodes, the levels of immune cells could also be affected and changed by anaesthetic conditions and by the surgical procedure used for their procurement. Moreover, the more investigations might concrete the results although cut-off values of blood levels of Th1 and Th17 cells, used to distinguish Early and Late stages, were recommended in the present study.
In conclusion, patients with colorectal cancer with lymph node invasion showed higher blood levels of Th1 and 17 cells. The blood levels of Th1 and Th17 cells increased as lymph node invasion increased. However, the blood levels of other immune cells did not show any significant differences according to lymph node invasion. Thus, the blood levels of Th1 and Th17 cells might be useful as predictive markers of lymph node invasion in colorectal cancer.
Acknowledgements
This research was supported by Basic Science Research Program through the National Research Foundation of Korea (NRF) funded by the Ministry of Science, ICT and future Planning (Grant number: 2015R1A2A2A01006779, 2015).
Roles of the Authors
All authors read and accepted Terms and Conditions of Journal of Cancer.
Ji yeon Lee: data collection, data analysis and interpretation, manuscript composition.
Eun-Hye Seo, Ph.D.: data collection, data analysis and interpretation, manuscript composition.
Chung-Sik Oh, M.D., Ph.D.: data collection, data analysis and interpretation.
Se-Won Park, M.D.: data collection, data analysis and interpretation.
Jin-Hee Paik, M.D., Ph.D.: data collection, data analysis and interpretation.
Dae-Yong Hwang, M.D., Ph.D.: data collection, data analysis and interpretation.
Seung Hyun Lee, M.D., Ph.D.: data analysis and interpretation.
Seong-Hyop Kim, M.D., Ph.D.: study design, data collection, data analysis and interpretation, manuscript composition.
The research was thesis of master degree for Ji yeon Lee.
Competing Interests
The authors have declared that no competing interest exists.
References
1. Akagi Y, Adachi Y, Kinugasa T, Oka Y, Mizobe T, Shirouzu K. Lymph node evaluation and survival in colorectal cancer: review of population-based, prospective studies. Anticancer Res. 2013Jul;33(7):2839-47
2. Shively JE, Beatty JD. CEA-related antigens: molecular biology and clinical significance. Crit Rev Oncol Hematol. 1985;2:355-99
3. Petrioli R, Licchetta A, Roviello G, Pascucci A, Francini E, Bargagli G, Conca R, Miano ST, Marzocca G, Francini G, Multidisciplinary Oncology Group on Gastrointestinal Tumors. CEA and CA19.9 as early predictors of progression in advanced/metastatic colorectal cancer patients receiving oxaliplatin-based chemotherapy and bevacizumab. Cancer Invest. 2012;30:65-71
4. Hu Y, Wang JL, Tao HT, Wu BS, Sun J, Cheng Y, Dong WW, Li RX. Expression and significance of TSGF, CEA and AFP in patients before and after radical surgery for colon cancer. Asian Pac J Cancer Prev. 2013;14:3877-80
5. Grivennikov SI, Greten FR, Karin M. Immunity, inflammation, and cancer. Cell. 2010;19:883-99
6. Ferrone C, Dranoff G. Dual roles for immunity in gastrointestinal cancers. J Clin Oncol. 2010;28:4045-51
7. Klampfer L. Cytokines, inflammation and colon cancer. Curr Cancer Drug Targets. 2011;11:451-64
8. Terzić J, Grivennikov S, Karin E, Karin M. Inflammation and colon cancer. Gastroenterology. 2010;138:2101-14
9. Edge SB, Compton CC. Compton. The American Joint Committee on Cancer: the 7th edition of the AJCC cancer staging manual and the future of TNM. Annals of surgical oncology. 2010;17:1471-74
10. Kennedy R, Celis E. Multiple roles for CD4+ T cells in anti-tumor immune responses. Immunol Rev. 2008;222:129-44
11. Murugaiyan G, Saha B. Protumor vs antitumor functions of IL-17. J Immunol. 2009;183:4169-75
12. Wu D, Wu P, Huang Q, Liu Y, Ye J, Huang J. Interleukin-17: a promoter in colorectal cancer progression. Clinical and Developmental Immunology. 2013;2013:436307
13. Zhang W, Tian X, Mumtahana F, Jiao J, Zhang T, Croce KD, Ma D, Kong B, Cui B. The existence of Th22, pure Th17 and Th1 cells in CIN and Cervical Cancer along with their frequency variation in different stages of cervical cancer. BMC Cancer. 2015;16:717
14. Liu J, Duan Y, Cheng X, Chen X, Xie W, Long H, Lin Z, Zhu B. IL-17 is associated with poor prognosis and promotes angiogenesis via stimulating VEGF production of cancer cells in colorectal carcinoma. Biochem Biophys Res Commun. 2011;407:348-54
15. Fontenot JD, Rasmussen JP, Williams LM, Dooley JL, Farr AG, Rudensky AY. Regulatory T cell lineage specification by the forkhead transcription factor foxp3. Immunity. 2005;22:329-41
16. Marzano AV, Vezzoli P, Fanoni D, Venegoni L, Berti E. Primary cutaneous T-cell lymphoma expressing FOXP3: a case report supporting the existence of malignancies of regulatory T cells. J Am Acad Dermatol. 2009;61:348-55
17. Kim M, Grimmig T, Grimm M, Lazariotou M, Meier E, Rosenwald A, Tsaur I, Blaheta R, Heemann U, Germer CT, Waaga-Gasser AM, Gasser M. Expression of Foxp3 in colorectal cancer but not in Treg cells correlates with disease progression in patients with colorectal cancer. PLoS One. 2013;8:e53630
18. Liu Z, Huang Q, Liu G, Dang L, Chu D, Tao K, Wang W. Presence of FOXP3 (+) Treg cells is correlated with colorectal cancer progression. Int J Clin Exp Med. 2014;7:1781-5
19. Lança T, Silva-Santos B. The split nature of tumor-infiltrating leukocytes: Implications for cancer surveillance and immunotherapy. Oncoimmunology. 2012;1:717-25
20. Naito Y, Saito K, Shiiba K, Ohuchi A, Saigenji K, Nagura H, Ohtani H. CD8+ T cells infiltrated within cancer cell nests as a prognostic factor in human colorectal cancer. Cancer Res. 1998;25:3491-94
21. Coca S, Perez-Piqueras J, Martinez D, Colmenarejo A, Saez MA, Vallejo C, Martos JA, Moreno M. The prognostic significance of intratumoral natural killer cells in patients with colorectal carcinoma. Cancer. 1997;79:2320-8
22. Verma C, Eremin JM, Robins A, Bennett AJ, Cowley GP, El-Sheemy MA, Jibril JA, Eremin O. Abnormal T regulatory cells (Tregs: FOXP3+, CTLA-4+), myeloid-derived suppressor cells (MDSCs: monocytic, granulocytic) and polarised T helper cell profiles (Th1, Th2, Th17) in women with large and locally advanced breast cancers undergoing neoadjuvant chemotherapy (NAC) and surgery: failure of abolition of abnormal treg profile with treatment and correlation of treg levels with pathological response to NAC. J Transl Med. 2013;15:11-6
23. Lindau D, Gielen P, Kroesen M, Wesseling P, Adema GJ. The immunosuppressive tumour network: myeloid-derived suppressor cells, regulatory T cells and natural killer T cells. Immunology. 2013;138:105-15
Author contact
![]() Corresponding author: Seong-Hyop Kim, M.D., Ph.D., Department of Anesthesiology and Pain medicine, Konkuk University Medical Center, Konkuk University School of Medicine, Neudong-ro, Hwayang-dong, Gwangjin-gu, Seoul 143-729, Korea Tel: +82-2-2030-5454 Fax: +82-2-2030-5449 E-mail: yshkim75net
Corresponding author: Seong-Hyop Kim, M.D., Ph.D., Department of Anesthesiology and Pain medicine, Konkuk University Medical Center, Konkuk University School of Medicine, Neudong-ro, Hwayang-dong, Gwangjin-gu, Seoul 143-729, Korea Tel: +82-2-2030-5454 Fax: +82-2-2030-5449 E-mail: yshkim75net
Citation styles
APA
Lee, J.Y., Seo, E.H., Oh, C.S., Paik, J.H., Hwang, D.Y., Lee, S.H., Kim, S.H. (2017). Impact Of Circulating T Helper 1 And 17 Cells in the Blood on Regional Lymph Node Invasion in Colorectal Cancer. Journal of Cancer, 8(7), 1249-1254. https://doi.org/10.7150/jca.18230.
ACS
Lee, J.Y.; Seo, E.H.; Oh, C.S.; Paik, J.H.; Hwang, D.Y.; Lee, S.H.; Kim, S.H. Impact Of Circulating T Helper 1 And 17 Cells in the Blood on Regional Lymph Node Invasion in Colorectal Cancer. J. Cancer 2017, 8 (7), 1249-1254. DOI: 10.7150/jca.18230.
NLM
Lee JY, Seo EH, Oh CS, Paik JH, Hwang DY, Lee SH, Kim SH. Impact Of Circulating T Helper 1 And 17 Cells in the Blood on Regional Lymph Node Invasion in Colorectal Cancer. J Cancer 2017; 8(7):1249-1254. doi:10.7150/jca.18230. https://www.jcancer.org/v08p1249.htm
CSE
Lee JY, Seo EH, Oh CS, Paik JH, Hwang DY, Lee SH, Kim SH. 2017. Impact Of Circulating T Helper 1 And 17 Cells in the Blood on Regional Lymph Node Invasion in Colorectal Cancer. J Cancer. 8(7):1249-1254.
This is an open access article distributed under the terms of the Creative Commons Attribution (CC BY-NC) license (https://creativecommons.org/licenses/by-nc/4.0/). See http://ivyspring.com/terms for full terms and conditions.