Journal of Cancer
ISSN: 1837-9664
3.2
Impact Factor
ISSN: 1837-9664

 Global reach, higher impact
J Cancer 2017; 8(3):425-433. doi:10.7150/jca.17315 This issue Cite
Research Paper
A nomogram for predicting the probability of recurrence in patients with carcinomas located in the ampulla of Vater
Keng-Hao Liu1*, Chih-Ho Hsu1,2*, Jun-Te Hsu1, Chun-Yi Tsai1, Yu-Yin Liu 1, Tsann-Long Hwang1, Ta-Sen Yeh1,4, Yu-Shin Hung3, Wen-Chi Chou3,4 ![]()
1. Department of Surgery, Chang Gung Memorial Hospital, Linkou, Taiwan;
2. Division of General Surgery, Department of Surgery, Far-Eastern Memorial Hospital, Taipei, Taiwan;
3. Department of Hematology-Oncology, Chang Gung Memorial Hospital, Linkou, Taiwan;
4. Graduate Institute of Clinical Medical Sciences, Chang Gung University College of Medicine, Taoyuan, Taiwan.
*Both authors have equal contribution.
Received 2016-8-23; Accepted 2016-11-14; Published 2017-2-10
Citation:
Liu KH, Hsu CH, Hsu JT, Tsai CY, Liu YY, Hwang TL, Yeh TS, Hung YS, Chou WC. A nomogram for predicting the probability of recurrence in patients with carcinomas located in the ampulla of Vater. J Cancer 2017; 8(3):425-433. doi:10.7150/jca.17315. https://www.jcancer.org/v08p0425.htm
Other stylesAbstract
Background and Objectives: The standard treatment for carcinomas of the ampulla of Vater (CAV) is surgical resection. Nevertheless, recurrence is observed in half of the patients within five years after cancer surgery. In this study, we aimed to identify predictive factors and develop a nomogram capable of predicting the risk of recurrence in post-resection CAV patients.
Methods: Our study cohort was composed of two hundred and twelve patients who had undergone radical surgery for CAV between 2000 and 2012. Clinicopathological variables predictive of recurrence were identified using univariate analysis. A Cox proportional hazards model was used to select the predictive factors used for the nomogram.
Results: The 5-year overall survival, cancer-specific survival and disease-free survival rates were 44.3%, 51.1%, and 42.8%, respectively. The five most predictive variables for tumor recurrence were chosen to develop the nomogram. The nomogram had a highly predictive performance, with a bootstrap-corrected concordance index of 0.72 (95% confidence interval, 0.67-0.79). Furthermore, the performance of the nomogram was found to be better than the American Joint Committee on Cancer (AJCC) staging system due to better homogeneity, higher ability of discrimination and higher risk stratification of the model.
Conclusions: We developed a predictive nomogram for estimating tumor relapse probability in CAV patients after radical surgery. This nomogram might be more informative than the AJCC staging system and may allow for better estimation of the probability of relapse after surgical resections.
Keywords: Ampulla Vater cancer, recurrence probability, nomogram, calibration.
Introduction
Carcinomas of the ampulla of Vater (CAV) are defined as malignancies involving the papilla of Vater, a complex region where the common bile duct, the pancreatic duct, and the duodenum converge. CAVs are relatively uncommon neoplasms, with the incidence of CAV being approximately 4 to 4.8 cases per million populations each year [1]. Compared to patients with pancreatic adenocarcinomas, CAV patients have better treatment outcomes, most likely due to the earlier appearance of obstructive symptoms and more favorable overall tumor behavior [2]. The standard treatment for localized CAVs is surgical resection. However, the 5-year rate of recurrence for post-resection patients ranges between 40-62% [2-5]. Therefore, accurate prognostic stratification of post-resection CAV patients may assist clinicians in counseling patients appropriately and selecting for patients who are likely to benefit from adjuvant therapy.
The American Joint Committee on Cancer (AJCC) staging system [6] is the universally used staging classification for predicting long-term outcomes in CAV patients and tailoring for optimal adjuvant treatments. Primary tumor invasion and the status of nodal metastases, both accounted for by the AJCC staging system, have been well identified as predictors for potential tumor recurrence in CAV patients [3,4,7,8,9]. Furthermore, many clinicopathological risk factors for recurrence, in addition to the T- and N-classification, have been identified, including age [10], morphological pattern of the gross tumor [1], histological differentiation [1, 8, 10], resection margin [2], and perineural [11] and lymphovascular invasion [11, 12, 13]. However, due to the inherent limitations imposed by the rarity of the disease and the widely heterogeneous clinicopathological variables available for analysis, a number of studies are remarkably contradictory on the potential predictive factors associated with CAV [4-13]. We aimed to identify the predictive factors of CAV and to develop a nomogram capable of predicting the risk of recurrence in post-resection CAV patients.
Materials and methods
Patient selection
A total of 212 patients, diagnosed with CAV at Chang Gung Memorial Hospital (CGMH), Linkou, between 2000 and 2010, formed the patient cohort in this retrospective cohort study. All patients were treated either by a standard pancreaticoduodenectomy (PD) or a pylorus-preserving pancreaticoduodenectomy (PPPD) based on the surgeon's preference. Regional lymphadenectomy included the dissection of the lymph nodes in the hepatoduodenal ligament, along the superior mesenteric vessels, and on the surface of the pancreas. Patients who had major vascular encasements resulting in macroscopic incomplete resections, were diagnosed with distant metastases and treated by palliative resections, possessed pathological cell types that were neither adenocarcinomas nor poorly differentiated carcinomas, or underwent ampullectomy, were excluded. The adjuvant treatment strategies, including radiotherapy or/and chemotherapy, for cases with poor prognostic factors (positive surgical margin, perineural invasion, or lymph node metastases) were determined by a multi-disciplinary cancer team conference. The local Institutional Review Board of CGMH (104-1696B) approved this study.
Data collection
Data on patient demographics, preexisting comorbidity, histological differentiation, pathological characteristics of the tumor, surgical method, and tumor stage were collected by retrospectively reviewing the available medical records. The Charlson comorbidity index (CCI) was calculated based on the patients' preexisting comorbidities [14]. The tumor stage was determined according to the seventh edition of the pathological tumor-node-metastasis (pTNM) staging system issued by the American Joint Committee on Cancer (AJCC) [6]. The dates for tumor recurrence and death were obtained from our institutional cancer registration center. This study assessed disease-free survival (DFS), which was defined as the time from initial surgery to the date of recurrence, and was based on clinical and/or radiological examinations. The overall survival (OS) was defined as the time period ranging from the date of surgery to the date of death, while cancer-specific survival (CSS) was defined as the time period ranging from the date of surgery to the date of death due cancer-specific causes. All of the included patients were followed-up on until their date of death or until June 30, 2014.
Statistical Analysis
The basic demographic data was summarized as n (%) for categorical variables and as the median within a range for continuous variables. Survival time was calculated using the Kaplan-Meier method. Factors predictive of recurrence were identified using univariate analysis. A Cox proportional hazards model was used to select predictors for the final nomogram. The nomogram was internally validated by assessing discrimination and calibration. The bootstrapping method (1000 repetitions) was used to obtain a relatively unbiased estimate of the model's performance. Discrimination was measured using the concordance index (c-index), with values ranging from 0.5 (no discrimination) to 1.0 (perfect discrimination). Calibration was assessed by plotting the predicted probability vs. the actual probability for quintiles of the predicted probability of recurrence. The homogeneity likelihood ratio, discriminatory ability, c-index, and Akaike information criterion (AIC) were calculated to determine the performance of both the nomogram and the AJCC staging system. All statistical analyses were performed using SPSS 17.0 software (SPSS Inc., Chicago, IL, USA) and R version 2.9.1 (The R Foundation for Statistical Computing, Vanderbilt University, TN) using the Hmisc and Design libraries. All statistical assessments were considered significant when p < 0.05.
Results
The demographic data of the patients are summarized in Table 1. The median age of the patients was 61 years (range, 34-90 years) and 57% of the patients were male. The median CCI of the patients was 3 (range 2-8). One hundred and twelve (52.8%) patients underwent PD, whereas 100 (47.2%) patients underwent PPPD. Well and moderately/poor differentiated histological differentiation was noted in 51 (24.1%) and 141 (85.9%) patients, respectively. Microscopic examination revealed that lymphovascular and perineural invasion was detected in 80 (37.7%) and 51 (24.1%) patients, respectively. In regards to T classification, 6.1%, 40.1% and 53.8% of patients were classified as having T1, T2, and T3 disease, respectively. The median lymph node retrieval number was 13 (range, 3-53) and lymph node metastases were noted in 104 (49.1%) patients. Based on the AJCC staging system, 11 (5.1%) patients had stage IA diseases, 56 (26.4%) had stage IB diseases, 41 (19.3%) had stage IIA diseases, and 104 (49.1%) had stage IIb diseases.
The median follow-up period was 32.6 (range 0.1-174.0) months and tumor recurrence was observed in 114 (51.4%) patients. The 5-year DFS, CSS, and OS rates were 42.8%, 51.1%, and 44.3%, respectively (Figure 1). Factors predictive of recurrence based on univariate analysis can be seen in Table 2. The most significant prognostic factors that influenced DFS in the univariate analysis were histological differentiation, pathological T classification, pathological N classification, lymphovascular invasion, and perineural invasion. No differences in DFS were noted to be due to age, gender, World Health Organization (WHO) performance status, microscopic resection margin, comorbidities, or surgical procedure. All five variables possessing statistical significance for predicting the rate of recurrence were chosen to develop the nomogram (Figure 2). The calibration plots of data generated using the nomogram, by plotting the observed 2-year, and 5-year disease-free probability against the predicted 2-year, and 5-year disease-free probability, can be seen in Figure 3A and 3B. The dotted line represents the actual DFS probability, while the red line represents the performance of the nomogram in predicting the DFS probability. The two lines overlap closely, indicating that the nomogram accurately estimated the probability of recurrence in our patient cohort.
Table 1
Clinicopathological demographics of patients with carcinomas located in the ampulla of Vater.
| Factors | No. of patients |
|---|---|
| Age (years) | |
| Median (range) | 61 (34-90) |
| Gender | |
| Male | 120 (56.6) |
| Female | 92 (43.4) |
| WHO performance status | |
| 0~1 | 199 (93,9) |
| 2 | 13 (6.1) |
| Tumor size (cm) | |
| Median (range) | 2.2 (0.8-14) |
| Operation time (minutes) | |
| Median (range) | 421 (204-857) |
| Follow up time (months) | |
| Median (range) | 39.0 (2.7-174.0) |
| Charlson comorbidity index | |
| Median (range) | 3 (2-8) |
| Operation method | |
| PPPD | 100 (47.2) |
| PD | 112 (52.8) |
| Differentiation | |
| Well | 51 (24.1) |
| Moderate | 141 (66.5) |
| Poor | 20 (9.4) |
| Microscopic resection margin | |
| Positive | 7 (3.3) |
| Negative | 205 (96.7) |
| Lymphovascular invasion | |
| Positive | 80 (37.7) |
| Negative | 132 (62.3) |
| Perineural invasion | |
| Positive | 51 (24.1) |
| Negative | 161 (75.9) |
| AJCC7th T classification | |
| T1 | 13 (6.1) |
| T2 | 85 (40.1) |
| T3 | 114 (53.8) |
| AJCC7th N classification | |
| N0 | 108 (50.9) |
| N1 | 104 (49.1) |
| Positive lymph node number | |
| Median (range) | 2 (1-10) |
| AJCC7th staging | |
| IA | 11 (5.1) |
| IB | 56 (26.4) |
| IIA | 41 (19.3) |
| IIB | 104 (49.1) |
| Adjuvant chemotherapy | |
| Yes | 111 (52.3) |
| No | 101 (47.7) |
Percentages are added in parentheses after the patient numbers unless otherwise stated.
PPPD, pylorus-preserving pancreaticoduodenectomy; PD, pancreaticoduodenectomy; WHO, World Health Organization; AJCC, American Joint Committee on Cancer.
Figure 1
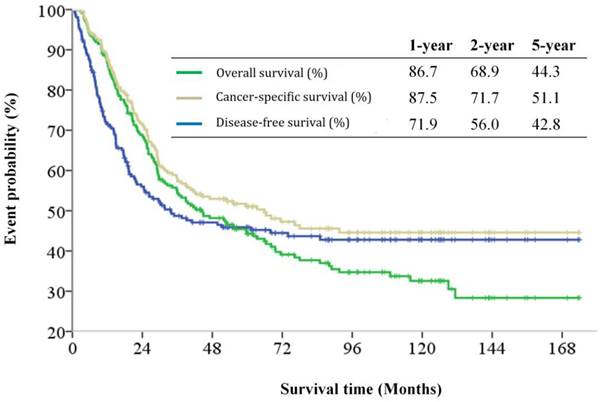
Kaplan-Meier disease-free survival, cancer-specific survival and overall survival curves for patients with carcinomas of the ampulla of Vater after surgical resection.
Figure 2
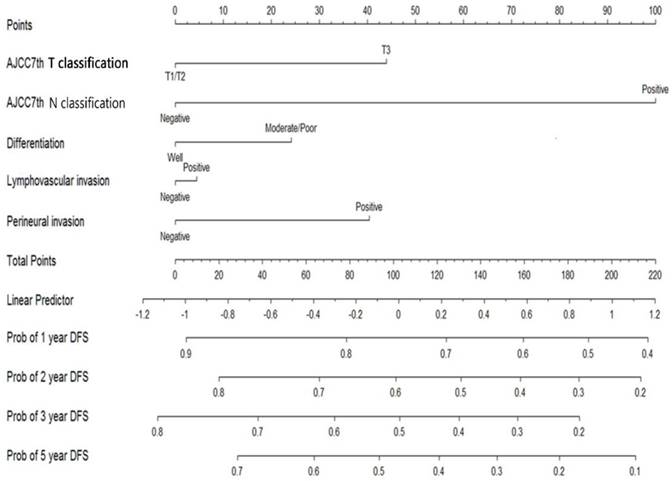
Nomogram for predicting recurrence probability in patients with carcinomas located in the ampulla of Vater.
DFS could be grouped into three prognostic groups (defined as low, intermediate, and high-risk groups located at the cup-points of the 16th, 50th, and 85th centile [mean ± standard deviation] of the total score, respectively) according to the score generated by the nomogram (Figure 4A). These cut-points approximately corresponded to the mean and ± 1 standard deviation of the continuous variables. This is designed to minimize the loss of information resulted from grouping. The 5-year DFS rate for patients in the low, intermediate, and high-risk groups were 81.8%, 59.6%, and 24.2%, respectively. A significant statistical difference was identified within these three groups (Log-rank p <0.001).
Based on the AJCC staging system, the cumulative incidence of tumor recurrence in patients with different cancer stages is shown in Figure 4B. The 5-year DFS for stages IA, IB, IIA, and IIB were 80.8%, 69.8%, 59.9%, and 23.5%, respectively. A significant statistical difference was identified within these four groups (Log-rank p <0.001).
The performances of both the AJCC system and the nomogram in predicting disease-free probability can be seen in Table 3. The homogeneity likelihood ratios were 47.3 and 56.7 of the AJCC system and nomogram (p=0.009), respectively, which indicated that the nomogram had a smaller difference within the model and had a better homogeneity than the AJCC system. The linear trend chi-square tests were 47.4 and 59.8 for the AJCC system and nomogram, respectively. The bootstrap-corrected concordance indexes (c-index) were 0.72 (95% CI, 0.67 to 0.79) and 0.68 (95% CI, 0.63 to 0.72) for the nomogram and the AJCC system (p<0.001), respectively. Both tests indicated that the nomogram had a better capacity for discrimination than the AJCC system. The AIC values of the AJCC system and the nomogram were 1090.1 and 1083.5, respectively. Again, the smaller AIC value observed with the nomogram indicated higher predictive stratification ability than the AJCC system.
Discussion
In this study, we developed a nomogram that was capable of predicting tumor relapse probability in CAV patients, based on data obtained from our study cohort composed of 212 CAV patients. The nomogram accurately predicted tumor relapse probability and was internally validated with a bootstrapped corrected c-index of 0.72. This study showed that our nomogram might be more informative than the AJCC staging system for clinicians and would allow to better estimate the probability of relapse after surgical resections.
The OS and CSS curves were closely overlapping during the first two years and gradually separated as the curves passed the five-year mark. Furthermore, the DFS curve showed that a significant proportion of patients had recurrent disease immediately after the operation and that the slope reached a plateau at the 5-year interval. Similar to previous report [15], our collected data highlighted that the highest probability of recurrence was within 5 years after the operation, and relapsing cancer was the primary cause-of-death in our patient cohort. As recurring tumor would inevitably impact survival outcomes in patients, an accurate predictive model of tumor relapse could provide clear information that would improve counseling for survival outcomes and adjuvant therapies in CAV patients.
Table 2
Predictive factors for disease-free survival.
| Factors | No. | Median, months | 95% CI | P-value |
|---|---|---|---|---|
| Gender | 0.68 | |||
| Male | 120 | 34.0 | 0-80.1 | |
| Female | 92 | 33.7 | 0-75.2 | |
| Age (years) | 0.53 | |||
| ≤60 | 99 | 33.7 | 0-86.6 | |
| >60 | 113 | 30.3 | 5.3-55.4 | |
| Charlson comorbidity index | 0.29 | |||
| ≤3 | 166 | 39.2 | 0-82.5 | |
| >3 | 46 | 26.3 | 13.2-39.4 | |
| WHO performance status | 0.23 | |||
| 0~1 | 199 | 31.8 | 11.6-51.9 | |
| 2 | 13 | n/a | n/a | |
| Operation type | 0.64 | |||
| PPPD | 100 | 39.2 | 0-91.2 | |
| PD | 112 | 30.3 | 7.8-52.9 | |
| Differentiation | 0.005 | |||
| Well | 51 | n/a | n/a | |
| Moderate/poor | 161 | 24.5 | 15.0-34.0 | |
| AJCC 7th T classification | <0.001 | |||
| T1/T2 | 98 | n/a | n/a | |
| T3 | 114 | 18.2 | 12.3-24.1 | |
| AJCC 7th N classification | <0.001 | |||
| N0 | 108 | n/a | ||
| N1 | 104 | 15.0 | 6.7-60.8 | |
| Microscopic resection margin | ||||
| Negative | 205 | 83.8 | 72.6-94.9 | 0.71 |
| Positive | 7 | 101.9 | 40.3-136.3 | |
| Lymphovascular invasion | <0.001 | |||
| Negative | 132 | n/a | n/a | |
| Positive | 80 | 14.8 | 9.3-20.3 | |
| Perineural invasion | <0.001 | |||
| Negative | 161 | 67.9 | n/a | |
| Positive | 51 | 10.0 | 4.5-15.5 | |
| Adjuvant chemotherapy | <0.001 | |||
| Yes | 111 | 17.9 | 11.6-24.1 | |
| No | 101 | n/a | n/a |
CI, confidence interval; PPPD, pylorus-preserving pancreaticoduodenectomy; PD, pancreaticoduodenectomy; n/a, not available; WHO, World Health Organization; AJCC, American Joint Committee on Cancer.
Table 3
Assessment of prognostic performance between the AJCC 7th stage model and the nomogram model.
| Model | Homogeneity | Monotonicity and discriminatory ability | Akaike information criterion (AIC)## | |
|---|---|---|---|---|
| Likelihood ratio test* | Linear Trend χ2 test** | C-index# (95% CI) | ||
| AJCC7th stage | 47.26 | 47.36 | 0.675 (0.633-0.717) | 1090.11 |
| Current nomogram | 56.66 | 59.75 | 0.717 (0.671-0.793) | 1083.45 |
*Higher homogeneity likelihood ratio indicates a smaller difference within the model and is an indicator of better homogeneity (p-value: 0.009).
**Higher χ2 test values of linear trend indicate better discriminatory ability and gradient monotonicity between the two models.
# Testing the difference between two correlated overall c-indices (p-value: <0.001). Higher c- index means better discriminatory ability between the two models.
## Smaller AIC values indicate better optimistic prognostic stratification between the two models.
Figure 3
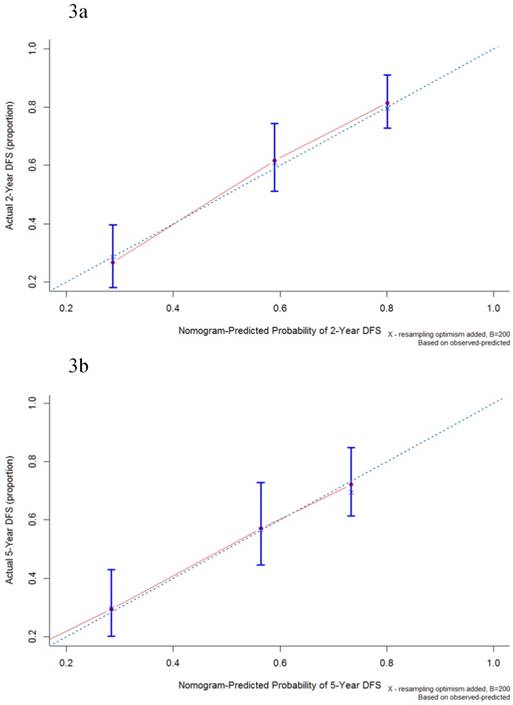
Calibration plot of the nomogram-predicted disease-free survival at 2-year (3a) and 5-year (3b) intervals. The dotted line represents the ideal line where the actual probability of recurrence matches the predicted probability. The solid line represents the observed recurrence where the actual probability is perfectly merged with the predicted probability.
The AJCC staging system is the most widely applied model for predicting survival outcomes in patients with CAVs. Similar to previous studies [3,4,7,8,9], this study identified the T and N classification of the AJCC system as independent predictive factors for tumor recurrence. Based on this, the AJCC staging system could be used to predict relapse probability in CAV patients. However, the AJCC staging system has inherent limitations, as it ignores the impact of other clinicopathological variables. In addition, there are doubts about the viability of current T1 and T2 classifications in CAV patients, mainly due to the complex anatomy at the ampulla of Vater. You et al. have recently proposed a novel reclassification system, pT1a for tumors within the sphincter of Oddi, T1b for tumors beyond the sphincter of Oddi or in the duodenum, and T2 for tumors showing invasion into the duodenal muscle [16]. There were only 13 AJCC T1 patients in our cohort. Among them, 9 were T1a, 2 were T1b and the remaining 2 were T2 based on You et al.'s study. Their 5-year overall survivals were 100% (9/9), 50% (1/2), and 50% (1/2), respectively. Because of the small numbers in each group, we were unable to calculate the prognostic value in our cohort using You et al.'s model. In addition to the T and N classification, our study identified that histological differentiation, lymphovascular invasion, and perineural invasion were also independent predictors of tumor recurrence. Our analysis showed that incorporated clinicopathological variables, in conjunction with the anatomic extent, increased the accuracy of our nomogram beyond that of the AJCC staging system in CAV patients.
Figure 4
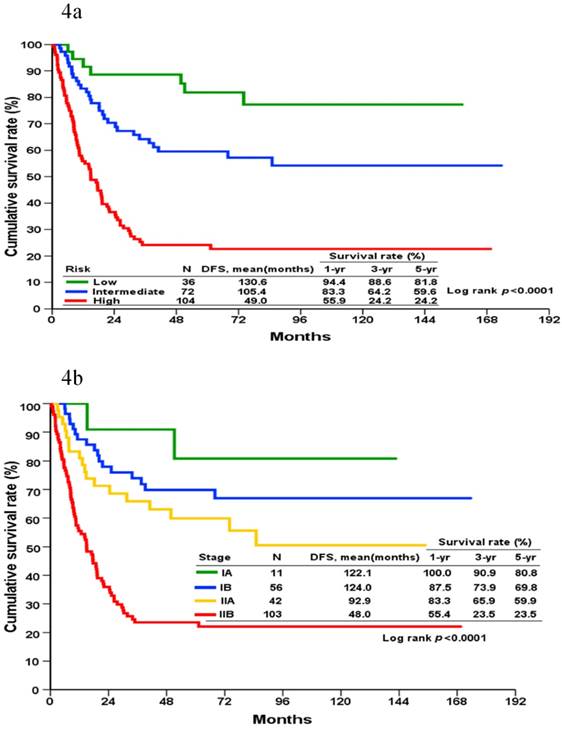
Kaplan-Meier disease-free survival curves for patients categorized into different prognostic groups according to the nomogram (4a) and the AJCC staging system (4b).
The N classification was the highest contributing factor in this model, as the presence of nodal involvement implies a high risk of liver metastases and lowered prognosis [17-20]. In contrast to other gastrointestinal cancers, the importance of other variables of the regional lymph node, such as metastatic lymph node numbers (LNN) or metastatic lymph node ratio (LNR), for CAV prognosis remains unclear [21]. Hurtuk et al. reported that higher LNR is associated with significantly poorer survival in patients with periampullary malignancies [17]. We previously reported LNR greater than 0.056 predicted a poor DFS and OS in patients with resectable CAVs [22]. However, other studies have reported that LNN may be a better indicator of poorer prognosis than LNR [21,23,24]. We believed the utility of the N-classification would improve the accessibility of the nomogram and avoid any concerns related to the influence of LNR in patients with fewer numbers of lymph node retrievals, regardless of the debate surrounding the standard or extended lymphadenectomy in CAV patients.
The AEGO multicenter cohort recently proposed a prognostic score that predicted the DFS of ampullary carcinomas and was constructed by using four independent predictive clinicopathological variables, including stage (IA~IIA vs. IIB ~III), age (<75 years vs. ≥75 years), physical performance status (WHO status 0~1 vs. 2), and grade of differentiation (well vs. moderately vs. poorly) [10]. In contrast to the AEGO's study, age and performance were not associated with DFS in our patient cohort. This may be due to a relatively small number of elderly patients (15% of the AEGO cohort and 12% of our cohort, age ≥ 75 years) and poor performance (8% of the AEGO cohort and 6% of our cohort, WHO performance 2) in our cohort. In addition, both factors could also be the result of selection bias as to whom to operate. Because of the low number of patients and events within this subgroup, selection bias and inadequate statistical might skew the results of our survival analysis.
In our cohort, 52% of the patients received adjuvant chemotherapy and 4% of the patients received adjuvant radiotherapy. All patients received either gemcitabine or 5-Fluorouracil as their adjuvant chemotherapy. Previous studies have reported that adjuvant chemotherapy is a positive predictive factor for pancreatic cancer after surgical resection. In our patient cohort, patients received adjuvant chemotherapy had poorer disease-free survival than those did not. The decision on prescribing adjuvant chemotherapy could be confounded by other variables; which may potentially result in selection bias. Moreover, we did not include adjuvant chemotherapy in the initial analysis because of a lack of clinical consensus on its application [25]. All the clinicopathological variables used for the nomogram were easily accessible whenever the pathological report was composed and therefore we believe that this model could be used in routine clinical practice to assist physicians and patients in postoperative surveillance and selecting for the proper adjuvant treatment.
To our knowledge, this is the first study that has demonstrated a nomogram capable of predicting recurrence probability CAV patients. Based on the clinicopathological variables of each patient, the nomogram could assign numerous predictions for chances in relapse probability at different time points. However, our study was also subject to several limitations. First, a selection bias might exist because our study was retrospective in nature. The standard treatment for patients with CAV is Whipple procedure and only patients with adequate physical reserve and good performance will be selected for the procedure. This resulted in the small number of older patients and poorer performance group, which might limit the generalization of the nomogram. Second, this study recruited patients over an 11-year duration, during which practice patterns and medical care approaches might have changed. Third, even with the nomogram internally validated by bootstrapped correction, it is essential that the nomogram is externally validated before it can be widely used. However, even when considering inherent inaccuracies of the model, the performance of our nomogram is superior to the AJCC staging system due to better homogeneity, higher ability of discrimination and higher risk stratification of the model.
This study developed a predictive nomogram for estimating tumor relapse probability in CAV patients after radical surgery. This nomogram might be more informative than the AJCC staging system for clinicians and CAV patients as it would allow to better estimating the probability of relapse after surgical resections.
Acknowledgements
The authors would like to thank all members of the Chang Gung Memorial Hospital Cancer Center for their help in data collection. We would also like to extend our gratitude to Ms. Shu-Fang Huang from the Center for Clinical Research in Chang Gung Memorial Hospital for her invaluable contribution in biostatistics and figure illustration.
Conflicts of Interest
This research was not funded by any public, commercial, or nonprofit agency. No competing financial interests exist.
References
1. Albores-Saavedra J, Schwartz AM, Batich K. et al. Cancers of the ampulla of vater: demographics, morphology, and survival based on 5,625 cases from the SEER program. J Surg Oncol. 2009;100(7):598-605
2. Sommerville CAM, Limongelli P, Pai M. et al. Survival analysis after pancreatic resection for ampullary and pancreatic head carcinoma: an analysis of clinicopathological factors. J Surg Oncol. 2009;100(7):651-6
3. Hsu HP, Yang TM, Hsieh YH. et al. Predictors for patterns of failure after pancreaticoduodenectomy in ampullary cancer. Ann Surg Oncol. 2007;14(1):50-60
4. Kim RD, Kundhal PS, McGilvray ID. et al. Predictors of failure after pancreaticoduodenectomy for ampullary carcinoma. J Am Coll Surg. 2006;202(1):112-9
5. Tol JA, Brosens LA, van Dieren S. et al. Impact of lymph node ratio on survival in patients with pancreatic and periampullary cancer. Br J Surg. 2015;102(3):237-45
6. UICC TNM. In: Classification of Malignant Tumours; 7th edition. New York: Wiley & Liss. 2009
7. O'Connell JB, Maggard MA, Manunga J Jr. et al. Survival after resection of ampullary carcinoma: a national population- based study. Ann Surg Oncol. 2008;15(7):1820-7
8. Park JS, Yoon DS, Kim KS. et al. Factors influencing recurrence after curative resection for ampulla of Vater carcinoma. J Surg Oncol. 2007;95(4):286-90
9. Qiao QL, Zhao YG, Ye ML. et al. Carcinoma of the ampulla of Vater: factors influencing long-term survival of 127 patients with resection. World J Surg. 2007;31(1):137-43
10. Colussi O, Voron T, Pozet A. et al. Prognostic score for recurrence after Whipple's pancreaticoduodenectomy for ampullary carcinomas; results of an AGEO retrospective multicenter cohort. Eur J Surg Oncol. 2015;41(4):520-6
11. Carter JT, Grenert JP, Rubenstein L. et al. Tumors of the ampulla of vater: histopathologic classification and predictors of survival. J Am Coll Surg. 2008;207(2):210-8
12. Todoroki T, Koike N, Morishita Y. et al. Patterns and predictors of failure after curative resections of carcinoma of the ampulla of Vater. Ann Surg Oncol. 2003;10(10):1176-83
13. Balachandran P, Sikora SS, Kapoor S. et al. Long-term survival and recurrence patterns in ampullary cancer. Pancreas. 2006;32(4):390-5
14. Charlson ME, Pompei P, Ales KL. et al. A new method of classifying prognostic comorbidity in longitudinal studies: development and validation. J Chronic Dis. 1987;40(5):373-83
15. Yamaguchi K, Enjoji M, Tsuneyoshi M. Pancreatoduodenal carcinoma: a clinicopathologic study of 304 patients and immunohistochemical observation for CEA and CA19-9. J Surg Oncol. 1991;47(3):148-54
16. You D, Heo J, Choi S. et al. Pathologic T1 subclassification of ampullary carcinoma with perisphincteric or duodenal submucosal invasion: Is it T1b? Arch Pathol Lab Med. 2014;138(8):1072-6
17. Hurtuk MG, Hughes C, Shoup M. et al. Does lymph node ratio impact survival in resected periampullary malignancies? Am J Surg. 2009;197(3):348-52
18. Moriya T, Kimura W, Hirai I. et al. Nodal involvement as an indicator of postoperative liver metastasis in carcinoma of the papilla of Vater. J Hepatobiliary Pancreat Surg. 2006;13(6):549-55
19. Falconi M, Crippa S, Domı´nguez I. et al. Prognostic relevance of lymph node ratio and number of resected nodes after curative resection of ampulla of Vater carcinoma. Ann Surg Oncol. 2008;15(11):3178-86
20. Sierzega M, Nowak K, Kulig J. et al. Lymph node involvement in ampullary cancer: the importance of the number, ratio, and location of metastatic nodes. J Surg Oncol. 2009;100(1):19-24
21. Sakata J, Shirai Y, Wakai T. et al. Assessment of the nodal status in ampullary carcinoma: the number of positive lymph nodes versus the lymph node ratio. World J Surg. 2011;35(9):2118-24
22. Hsu CH, Chen TD, Tsai CY. et al. Prognostic value of the metastatic lymph node ratio in patients with resectable carcinoma of ampulla of Vater. Medicine (Baltimore). 2015;94(42):e1859
23. Sierzega M, Nowak K, Kulig J. et al. Lymph node involvement in ampullary cancer: the importance of the number, ratio, and location of metastatic nodes. J Surg Oncol. 2009;100(1):19-24
24. Pomianowska E, Westgaard A, Mathisen Ø. et al. Prognostic relevance of number and ratio of metastatic lymph nodes in resected pancreatic, ampullary, and distal bile duct carcinomas. Ann Surg Oncol. 2013;20(1):233-41
25. Neoptolemos JP, Moore MJ, Cox TF. et al. Effect of adjuvant chemotherapy with fluorouracil plus folinic acid or gemcitabine vs observation on survival in patients with resected periampullary adenocarcinoma: the ESPAC-3 periampullary cancer randomized trial. JAMA. 2012;308(2):147-56
Author contact
![]() Corresponding author: Wen-Chi Chou, M.D., Department of Hematology-Oncology, Chang Gung Memorial Hospital, Linkou, 5 Fu-Hsing Street, Kwei-Shan Shiang, Taoyuan 333, Taiwan. Tel: 886-3281200 Ext: 2517; Fax: 886-3-3285818; E-mail: wenchi3992com.tw
Corresponding author: Wen-Chi Chou, M.D., Department of Hematology-Oncology, Chang Gung Memorial Hospital, Linkou, 5 Fu-Hsing Street, Kwei-Shan Shiang, Taoyuan 333, Taiwan. Tel: 886-3281200 Ext: 2517; Fax: 886-3-3285818; E-mail: wenchi3992com.tw
Citation styles
APA
Liu, K.H., Hsu, C.H., Hsu, J.T., Tsai, C.Y., Liu, Y.Y., Hwang, T.L., Yeh, T.S., Hung, Y.S., Chou, W.C. (2017). A nomogram for predicting the probability of recurrence in patients with carcinomas located in the ampulla of Vater. Journal of Cancer, 8(3), 425-433. https://doi.org/10.7150/jca.17315.
ACS
Liu, K.H.; Hsu, C.H.; Hsu, J.T.; Tsai, C.Y.; Liu, Y.Y.; Hwang, T.L.; Yeh, T.S.; Hung, Y.S.; Chou, W.C. A nomogram for predicting the probability of recurrence in patients with carcinomas located in the ampulla of Vater. J. Cancer 2017, 8 (3), 425-433. DOI: 10.7150/jca.17315.
NLM
Liu KH, Hsu CH, Hsu JT, Tsai CY, Liu YY, Hwang TL, Yeh TS, Hung YS, Chou WC. A nomogram for predicting the probability of recurrence in patients with carcinomas located in the ampulla of Vater. J Cancer 2017; 8(3):425-433. doi:10.7150/jca.17315. https://www.jcancer.org/v08p0425.htm
CSE
Liu KH, Hsu CH, Hsu JT, Tsai CY, Liu YY, Hwang TL, Yeh TS, Hung YS, Chou WC. 2017. A nomogram for predicting the probability of recurrence in patients with carcinomas located in the ampulla of Vater. J Cancer. 8(3):425-433.
This is an open access article distributed under the terms of the Creative Commons Attribution (CC BY-NC) License. See http://ivyspring.com/terms for full terms and conditions.