Impact Factor ISSN: 1837-9664

 Global reach, higher impact
J Cancer 2017; 8(2):298-304. doi:10.7150/jca.17521 This issue Cite
Research Paper
Metabolomic analysis of human oral cancer cells with adenylate kinase 2 or phosphorylate glycerol kinase 1 inhibition
Eoon Hye Ji1*, Li Cui1*, Xiaoqing Yuan2*, Siliangyu Cheng1, Diana Messadi1, Xinmin Yan2, Shen Hu1 ![]()
1. School of Dentistry and Jonsson Comprehensive Cancer Center, University of California, Los Angeles, California 90095, United States.
2. Changzhou Second People's Hospital, Nanjing Medical University, Changzhou, 213003, China.
* Equal contribution.
Received 2016-9-9; Accepted 2016-10-29; Published 2017-1-15
Abstract
The purpose of this study was to use liquid chromatography-mass spectrometry (LC-MS) with XCMS for a quantitative metabolomic analysis of UM1 and UM2 oral cancer cells after knockdown of metabolic enzyme adenylate kinase 2 (AK2) or phosphorylate glycerol kinase 1 (PGK1). UM1 and UM2 cells were initially transfected with AK2 siRNA, PGK1 siRNA or scrambled control siRNA, and then analyzed with LC-MS for metabolic profiles. XCMS analysis of the untargeted metabolomics data revealed a total of 3200-4700 metabolite features from the transfected UM1 or UM2 cancer cells and 369-585 significantly changed metabolites due to AK2 or PGK1 suppression. In addition, cluster analysis showed that a common group of metabolites were altered by AK2 knockdown or by PGK1 knockdown between the UM1 and UM2 cells. However, the set of significantly changed metabolites due to AK2 knockdown was found to be distinct from those significantly changed by PGK1 knockdown. Our study has demonstrated that LC-MS with XCMS is an efficient tool for metabolomic analysis of oral cancer cells, and knockdown of different genes results in distinct changes in metabolic phenotypes in oral cancer cells.
Keywords: Liquid chromatography-mass spectrometry, XCMS, Oral cancer cells, Adenylate kinase 2, Phosphorylate glycerol kinase 1.
Introduction
Metabolomics aims to measure the expression levels of low-molecular-weight metabolites in the context of physiological stimuli or disease states. With the newly evolved mass spectrometry (MS) and nuclear magnetic resonance spectroscopy methods, metabolic profiling has now become a valuable approach to investigate the role of metabolism in human diseases and identifying biomarkers for clinical applications [1]. In our previous study, we developed a metabolomics methodology based on capillary ion chromatography/mass spectrometry (Cap IC/MS) for global profiling of metabolites in head and neck cancer cells and cancer stem cells (CSCs). With this powerful tool, more than 4000 metabolites were quantified from the cells and significant changes in metabolites of energy metabolism pathways were identified between CSCs and non-stem cancer cells (NSCCs) [2]. Recently we also demonstrated a targeted metabolomics approach based on IC-MS and stable isotope labeled internal standards for analyzing targeted metabolites in head and neck cancer cells and CSCs. These methods offer great technical advantages for metabolite analysis, including exquisite sensitivity, high speed and reproducibility, and wide dynamic range. Our analyses indicate that the metabolic phenotypes are distinct between high and low invasive head and neck cancer cells and between CSCs and NSCCs [3]. In addition, we have shown that the metabolic defects introduced by siRNA silencing of metabolic enzymes transketolase and adenylate kinase 2 (AK2) may be compensated in some cancer cells by alternative feedback metabolic mechanisms, suggesting that cancer cells may overcome single defective pathways through secondary metabolic network adaptations [4].
Similar to genomics and proteomics, MS-based metabolomics generates massive amount of data. Handling, processing and analysis of large metabolomics datasets can be very time-consuming and requires specialized mathematical, statistical and bioinformatics tools [5]. XCMS (xcmsonline.scripps.edu) is a cloud-based informatics platform that allows metabolomics researcher to easily upload and process LC-MS based metabolomics data. It provides a practical solution for untargeted metabolomic analysis workflow including feature detection, retention time correction, alignment, annotation, statistical analysis, and data visualization. Cloud plots generated with XCMS allows an effective representation of LC-MS-based metabolomics data by providing various information such as the p-value, the directional fold change, the retention time, and the mass-to-charge ratio of metabolic features within a defined threshold [6-8].
The purpose of this study was to conduct a quantitative metabolomic analysis of oral cancer cells after knockdown of metabolic enzyme AK2 or phosphorylate glycerol kinase 1 (PGK1). UM1 and UM2 cells were initially transfected with AK2 siRNA, PGK1 siRNA or scrambled control siRNA, and then LC-MS was used to globally profile the metabolites in the transfected cells. Finally, XCMS and cluster analysis were performed to analyze the metabolomic data to reveal significantly altered metabolites following AK2 or PGK1 inhibition. Our application has demonstrated this method is effective to reveal metabolomic changes related to perturbation of key metabolic enzymes.
Materials and Methods
Cell culture
UM1 and UM2 cells were cultured in the Dulbecco's modified eagle medium (DMEM) supplemented with 10% fetal bovine serum, penicillin (100 U/mL), and streptomycin (100 μg/mL) (Invitrogen, Carlsbad, CA, USA). The cells were maintained at 37 °C in a humidified 5% CO2 incubator and passaged when they reached 90-95% confluence.
siRNA knockdown
UM1 and UM2 cells were transfected with siRNA in 6-well plates using the Hilymax transfection regent (Dojindo Molecular Technologies, Rockville, MD, USA) according to the manufacturer's instruction. Validated double-stranded siRNAs of PGK1 (sc-36215) and AK2 (sc-38906) or non-target control siRNAs (Santa Cruz Biotech, Santa Cruz, CA, USA) were mixed with the Hilymax transfection reagent and then added to the cell culture. After 24 h treatment, the siRNA-containing medium were removed and the cells were further cultured in the fresh media for 48 h prior to metabolite extraction.
Western blotting
Protein samples were separated with 4-12% Bis-Tris NuPAGE gels (Invitrogen, Carlsbad, CA, USA) and transferred onto nitrocellulose membranes by the Trans-blot SD semi-dry transfer cell (Bio-Rad, Hercules, CA, USA). The membrane was then blocked with 5% non-fat dry milk (Santa Cruz Biotech) for one hour, and sequentially incubated with anti-PGK1 (Y-12, sc-17943) or anti-AK2 (H65, sc-28786) primary antibody (Santa Cruz Biotech) and corresponding secondary antibody (GE Healthcare, Piscataway, NJ, USA). The detection was performed with the ECL-Plus Western blot detection kit (GE Healthcare).
Metabolite extraction
Cultured cells were quickly washed twice with ice-cold phosphate-buffered saline (PBS) in a cold room to remove medium components and then quickly rinsed with Milli-Q water. After removal of water, 400 µL of CH3OH was added to each culture plate. The cells were placed in liquid N2 for 10 min, thawed, and sonicated for 10 min. This process was repeated three times in order to completely extract the metabolites from cells.
The combined samples from the extraction process were then centrifuged at 10,000 g for 5 min to pellet insoluble debris at 4 °C, with the supernatant transferred to microcentrifuge tubes and dried with a speed vacuum. Afterwards, each dried sample was resuspended, vortexed, centrifuged and transferred to autosampler vials for LC-MS analysis.
LC-MS and data analysis
Separation of metabolites was performed by reversed phase LC (HP1100, Agilent Technologies, Santa Clara, CA, USA) using a reversed-phase XBridge C18 column (1.7 µm particle size, 1x150 mm, Waters, Milford, MA, USA) and 8 µL of each sample was injected on the C18 column for analysis. Mobile phase A consisted of H2O/0.1% formic acid and the mobile phase B consisted of ACN with 0.1% formic acid. LC gradient was as follows: T= 0 min, 95% A/5% B; T = 25 min, 5% A/95% B; T = 33 min, 5%A/95%B (for re-equilibration of column). ESI source settings on Agilent 6520 Q-TOF instrument were as follows: drying gas flow, 8 L/min; gas temp, 250 °C; nebulizer pressure, 25 psi; sheath flow, 9 L/min; sheath temperature, 350 °C; fragmentor, 135 V; capillary, 4000 V. Mass spectral data from 70 to 1100m/z were collected in the positive ionization mode. All the samples were analyzed in triplicate.
Data analysis was performed by the XCMS Online at https://xcmsonline.scripps.edu/ using three steps: data upload, parameter selection, and result interpretation. Metabolomics features were defined as ions with a unique m/z and retention time and tentative identification was done by simply matching the m/z measurements with the Human Metabolome Database (HMDB). The metabolomics data resulting directly from XCMS Online were used to generate the cloud plot [7]. The metabolic features that showed significant changes in the cancer cells with AK2 or PGK1 knockdown were used to generate heat maps with the NetWalker 1.0 (https://netwalkersuite.org/).
Results and discussion
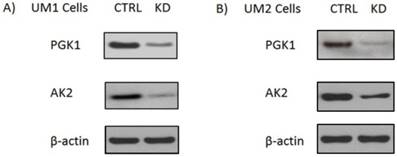
Adenylate kinases (AKs) are a set of enzymes that catalyze the nucleotide phosphoryl exchange reaction. Among them, AK2 is a metabolic enzyme expressed in the mitochondrial intermembrane space and plays a unique role in energy metabolism and transfer [9]. Recently studies show that AK2 might have important extra-mitochondrial functions. Mutation in AK2 was implicated in neutrophil differentiation arrest and sensorineural deafness[10]. Homozygous AK2 mutated embryos of Drosophila melanogaster ceased growth and died before reaching the third instar larval stage, indicating AK2 is indispensable for cell proliferation and development [11]. PGK1 is a glycolytic enzyme that catalyzes the conversion of 1,3-diphosphoglycerate to 3-phosphoglycerate. It is regulated by hypoxia-inducible factor-1α (HIF-1α) and has been demonstrated to involve in cell growth, angiogenesis, DNA replication/repair and cancer metastasis [12-15]. In order to assess the effect of PGK1 down-regulation ona metabolomic changes in oral cancer cells, we first used siRNA to knock down PGK1 expression in the UM1 and UM2 cells. As shown in Fig. 1, siPGK1 transfection led to a significant decline in the expression of PGK1 in both UM1 and UM2 cancer cells. Similarly, the expression level of AK2 was also significantly inhibited in UM1 and UM2 cells after siAK2 transfection.
Knockdown of AK2 or PGK1 expression in the UM1 and UM2 oral cancer cells with siRNA. (A) Western blot analysis of AK2 and PGK1 expression in UM1cells transfected with siRNA control (siCTRL), AK2 siRNA (siAK2) or PGK1 siRNA (siPGK1). (B) Western blot analysis of AK2 and PGK1 expression in the UM2 cells transfected with siCTRL, siAK2 or siPGK1.
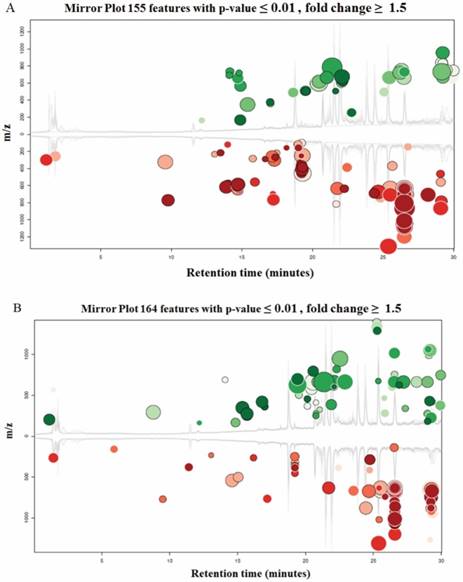
Both UM1 and UM2 cell lines are used in this study. They were initially established from the same tumor of a tongue cancer patient. However, UM1 cells are highly invasive whereas UM2 cells are low invasive[16]. Due to a large number of metabolites present in a biological sample and the wide dynamic concentration range of the compounds, characterizing the metabolome has been an analytical challenge. Here we have demonstrated that LC-MS with XCMS is an efficient tool for metabolomic analysis of UM1 and UM2 oral cancer cells. The LC-MS/MS data was analyzed through the XCMS Online with the following steps: uploading data, selecting parameters, and analyzing/visualizing data. Fig.2 shows the XCMS cloud plots of the quantitative metabolomic analysis results. With a stringent criteria of P<0.01 and fold change ≥1.5, 155 or 164 metabolic features were found to be significantly altered pertaining to AK2 or PGK1 down-regulation respectively. The cloud plot allows to present the information about metabolic features including p-value, the directional fold change, the retention time, and the mass-to charge ratio. In addition, the total ion chromatograms for each sample and the time-dependent composition of the mobile phase are shown. The intensity of features that is increased are shown as green dots on the top plot, whereas the features whose intensity is decreased are shown on the bottom plot in red. The size of each bubble corresponds to the log fold change of the feature. The larger the bubble the bigger the changes in levels, as calculated by the Welch t-test with unequal variances used calculate the statistical significance of the fold change. The fold change is represented by the intensity of the feature's color where features with high p-values are darker in compared with features with low p-values. The y coordinate of each feature corresponds to the mass-to charge ratio of the compound which is determined by MS.
Cloud plots present the metabolite features that are significantly altered between the cells transfected with siCTRL and those transfected with siAK2 (Fig. 2A) or siPGK1 (Fig. 2B) for knockdown.
In total, LC-MS with XCMS allows to detect 4280 changed metabolic features in the UM1 cells and 3183 changed metabolic features in the UM2 cells following AK2 knockdown respectively. Among these large lists of metabolites altered by siRNA knockdown, 448 metabolic features (339 downregulated and 109 upregulated) were found to be significantly changed in the UM1 cells and 369 metabolic features (225 downregulated and 114 upregulated) were found to be significantly changed in the UM2 cells (P< 0.05). Similarly, 4736 metabolic features were altered in the UM1 cells and 4212 metabolic features were altered in the UM2 cells after PGK1 knockdown. Among them, 585 metabolites (300 downregulated and 285 upregulated) in the UM1 cells and 417 metabolic features (316 downregulated and 101 upregulated) in the UM2 cells were altered significantly (P < 0.05) (Fig. 3).
The changes in metabolic features in oral cancer cells following the inhibition of metabolic enzymes. (A) The total number of metabolic features detected in the UM1 and UM2 cancer cells and the number of metabolic features that are significantly altered by either siAK2 or siPGK1 in the UM1 or UM2 cells. (B) Common set of metabolites between UM1 and UM2 cells that are significantly altered by AK2 knockdown. (C) Common set of metabolites between UM1 and UM2 cells that are significantly altered by PGK1 knockdown.
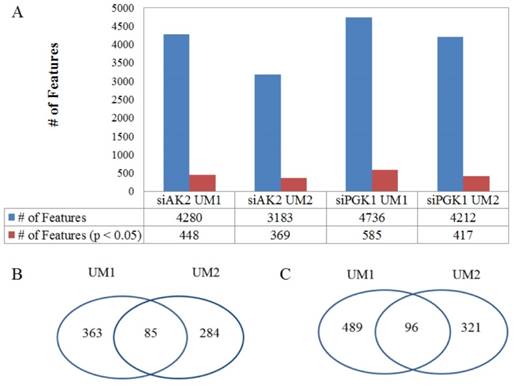
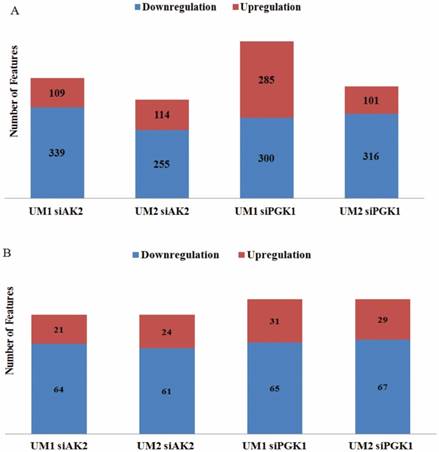
By comparing the significantly changed metabolic features between UM1 and UM2 cells, 85 metabolites were both detected in UM1 (64 downregulated and 21 upregulated) and UM2 cells (61 downregulated and 24 upregulated) after AK2 knockdown (Fig. 4). Similarly, 96 metabolites were commonly found between UM1 (65 downregulated and 31 upregulated) and UM2 cells (67 downregulated and 29 upregulated) following PGK1 knockdown (Fig. 4). However, our analysis indicates that the changes in metabolic features were distinct between the cancer cells with AK2 and those with PGK1 knockdown.
The number of upregulated/downregulated metabolic features in UM1 or UM2 cells due to AK2 or PGK1 knockdown. (A) The number of upregulated/downregulated metabolic features that were significantly changed in UM1 or UM2 cells with either AK2 or PGK1 knockdown (B) The number of upregulated/downregulated metabolic features which were commonly changed between UM1 and UM2 cells with AK2 or PGK1 knockdown.
As Schulze and Harris stated that profiling metabolites of cancer is difficult using MS because some metabolites were present with overlapping spectral peaks [17]. However, using XCMS for analysis of MS-based metabolomic data, metabolites can be well resolved and identified by using both accurate mass and retention time. The alignment procedure for retention time in XCMS helps to eliminate insignificant groups of peaks [18]. Eliminating these low resolution groups and incomplete signals using retention time alignment steps allows to select the peak groups with high intensity and good peak shape and to match peaks among samples very precisely [18].
As shown in Fig. 5, heat maps were generated with the NetWalker 1.0 program based on the significantly changed metabolites in the UM1 and UM2 cells after knockdown of AK2 or PGK1. Each row in the heat map represents a metabolic feature and the color indicates the expression levels of metabolic features between knockdown and control cells. Interestingly, as shown by the heat maps, there is a similar metabolic profile change caused by siAK2 knockdown between UM1 and UM2 cells. Similar heat maps were also observed between the UM1 and UM2 cells with siPGK1 knockdown. However, it should be noted that the set of metabolites that show significant difference between siPGK1 and siCTRL are completely distinct from the set of metabolites that show significant difference between siAK2 and siCTRL, suggesting that knockdown of different genes results in the changes in different set of metabolites. Some tentatively identified metabolites are listed in Supplemental Tables S1 and S2. They were simply matched by submitting m/z measurements to search against the HMDB database. Therefore, further verification is absolutely needed to confirm the identity of these metabolites. One of the potential metabolites significantly down-regulated in both UM1 and UM2 cells after AK2 knockdown was found to be cysteamine, which is an aminothiol and anti-oxidant that has potential for the treatment of radiation sickness and neurological disorders. In addition, it has been demonstrated to have anti-cancer effects in different types of cancers [19-21]. The reduced expression of cysteamine following AK2 inhibition suggests that oral cancer cells survived from AK2 knockdown might have a potential to become even more aggressive.
Heat maps for the significantly changed metabolites in the UM1 and UM2 cells after knockdown of AK2 (A) or PGK1 (B).
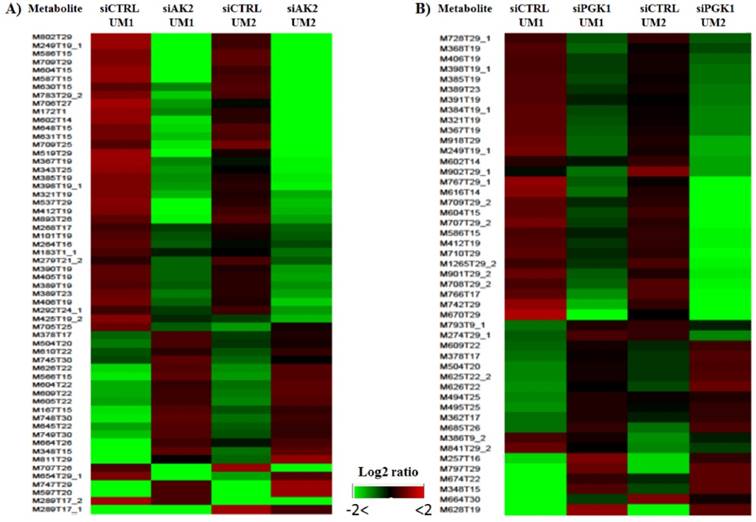
As a summary, our studies have demonstrated that LC-MS with XCMS is a highly effective methodology for untargeted metabolomic analysis of oral cancer cells. A single LC-MS based analysis less than 40 minutes allowed to detect more than 4000 metabolic features from oral cancer cells and reveal significantly altered metabolites in oral cancer cells due to AK2 or PGK1 knockdown. Cluster analysis of the results after XCMS analysis of the metabolomic data showed similar heat maps for the significantly altered metabolites between UM1 and UM2 cancer cells. However, the set of metabolites showing significant difference between siPGK1 and siCTRL are completely distinct from the set of metabolites showing significant difference between siAK2 and siCTRL, suggesting that knockdown of different genes results in the changes in different set of metabolites.
Supplementary Material
Supplementary tables.
Acknowledgements
This study was partially supported by the UC-CRCC program.
Competing Interests
The authors have declared that no competing interest exists.
References
1. Griffiths WJ, Koal T, Wang Y. et al. Targeted metabolomics for biomarker discovery. Angew Chem Int Ed Engl. 2010;49:5426-45
2. Wang J, Christison TT, Misuno K. et al. Metabolomic profiling of anionic metabolites in head and neck cancer cells by capillary ion chromatographywith Orbitrap mass spectrometry. Anal Chem. 2014;86:5116-24
3. Hu S, Wang J, Ji EH. et al. Targeted metabolomic analysis of head and neck cancer cells using high performance ion chromatography coupled with a Q Exactive HF mass spectrometer. Anal Chem. 2015;87:6371-9
4. Zhang M, Chai YD, Brumbaugh J. et al. Oral cancer cells my rewire alternative metabolic pathways to survive from siRNA silencing of metabolic enzymes. BMC Cancer. 2014;14:223
5. Shulaev V. Metabolomics technology and bioinformatics. Brief Bioinform. 2006;7:128-39
6. Patti GJ, Tautenhahn R, Rinehart D. et al. A view from above: cloud plots to visualize global metabolomic data. Anal Chem. 2013;85:798-804
7. Tautenhahn R, Patti GJ, Rinehart D. et al. XCMS Online: a web-based platform to process untargeted based platform to process untargeted metabolomic data. Anal Chem. 2012Jun5;84:5035-9
8. Tautenhahn R, Cho K, Uritboonthai W. et al. An accelerated workflow for untargeted metabolomics using the METLIN database. Nat Biotechnol. 2012;30:826-8
9. Dzeja P, Terzic A.Adenylate kinase, AMP signaling networks. metabolic monitoring, signal communication and body energysensing. Int J Mol Sci. 2009;10:1729-72
10. Lagresle-Peyrou C, Six EM, Picard C. et al. Human adenylate kinase 2 deficiency causes a profound hematopoietic defect associated with sensorineuraldeafness. Nat Genet. 2009;41:106-11
11. Fujisawa K, Murakami R, Horiguchi T. et al. Adenylate kinase isozyme 2 is essential for growth and development of Drosophila melanogaster. Comp Biochem Physiol B Biochem Mol Biol. 2009;153:29-38
12. Lay AJ, Jiang XM, Kisker O. et al. Phosphoglycerate kinase acts in tumour angiogenesis as a disulphide reductase. Nature. 2000;408:869-73
13. Popanda O, Fox G, Thielmann HW. Modulation of DNA polymerases alpha, delta and epsilon by lactate dehydrogenase and 3-phosphoglyceratekinase. Biochim Biophys Acta. 1998;1397:102-17
14. Vishwanatha JK, Jindal HK, Davis RG. The role of primer recognition proteins in DNA replication: association with nuclear matrix in HeLa cells. J Cell Sci. 1992;101:25-34
15. Ahmad SS, Glatzle J, Bajaeifer K. et al. Phosphoglycerate kinase 1 as a promoter of metastasis in colon cancer. Int J Oncol. 2013;43:586-90
16. Misuno K, Liu X, Feng S. et al. Quantitative proteomic analysis of sphere-forming stem-like oral cancer cells. Stem Cell Res Ther. 2013;4:156
17. Schulze A, Harris AL. How cancer metabolism is tuned for proliferation and vulnerable to disruption. Nature. 2012;491:364-73
18. Smith CA, Want EJ, O'Maille G. et al. XCMS: processing mass spectrometry data for metabolite profiling using nonlinear peak alignment, matching, and identification. Anal Chem. 2006;78:779-87
19. Fujisawa T, Rubin B, Suzuki A. et al. Cysteamine suppresses invasion, metastasis and prolongs survival by inhibiting matrix metalloproteinases in a mouse model of human pancreatic cancer. PLoS One. 2012;7:e34437
20. Wan XM, Zheng F, Zhang L. et al. Autophagy-mediated chemosensitization by cysteamine in cancer cells. Int J Cancer. 2011;129:1087-95
21. Wu C, Shi L, Li Q. et al. New strategy of efficient inhibition of cancer cells by carborane carboxylic acid-CdTe nanocomposites. Nanomedicine. 2012;8:860-9
Author contact
![]() Corresponding author: Shen Hu, PhD, MBA. CHS 63-070, 10833 Le Conte Ave, Los Angeles, CA 90095; E-mail: shenhuedu; Tel: (310) 206-8834; Fax: (310) 794-7109. Xin-min Yan, MD. Changzhou Second People's Hospital, Nanjing Medical University, Changzhou, 213003, China, Email:xinmin_yan999com, Tel: +86-519-88104931.
Corresponding author: Shen Hu, PhD, MBA. CHS 63-070, 10833 Le Conte Ave, Los Angeles, CA 90095; E-mail: shenhuedu; Tel: (310) 206-8834; Fax: (310) 794-7109. Xin-min Yan, MD. Changzhou Second People's Hospital, Nanjing Medical University, Changzhou, 213003, China, Email:xinmin_yan999com, Tel: +86-519-88104931.